2814
Comparability of mcTFI QSM and 2D GRE CMB Detection: Implications for for Alzheimer’s Anti-Amyloid Therapy1Radiology, Beth Israel Deaconess Medical Center, Harvard Medical School, Boston, MA, United States, 2Atrius Health, Boston, MA, United States, 3Neurology, Beth Israel Deaconess Medical Center, Harvard Medical School, Boston, MA, United States, 4Department of Neurological Surgery, Cooper University Health Care, Cooper Medical School of Rowan University, Camden, NJ, United States, 5Neurosurgery, Beth Israel Deaconess Medical Center, Harvard Medical School, Boston, MA, United States, 6GE Healthcare, New York, NY, United States, 7Department of Radiology, Weill Cornell Medicine, New York, NY, United States
Synopsis
Keywords: Alzheimer's Disease, Quantitative Susceptibility mapping, CMB, 2D GRE, mcTFI, Anti-amyloid therapy
Cerebral microbleeds/microhemorrhages (CMB) are used for risk stratification, including for the hemorrhagic complication ARIA-H of Alzheimer’s anti-amyloid therapy. For AD, risk information is based on many trials using 2DGRE technique, which is MRI field and parameter dependent. The use of techniques that better distinguish CMB mimics, like calcifications, is limited by an unclear relationship to 2D GRE CMB depiction. In this study we found the number of CMB candidate lesions between 2D GRE and mcTFI QSM obtained during the same scan session highly correlated, suggesting mcTFI could be used in the management of pathologies evaluating presence and number of CMBs.INTRODUCTION:
Cerebral microbleeds / microhemorrhages (CMBs) are brain hemosiderin perivascular collections, measuring up to 10 mm diameter[1-4]. CMBs are associated with multiple pathologies, including increased risk of intracranial hemorrhage (ICH)[4, 7]. More than a specific number of CMBs (e.g. greater than 4 in the case of aducanumab[8]), can be an exclusion criteria for anti-amyloid therapies for Alzheimer’s patients, out of concern for the drug complication of ARIA-H[9]. These criteria arise from years of 2DGRE based MRI evaluation for CMBs. Limitations of 2DGRE include inability to distinguish CMBs from calcifications, and variable appearance based on scanning parameters[10]. Combining this technique with head CT still has challenges in detecting calcifications under 100 Hounsfield units (HU)[2, 11-13]. Newer MRI techniques, such as quantitative susceptibility mapping(QSM) can better distinguish CMB from calcification than SWI / SWIP[10], with mcTFI QSM shown to better quantify susceptibility[14] and correlate with hemorrhage age[15]. However, the undefined relationship between CMB depiction on 2DGRE and these newer techniques hinder their application to patient management. In this study we seek to define the relationship between 2D GRE and mcTFI QSM CMB depiction.METHODS:
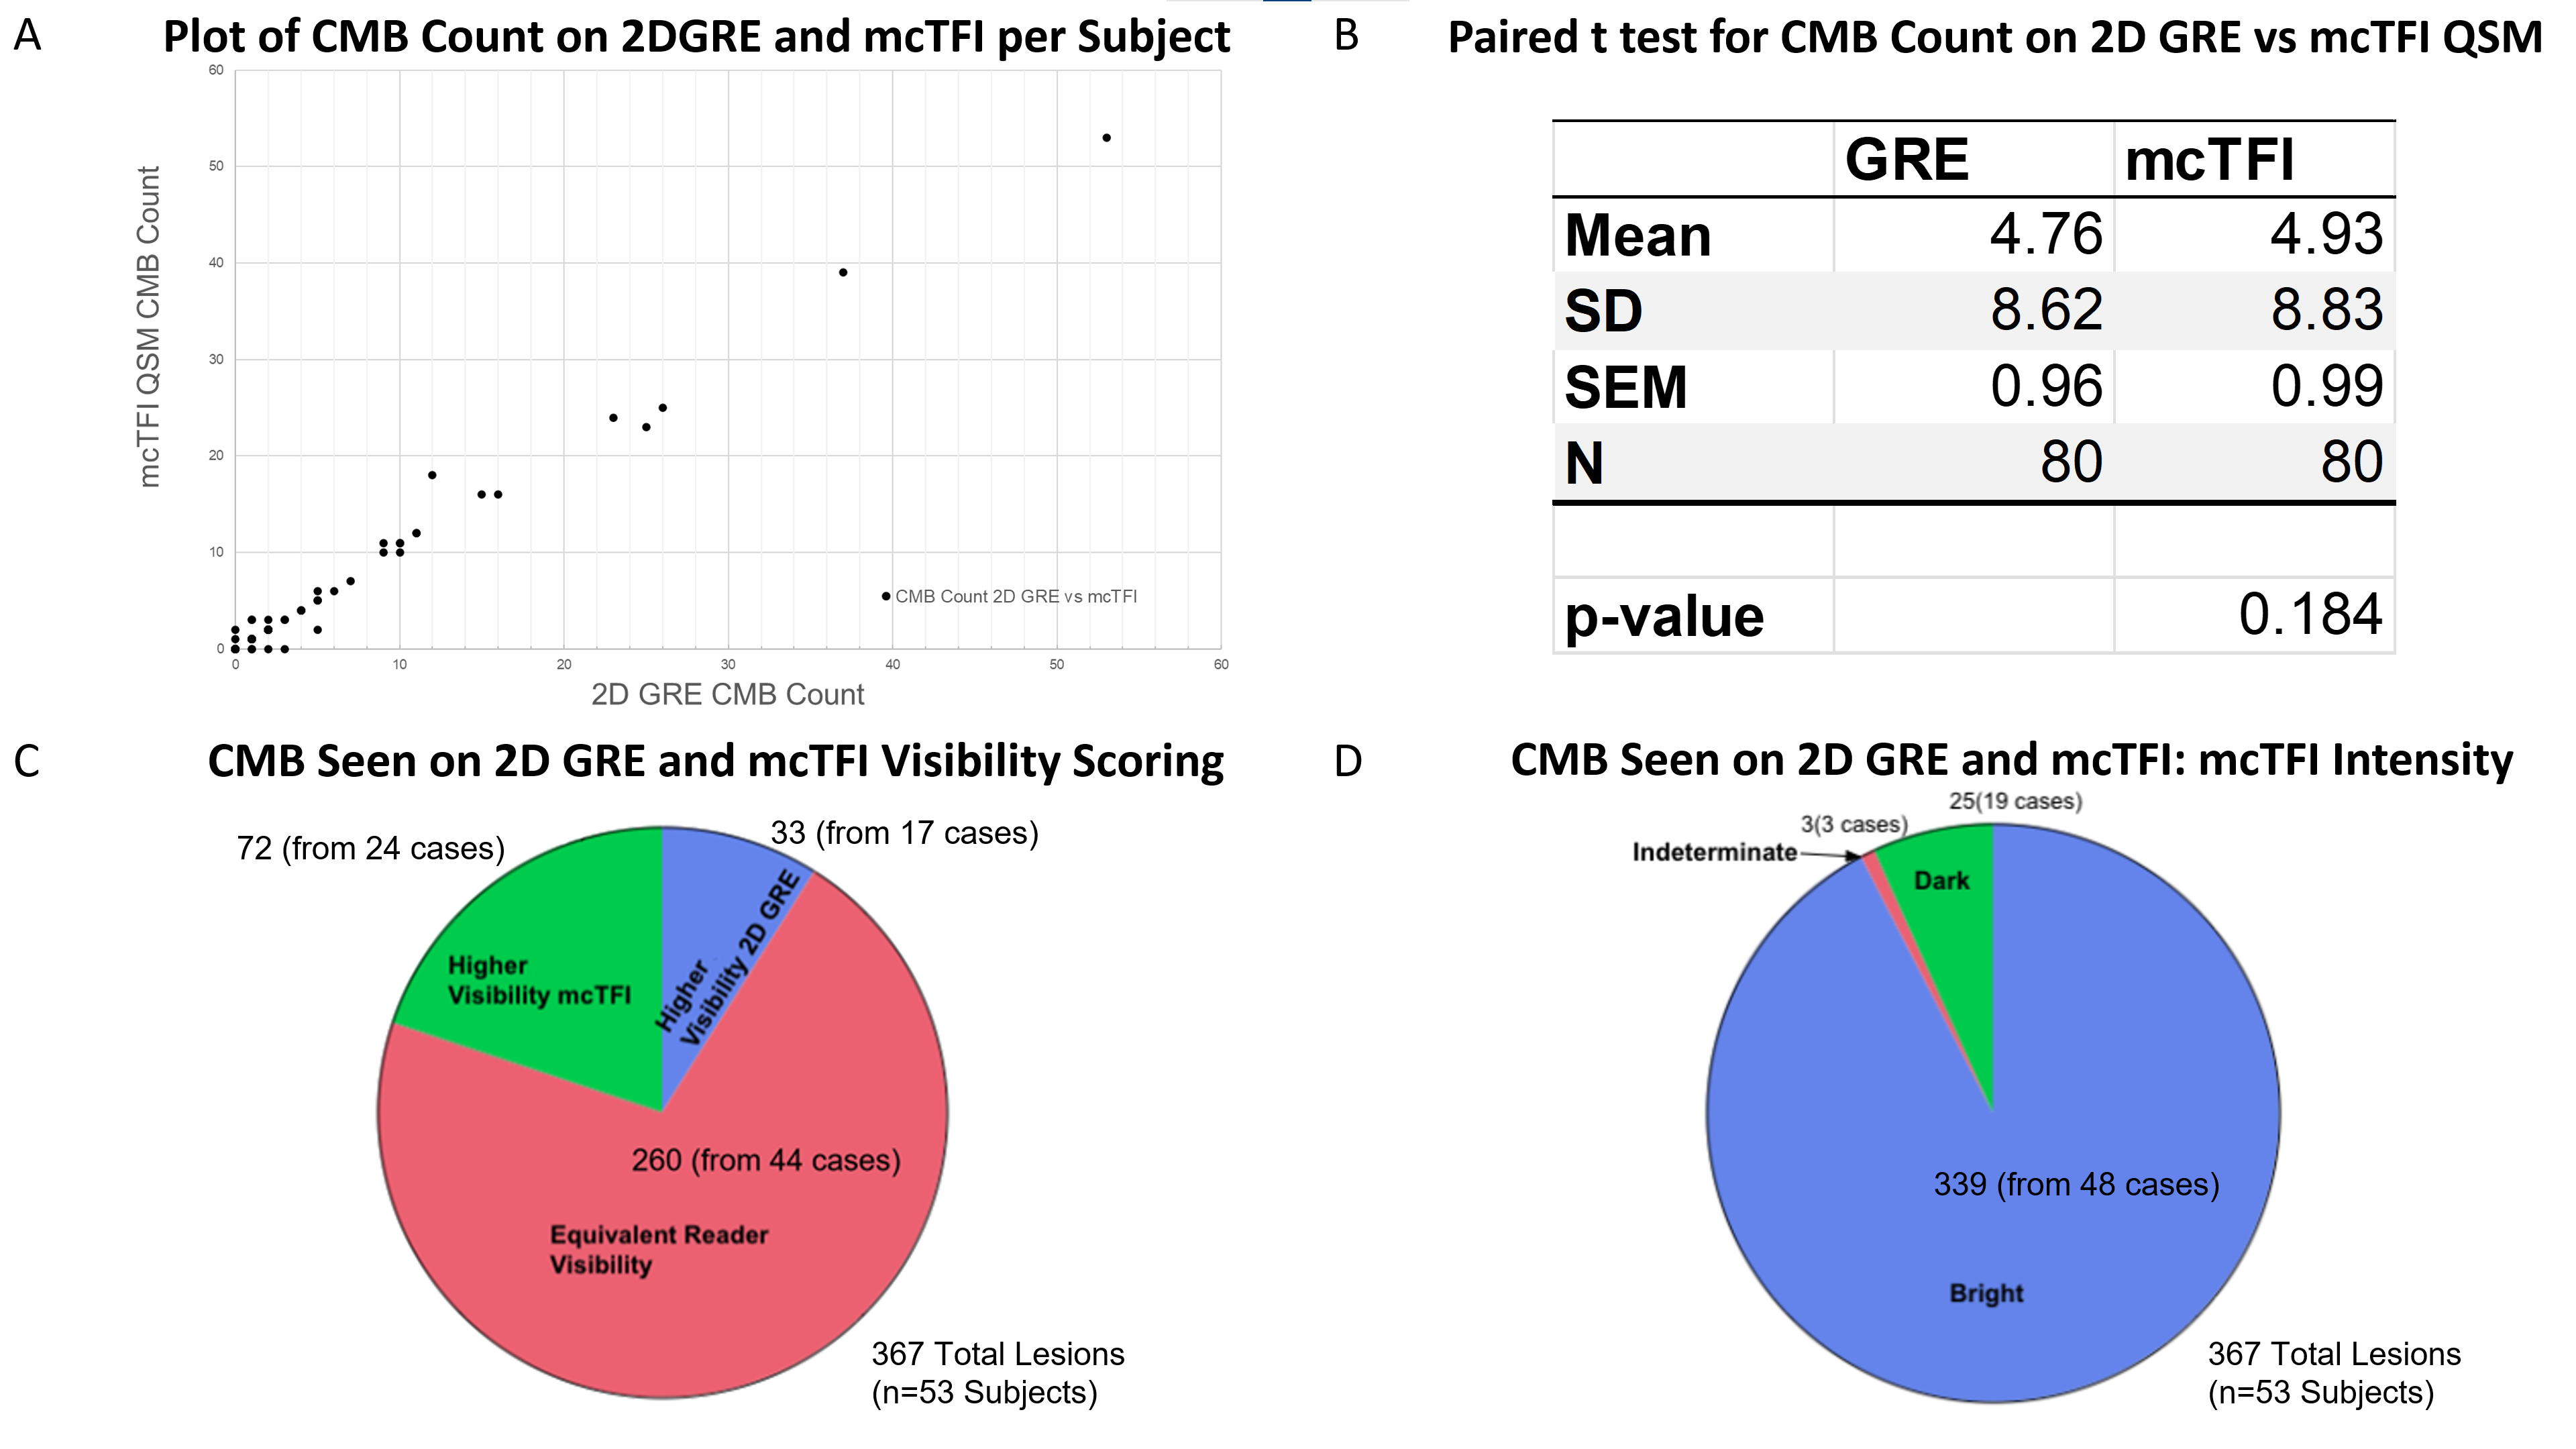
Under IRB approved retrospective protocol, 80 subjects who underwent brain MRI that included both 2DGRE and multiecho 3DGRE (MEGRE) during the same scan session were recruited. Subjects with ICH were studied to increase CMB presence likelihood. All MRI data were obtained on the same MR system (Discovery MR750; GE Healthcare) at 3.0 T using a 32-channel head coil. The ME GRE scan parameters were first echo time, 3.648 msec; echo spacing, 3.984 msec; 11 echoes; repetition time, 47.424 msec; bandwidth, 62.5 kHz; voxel size, 0.5 x 0.5 x 1 mm3; flip angle 12°; acquisition matrix, 256 x 256; reconstruction matrix, 512 x 512; total scan time, 4 minutes 30 seconds. The 2D GRE scan parameters were TR 417, TE 9.2, Flip angle 20, voxel size 0.5 x 0.5 x 6.5, acquisition matrix, 320 x 256; reconstruction matrix, 512 x 512; total scan time, 2 minutes 37 seconds. The ME GRE images were used to generate mcTFI images[14]. Bright mcTFI lesions correspond to paramagnetic structures, and dark lesions to diamagnetic. Images were reviewed by a CAQ certified neuroradiologist and a non-physician research assistant trained on CMB evaluation to generate a consensus evaluation. Images were evaluated for CMBs using published rating criteria[2]. For lesions seen on both image types, relative visibility using a 3-point scale ranging from more visible on 2D GRE, equally visible on both, through more visible on mcTFI were recorded. When lesions were not visible on the mcTFI, the mcTFI images were evaluated for the presence of artifacts. For all mcTFI lesions, intensity was recorded to identify if the lesion would be bright (e.g., Blood as seen in CMB) or dark (e.g., calcification). When the single mcTFI lesion intensity was partially bright or dark on a single slice or across, they were classified as indeterminate intensity.RESULTS:
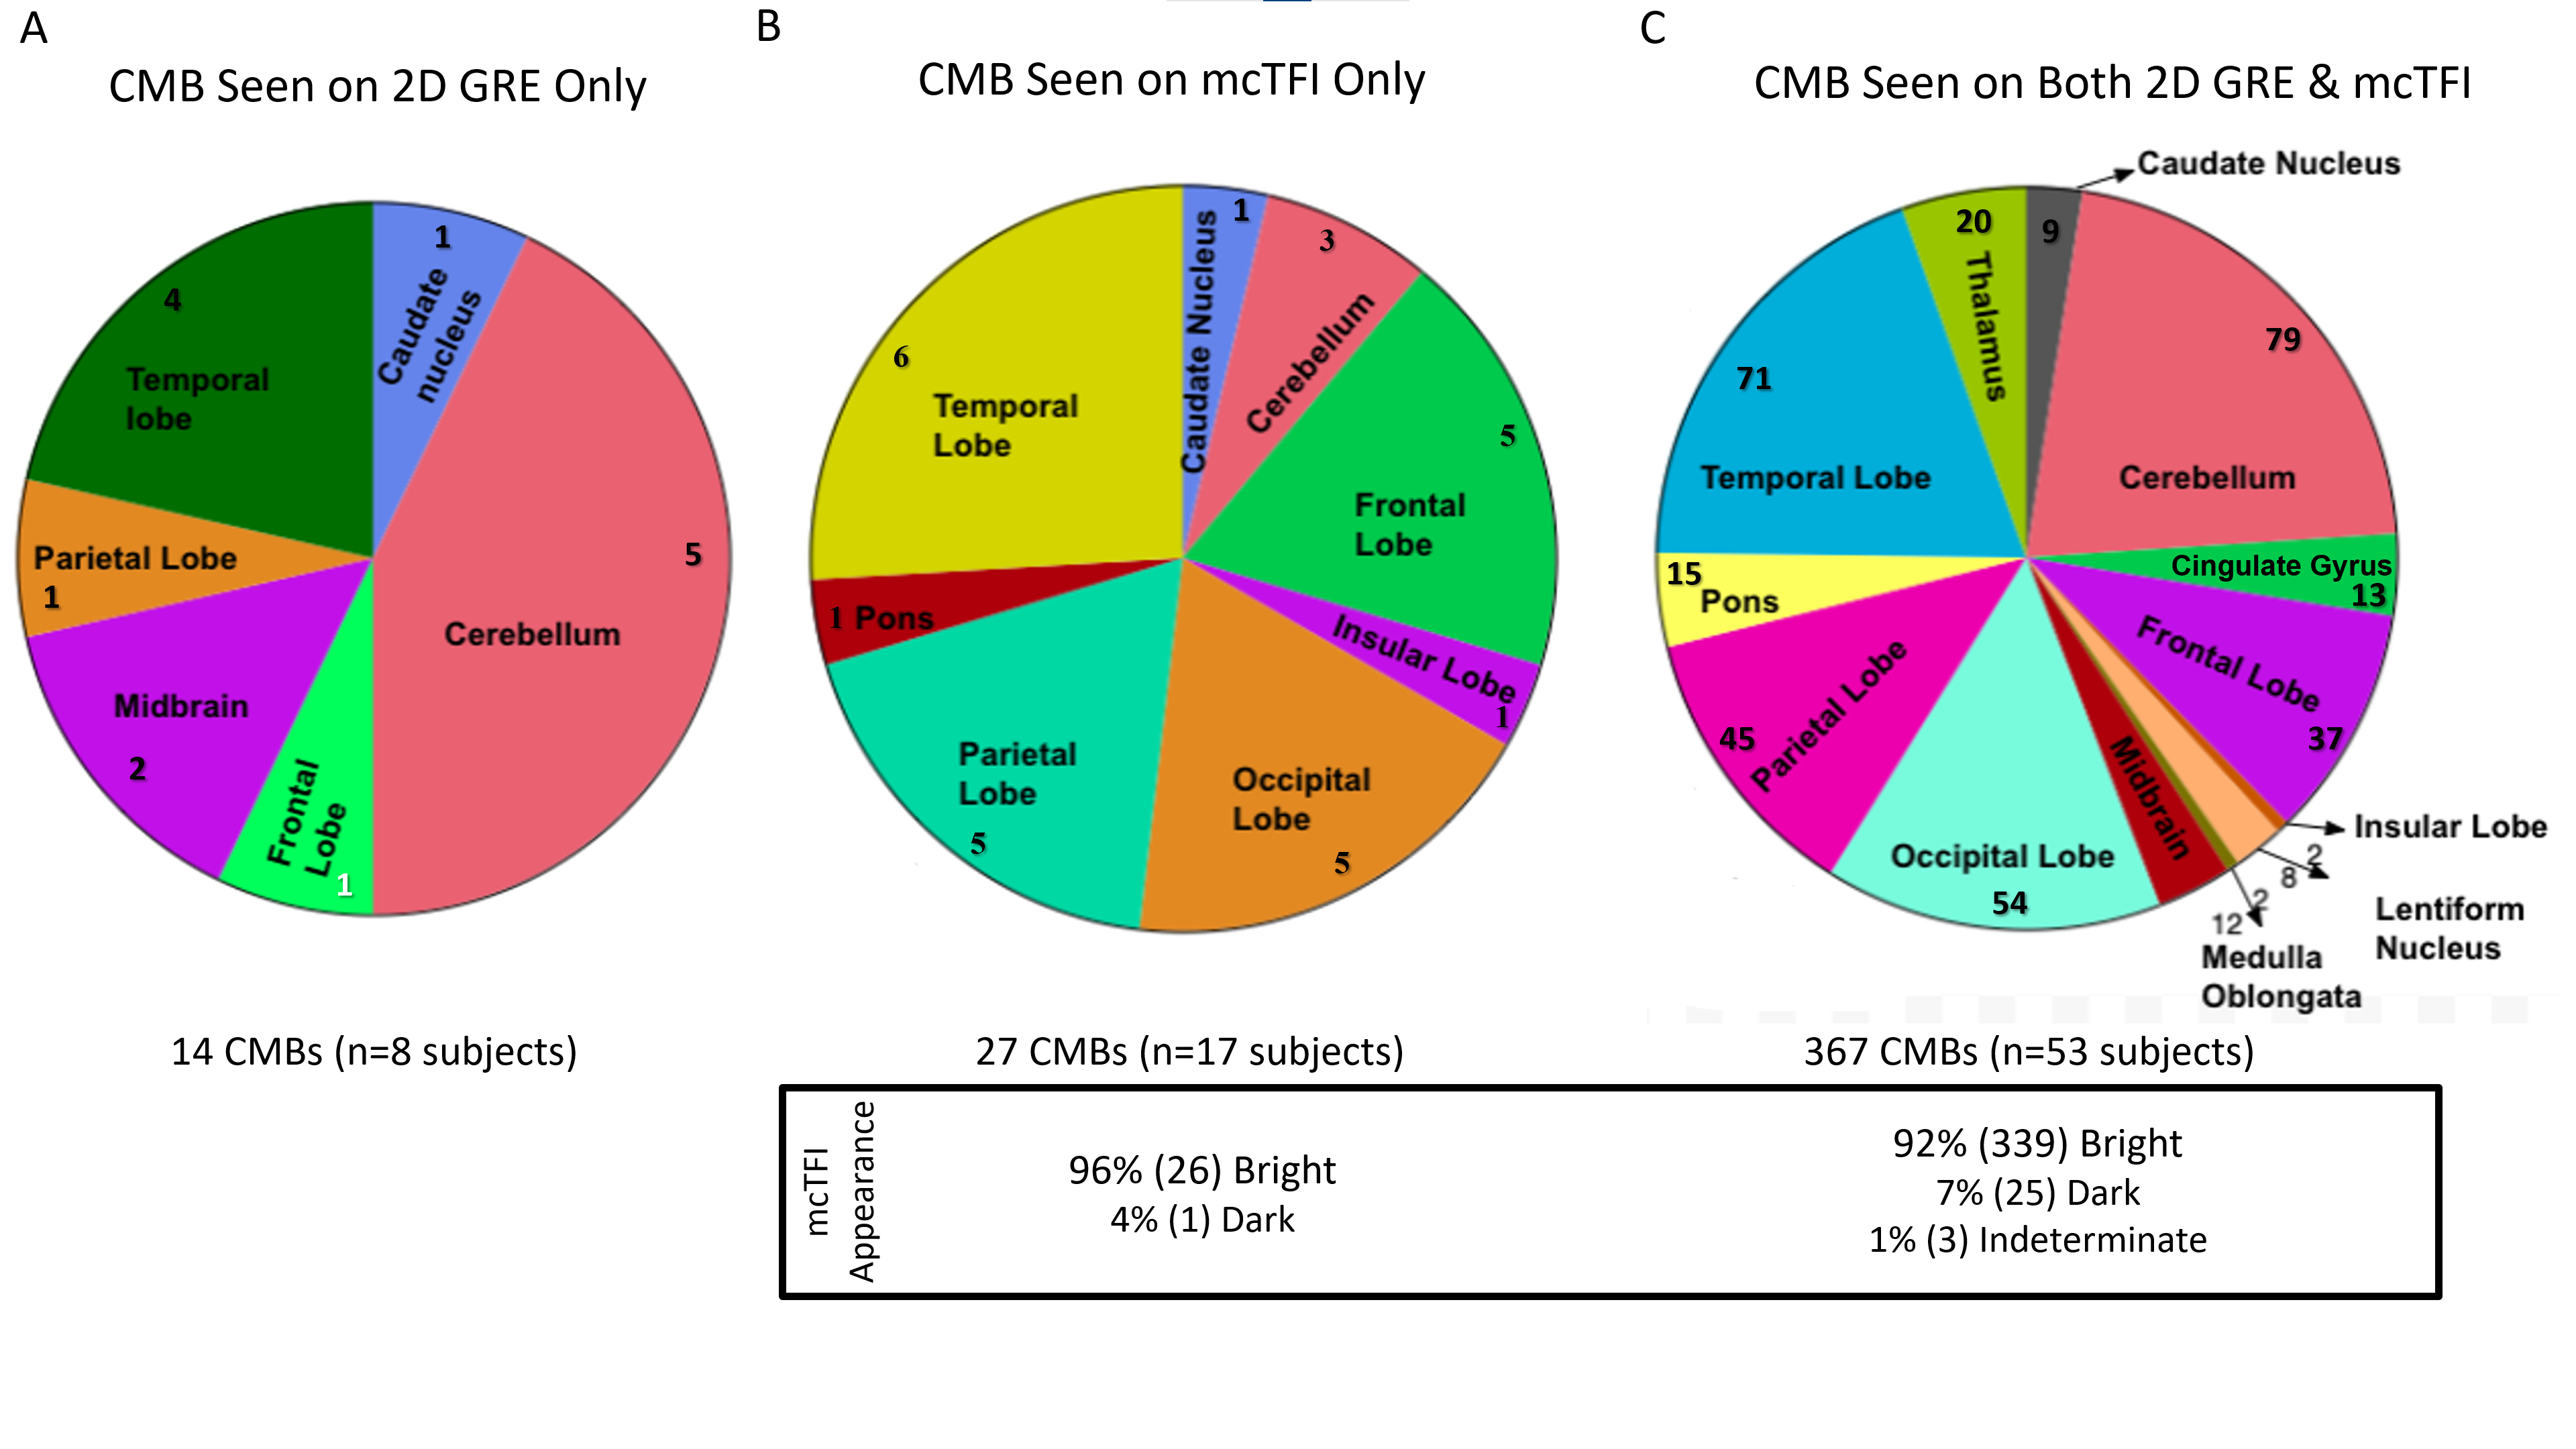
Of 80 subjects recruited, 19 had no CMBs on 2D GRE or mcTFI QSM MRI imaging. 408 total CMBs were identified across the remaining 61 subjects (mean 5.1, SD 8.9. median 2, mode 2). For lesions seen on both techniques, visibility was scored equally for 260/408 (64%), greater on 2D GRE for 33/408 (8%), and greater on mcTFI for 73/408 (18%) (See Figures 1 and 2). See Figures 2 and 3 for anatomic distribution of lesions, lesion visibility, mcTFI lesion intensity on 2D GRE and mcTFI images. T test demonstrates no significant difference in CMB counts between 2D GRE and mcTFI (see figure 2B).DISCUSSION:
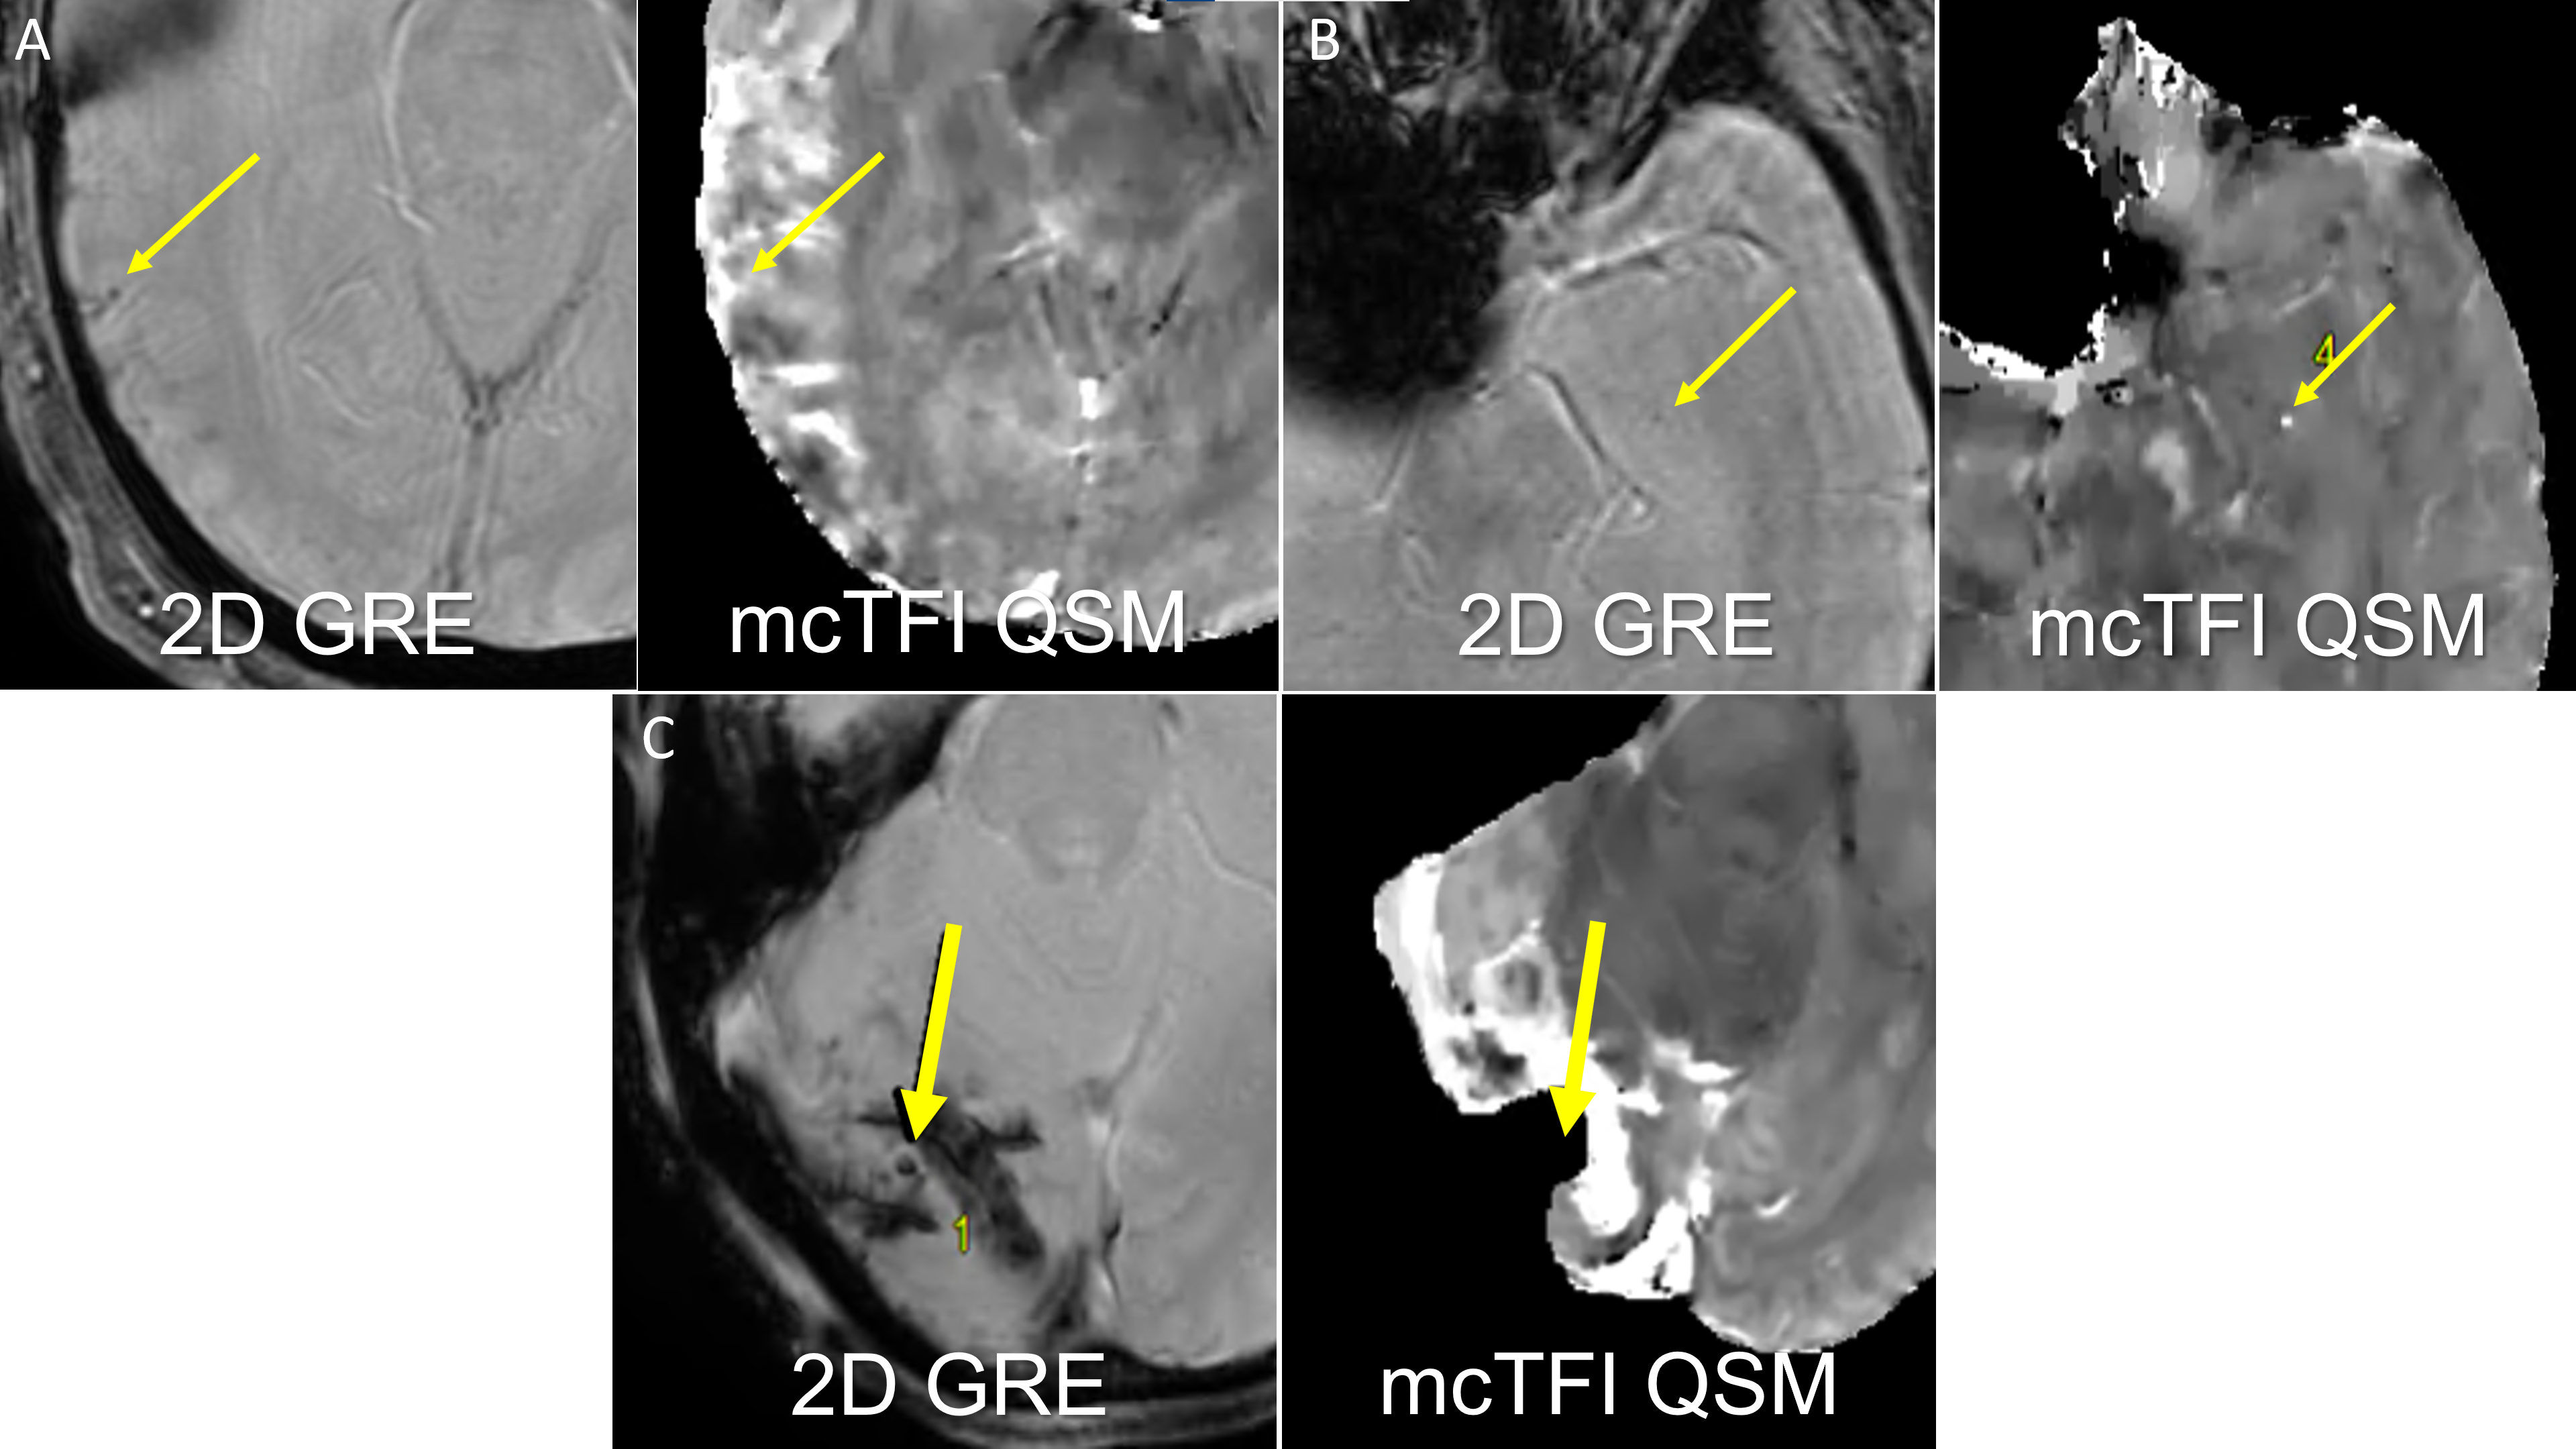
Number of lesions were not significantly different between 2D GRE and mcTFI QSM (p=0.184). This suggests that mcTFI QSM may be substituted in disease management informed by 2D GRE imaging data, as is the case with AD related anti-amyloid therapies and ARIA-H[7]. Inclusion of phase data depicted as intensity difference (bright vs dark) to distinguish a true CMB vs calcification, with less aliasing artifact than SWI Phase maps[8] make QSM techniques appealing. The misclassification of calcifications could result in patients not being offered AD therapy or TPA for stroke. The lesions seen only on mcTFI, may be due to mcTFI QSM being a 3D GRE based technique, which have shown more CMBs than 2D GRE. Bright intensity may have increased the conspicuity relative to the dark intensity CMBs display on 2D GRE. The thinner slice resolution of the mcTFI images relative to 2D GRE and motion degradation on 2D GRE may also have contributed. Figure 4 demonstrates instances where mcTFI non-visualized brain or motion were causes for CMBs seen on 2D GRE only. The lesions scored more visible on 2D GRE may concern QSM depicting small susceptibility lesions as an actual size, in contrast to 2D GRE bloom artifacts which are scan parameter dependent. Increased prominence of normal structures, such as blood vessels, could contribute to decreased CMB conspicuity.CONCLUSION:
While 3D nature of McTFI QSM MRI suggests depiction of more CMBs than 2D GRE images, we found mcTFI highly correlated with 2D GRE for CMB detection, with the added ability to distinguish CMBs from calcifications more and may be compatible with therapy development.Acknowledgements
No acknowledgement found.References
[1] Greenberg SM, Vernooij MW, Cordonnier C, Viswanathan A, Al-Shahi Salman R, Warach S, et al. Cerebral microbleeds: a guide to detection and interpretation. Lancet Neurol 2009;8(2):165-74.
[2] Wardlaw JM, Smith EE, Biessels GJ, Cordonnier C, Fazekas F, Frayne R, et al. Neuroimaging standards for research into small vessel disease and its contribution to ageing and neurodegeneration. Lancet Neurol 2013;12(8):822-38.
[3] Chesebro AG, Amarante E, Lao PJ, Meier IB, Mayeux R, Brickman AM. Automated detection of cerebral microbleeds on T2*-weighted MRI. Sci Rep 2021;11(1):4004.
[4] Petrault M, Casolla B, Ouk T, Cordonnier C, Berezowski V. Cerebral microbleeds: Beyond the macroscope. Int J Stroke 2019;14(5):468-75.
[5] Koennecke HC. Cerebral microbleeds on MRI: prevalence, associations, and potential clinical implications. Neurology 2006;66(2):165-71.
[6] Cummings J, Aisen P, Apostolova LG, Atri A, Salloway S, Weiner M. Aducanumab: Appropriate Use Recommendations. J Prev Alzheimers Dis 2021;8(4):398-410.
[7] Sperling RA, Jack CR, Jr., Black SE, Frosch MP, Greenberg SM, Hyman BT, et al. Amyloid-related imaging abnormalities in amyloid-modifying therapeutic trials: recommendations from the Alzheimer's Association Research Roundtable Workgroup. Alzheimers Dement 2011;7(4):367-85.
[8] Lee K, Ellison B, Selim M, Long NH, Filippidis A, Thomas AJ, et al. Quantitative susceptibility mapping improves cerebral microbleed detection relative to susceptibility-weighted images. J Neuroimaging 2022.
[9] Wen Y, Spincemaille P, Nguyen T, Cho J, Kovanlikaya I, Anderson J, et al. Multiecho complex total field inversion method (mcTFI) for improved signal modeling in quantitative susceptibility mapping. Magn Reson Med 2021. [
10] Champagne AA, Wen Y, Selim M, Filippidis A, Thomas AJ, Spincemaille P, et al. Quantitative Susceptibility Mapping for Staging Acute Cerebral Hemorrhages: Comparing the Conventional and Multiecho Complex Total Field Inversion magnetic resonance imaging MR Methods. J Magn Reson Imaging 2021;54(6):1843-54.
Figures