2813
Longitudinal changes in hippocampal texture from healthy aging to Alzheimer’s disease1Montreal Neurological Institute, McGill University, Montreal, QC, Canada, 2Clinical Memory Research Unit, Lund University, Lund, Sweden, 3Novo Nordisk A/S, Søborg, Denmark, 4McConnell Brain Imaging Centre, McGill University, Montreal, QC, Canada, 5Departments of Psychology and Psychiatry, McGill University, Montreal, QC, Canada, 6Douglas Mental Health University Institute, McGill University, Montreal, QC, Canada
Synopsis
Keywords: Alzheimer's Disease, Preclinical
Microstructural brain changes caused by early Alzheimer’s disease neuropathology may cause subtle changes in MR signal that are quantifiable using texture analysis, a branch of radiomics. We used cross-sectional and longitudinal analysis techniques in the ADNI dataset to examine changes in texture across the disease continuum. We found that biomarker positive but cognitively healthy older adults had measurably different hippocampal texture than those without biomarker risk. Longitudinal modelling revealed progressive textural change with disease severity, but with high inter-subject variability. Nonetheless, hippocampal texture provided additional information to volume in predicting cognitive decline in older adults without a diagnosis of dementia.Introduction
Early detection of Alzheimer’s disease (AD) is essential to develop effective preventive treatment strategies. Detectible change in volume emerges relatively late in the pathogenic progression of disease1 but microstructural changes caused by early neuropathology may cause subtle changes in MR signal that can be quantified using texture analysis.2–6 Texture analysis quantifies spatial patterns in an image such as smoothness, randomness, and heterogeneity.Aim 1) Identify whether texture of a standard structural MRI scan of the hippocampus, an early site of amyloid pathology in AD7, is sensitive to presymptomatic changes in brain microstructure.
Aim 2) There currently exists no description of how texture develops within individuals over the disease course. Therefore, we sought to explore how hippocampal texture changes across the AD continuum, particularly in relation to hippocampal volume and other biomarkers.
Aim 3) Assess to what extent measuring texture features could increase the value of clinical MRI scans by providing additional independent information on brain health to that provided by volumetry alone.
Methods
Data were acquired from the Alzheimer’s Disease Neuroimaging Initiative (ADNI). Texture was calculated8 for bilateral hippocampi on 3T T1-weighted MRI scans. 293 texture features were reduced to five principal components (Tx PC1-5) that described 88% of the total variance of cognitively normal (CN) participants.Analysis 1) Linear mixed-effects models assessed cross-sectional differences in these texture components and hippocampal volume between four diagnostic groups at baseline: Healthy (CN, Aβ-): n=406 (age 72 ± 6.8y); Presymptomatic (CN, Aβ+): n=213 (age 74 ± 6.7y); MCI (Aβ+): n=347 (age 74 ± 7.4y); Dementia (Aβ+): n=202 (age 74 ± 7.8y).
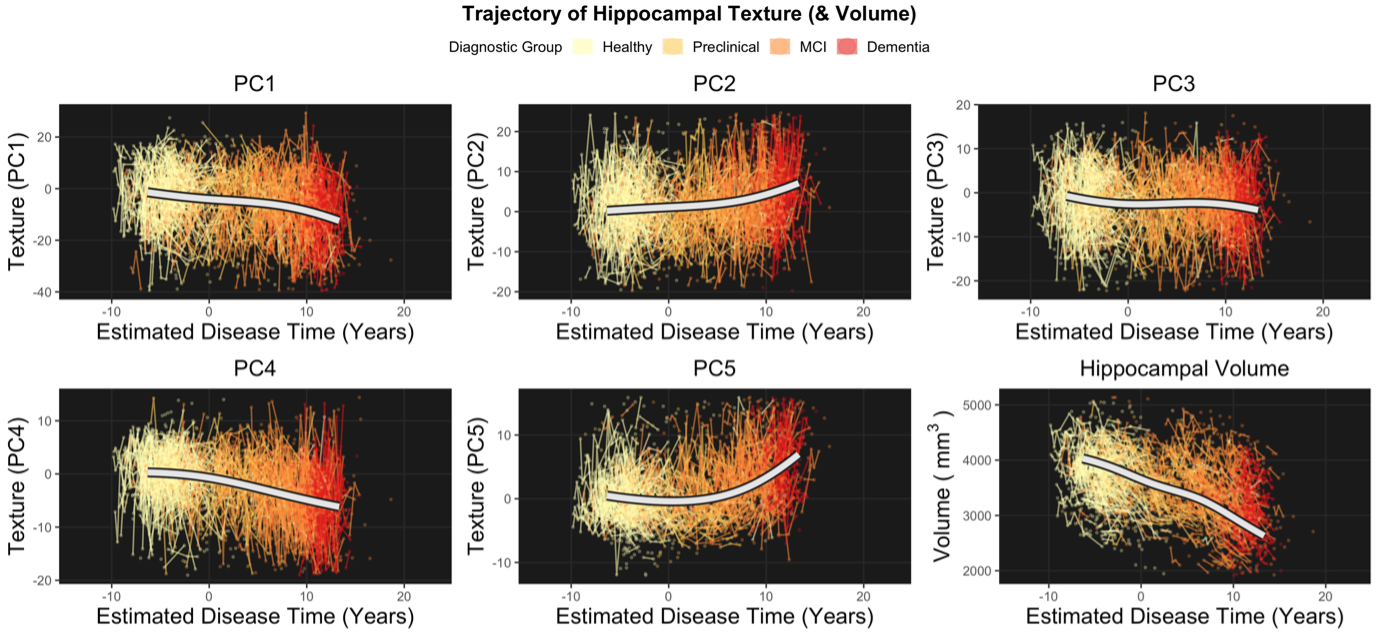
Analysis 2) To assess longitudinal texture change across the AD continuum we used a novel approach to estimate a ‘disease time’ along which participant timepoints could be staged. This method is based on a previously described and validated approach.9 We simultaneously modelled the multivariate trajectory of the amyloid Centiloid score (PET) and three cognitive test scores: Alzheimer’s Disease Assessment Scale (13-item version; ADAS13), Clinical Dementia Rating Scale Sum of Boxes (CDR-SB) and Mini-Mental State Examination (MMSE) to place each subject on a common time scale. Disease progression was modeled with a nonlinear mixed-effects model that jointly described the trajectories of the outcome measures. The estimated disease time was used as a scale on which to compare trajectories of various biomarkers, including volume and texture of the hippocampus. Trajectories were modelled in a subset of the data: Healthy (CN, Aβ-): n=345; Presymptomatic (CN, Aβ+): n=173; MCI (Aβ+): n=301; Dementia (Aβ+): n=161.
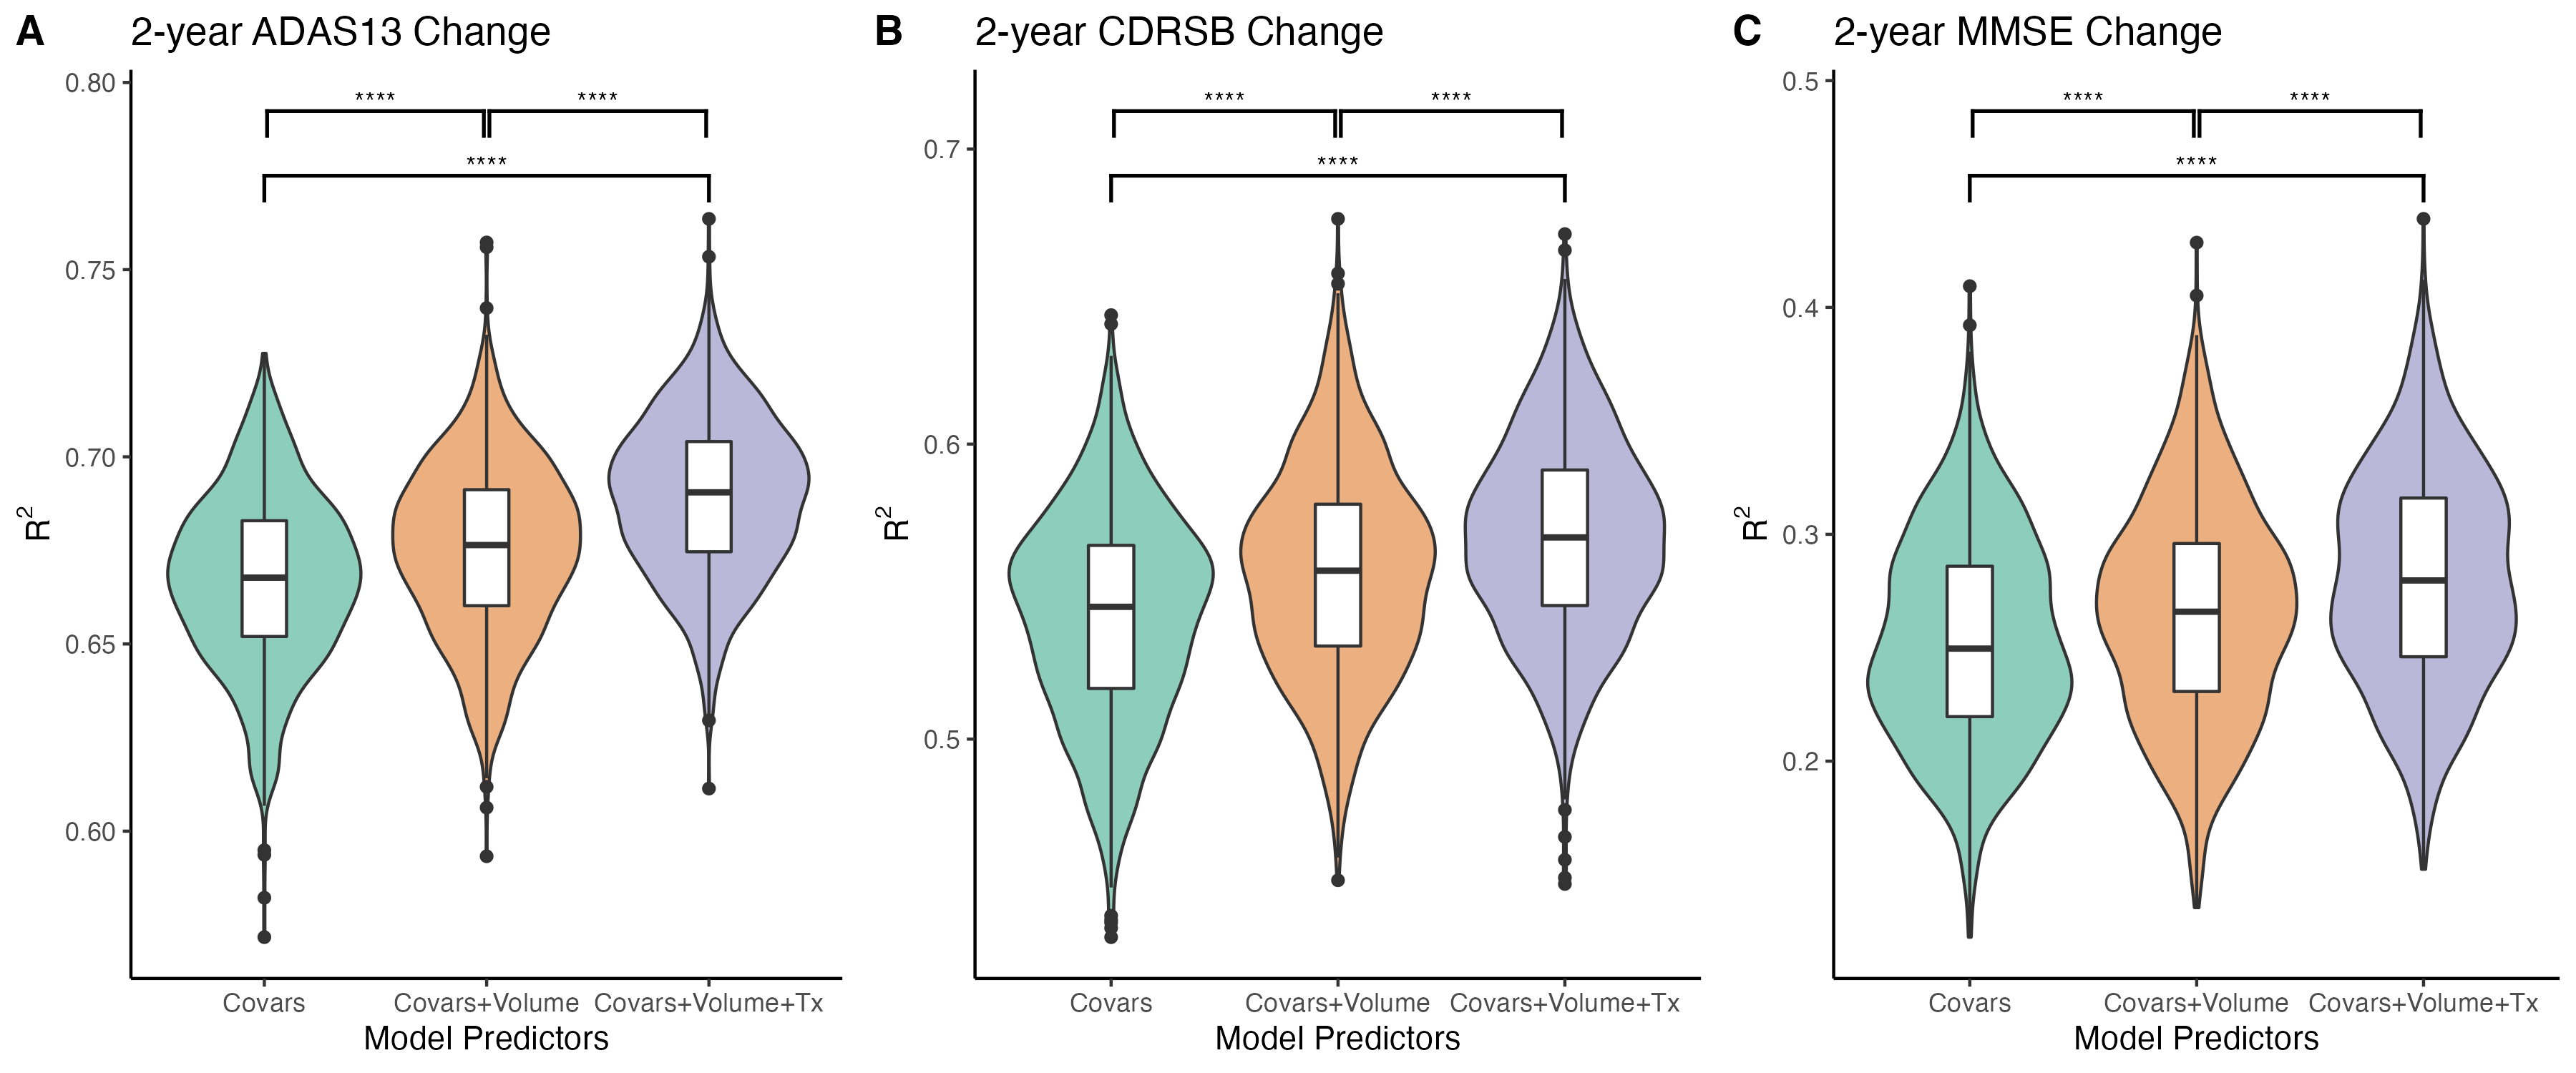
Analysis 3) In order to investigate if hippocampal texture provides additional useful information on top of that provided by volume to predict cognitive decline, we compared the variance explained (R2) by three sets of three linear regression models predicting future cognitive ability (over 2 years) in people without a diagnosis of dementia at baseline.
Results
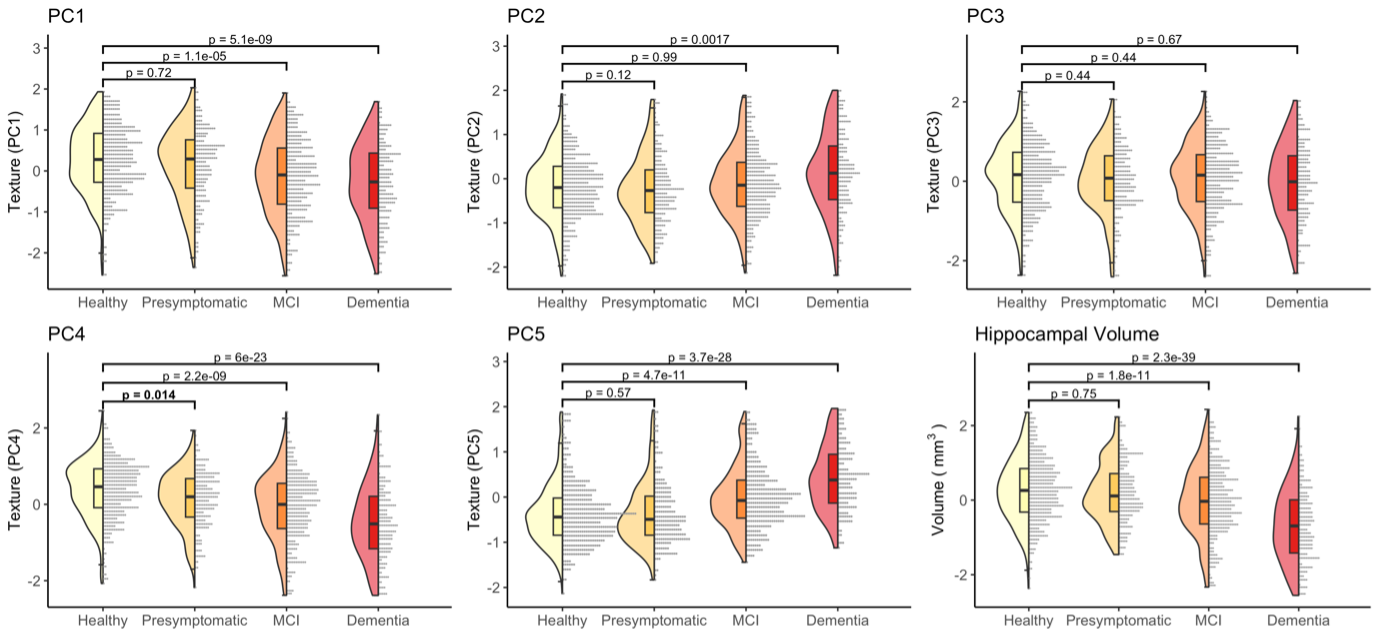
Analysis 1) We identified a novel difference in one component of texture (PC4) at the earliest stage of AD, between healthy (Aβ-) and presymptomatic (Aβ+) older adults (Cohen’s d=0.23, padj=.014). Differences in other components of texture, and hippocampal volume, emerged later in the disease continuum alongside the onset of cognitive impairment (d=0.30-1.22, padj<.002) (Figure 1).Analysis 2) Longitudinal modelling of texture trajectories revealed that while most elements of texture changed significantly over the course of the disease, noise reduced sensitivity for tracking individual textural change over time (Figure 2-3).
Analysis 3) The addition of texture increased R2 in models predicting cognitive change in 3 cognitive tests compared to models with hippocampal volume but not texture (d = 0.32-0.63, padj<.0001) (Figure 4).
Discussion
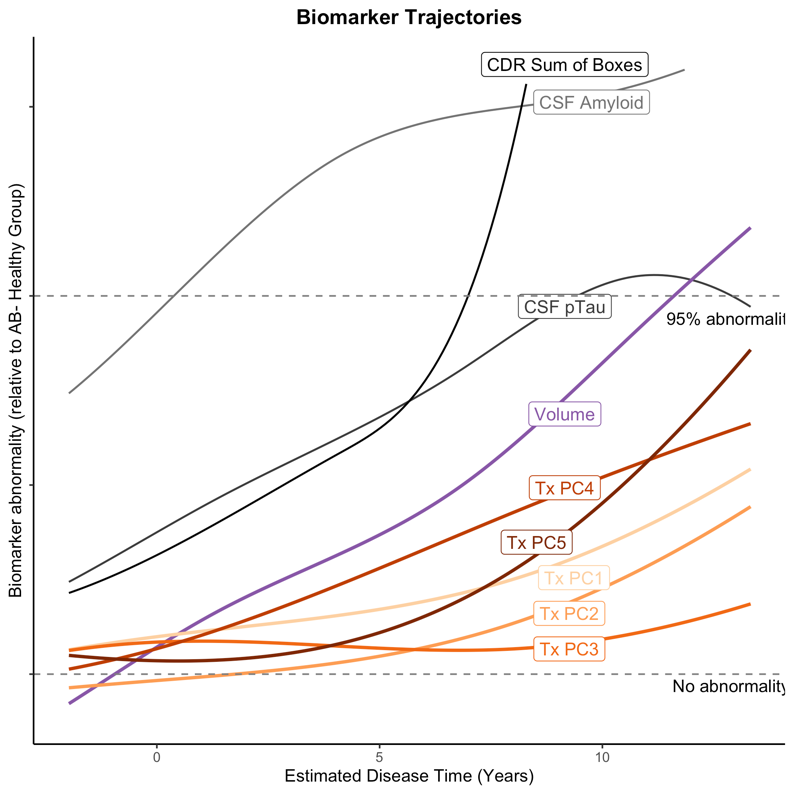
Our cross-sectional analyses (Analysis 1) revealed a temporal ordering in which markers of brain structure become abnormal relative to healthy ageing. Texture PC4 was different at the presymptomatic stage of Alzheimer’s disease. This component therefore appears to be sensitive to the very earliest stages of pathology and may represent the best chance of detecting microstructural damage to extant tissue in AD before the onset of cognitive impairment. We find that hippocampal volume is only reliably different from healthy adults after the onset of mild cognitive impairment.In-line with our cross-sectional analyses, change in texture over the disease course is evident (Analysis 2). However, hippocampal volume appears to change at a faster rate and, ultimately, to a greater degree, than any texture component. Even so, we demonstrate that texture features improve prediction of cognitive change in preclinical populations above and beyond the improvement provided by volume alone (Analysis 3).
Conclusion
Our results support the use of texture as a measure of brain health, sensitive to AD pathology at a time when therapeutic intervention may be most effective. The immediate utility of texture analysis may be in initial screening of clinical trial cohorts for individuals who are at-risk for AD, prior to more expensive and invasive tests that provide higher specificity. Given that MRI scans are often conducted to assess macrostructural atrophy (as measured by volume), or to rule out other causes of disease symptoms, texture analysis can feasibly be added to existing clinical pipelines to provide additional information on microstructural tissue quality.Acknowledgements
We would like to thank Gary R. Turner and the Laboratory of Brain and Cognition at the Montreal Neurological Institute for productive discussions and helpful feedback.
This project was made possible by financial support from the National Institutes of Health (NIA R01 AG068563). R.N.S. is a Research Scholar supported by the Fonds de la Recherche du Quebec – Santé (FRQS). A.W. is a postdoctoral fellow also supported by FRQS.
Data collection and sharing for this project was funded by the Alzheimer's Disease Neuroimaging Initiative (ADNI) (National Institutes of Health Grant U01 AG024904) and DOD ADNI (Department of Defense award number W81XWH-12-2-0012). ADNI is funded by the National Institute on Aging, the National Institute of Biomedical Imaging and Bioengineering, and through generous contributions from the following: AbbVie, Alzheimer’s Association; Alzheimer’s Drug Discovery Foundation; Araclon Biotech; BioClinica, Inc.; Biogen; Bristol-Myers Squibb Company; CereSpir, Inc.; Cogstate; Eisai Inc.; Elan Pharmaceuticals, Inc.; Eli Lilly and Company; EuroImmun; F. Hoffmann-La Roche Ltd and its affiliated company Genentech, Inc.; Fujirebio; GE Healthcare; IXICO Ltd.; Janssen Alzheimer Immunotherapy Research & Development, LLC.; Johnson & Johnson Pharmaceutical Research & Development LLC.; Lumosity; Lundbeck; Merck & Co., Inc.; Meso Scale Diagnostics, LLC.; NeuroRx Research; Neurotrack Technologies; Novartis Pharmaceuticals Corporation; Pfizer Inc.; Piramal Imaging; Servier; Takeda Pharmaceutical Company; and Transition Therapeutics. The Canadian Institutes of Health Research is providing funds to support ADNI clinical sites in Canada. Private sector contributions are facilitated by the Foundation for the National Institutes of Health (www.fnih.org). The grantee organization is the Northern California Institute for Research and Education, and the study is coordinated by the Alzheimer’s Therapeutic Research Institute at the University of Southern California. ADNI data are disseminated by the Laboratory for Neuro Imaging at the University of Southern California.
References
1. Jack CR, Knopman DS, Jagust WJ, et al. Tracking pathophysiological processes in Alzheimer’s disease: an updated hypothetical model of dynamic biomarkers. Lancet Neurol. 2013;12(2):207-216. doi:10.1016/S1474-4422(12)70291-0
2. Cai JH, He Y, Zhong XL, et al. Magnetic Resonance Texture Analysis in Alzheimer’s disease. Acad Radiol. 2020;27(12):1774-1783. doi:10.1016/j.acra.2020.01.006
3. Sørensen L, Igel C, Liv Hansen N, et al. Early detection of Alzheimer’s disease using MRI hippocampal texture. Hum Brain Mapp. 2016;37(3):1148-1161. doi:10.1002/hbm.23091
4. Lee S, Lee H, Kim KW. Magnetic resonance imaging texture predicts progression to dementia due to Alzheimer disease earlier than hippocampal volume. J Psychiatry Neurosci. 2020;45(1):7-14. doi:10.1503/jpn.180171
5. Luk CC, Ishaque A, Khan M, et al. Alzheimer’s disease: 3-Dimensional MRI texture for prediction of conversion from mild cognitive impairment. Alzheimer’s & Dementia: Diagnosis, Assessment & Disease Monitoring. 2018;10:755-763. doi:10.1016/j.dadm.2018.09.002
6. Coupé P, Eskildsen SF, Manjón JV, et al. Scoring by nonlocal image patch estimator for early detection of Alzheimer’s disease. NeuroImage: Clinical. 2012;1(1):141-152. doi:10.1016/j.nicl.2012.10.002
7. Braak H, Braak E. Neuropathological stageing of Alzheimer-related changes. Acta Neuropathologica. 1991;82(4):239-259. doi:10.1007/BF00308809
8. Kolossváry M, Karády J, Szilveszter B, et al. Radiomic Features Are Superior to Conventional Quantitative Computed Tomographic Metrics to Identify Coronary Plaques With Napkin-Ring Sign. Circ Cardiovasc Imaging. 2017;10(12). doi:10.1161/CIRCIMAGING.117.006843
9. Kühnel L, Berger AK, Markussen B, Raket LL. Simultaneous modeling of Alzheimer’s disease progression via multiple cognitive scales. Statistics in Medicine. 2021;40(14):3251-3266. doi:10.1002/sim.8932
Figures