2810
Brain Age Prediction using optimized MRI Brain Features: A novel strategy to understand Aging and Aging Associated Pathologies
Arkaprava Majumdar1, Neha Yadav1, and Vivek Tiwari1
1Department of Biological Sciences, Indian Institute of Science Education and Research Berhampur, Berhampur, India
1Department of Biological Sciences, Indian Institute of Science Education and Research Berhampur, Berhampur, India
Synopsis
Keywords: Dementia, Modelling, Brain Age
A certain subset of the aging population maintains the cognitive abilities with minimal structural changes with aging while another subset of people transforms to mild cognitive impairment and dementia with manifold structural variations. Since a subset maintains the cognitive abilities, brain structural volume with aging while another subset undergoes cognitive-impairment and drastic brain structure alterations, we believe that the brain age pattern is distinct from chronological age. Here, we have used a set of MRI determined brain volumetry to determine the brain age as a measure of normal and pathological aging.INTRODUCTION
The decline in cognitive abilities with aging may be a manifestation of brain structure atrophy and hypertrophy with aging. While a certain set of aging individuals have an early onset of cognitive disabilities, others manifest cognitive impairments at a very late age. MRI-determined brain structure health serves as a potential imaging biomarker for studying normal and pathological aging as the changes in brain volumetry may happen decades before the manifestation of clinical symptoms of mild cognitive impairment and dementia. It remains poorly understood what are the brain biomarker changes that indicate a transformation of an aging individual into mild cognitive impairment and dementia while a similar-aged individual continues to preserve brain structure and cognitive abilities. Therefore, we hypothesize that understanding the Brain age (BAG) based on the brain region volume may be a potential indicator of the trajectory of normal and pathological aging compared to Chronological age (CAG). Here, we have developed a platform for predicting brain age by employing optimal numbers of MRI-segmented brain structures and covariates.METHODS
Brain volumes and small vessel disease pathology (White matter hyperintensity) obtained using T1w and T2-FLAIR MRI from cognitive normal (CN) subjects (Nmri = 2038) in the Alzheimer’s Disease Neuroimaging Initiative (ADNI) were used to develop a predictive model for brain age determination. T1w images were segmented to obtain the volume of Gray Matter, White matter, Cerebrum Gray Matter, Cerebrum White matter, Cerebrospinal fluid, Left hippocampus, Right Hippocampus, and Gray-White matter ratio (GM/WM). The volumes were normalized to Intracranial volumes. Total white matter hyperintensity (WMH) volume was determined using the T2-FLAIR image. The entire dataset was normalized and the outliers (> 3 or < -3) were removed. For subjects with multiple scans, a single scan was selected randomly. Various combinations of the MRI-determined brain structure volumes were used to develop a brain age model that employed a “boosting” architecture with generalized additive model-based prediction1(Fig. 1). The difference between estimated brain age (BAG) and chronological age revealed the individual brain age gap estimation(BrainAGE) score2, which indicates brain health and cognitive abilities. For BrainAGE, the positive values indicated advanced structural brain maturation/aging, whereas negative values indicated delayed structural brain maturation/aging. In longitudinal studies, increasing BrainAGE scores were indicative of accelerated brain aging over time. Thus, the individual BrainAGE score directly quantifies the amount of acceleration or deceleration of brain maturation/aging in terms of years. For example, if a 64-year- old individual shows a BrainAGE score of +6 years, the typical brain volumetry of this individual resembles the brain volumetry of a 71- year- old cognitively normal individual (Fig. 2).RESULTS and DISCUSSION
Neuroanatomic volumes of cerebrum gray matter, cerebrum white matter, cerebrospinal fluid, left and right hippocampus and microvascular pathology such as WMH were used to investigate the pattern of regional brain structure changes with aging across cognitively normal subjects. A significant progressive decline was observed for gray matter, white matter, and hippocampus with age accompanied by a progressive increase in the volume of CSF and WMH (Fig. 3). Upon investigation of the association between estimated brain age and chronological age using the segmented brain volumes, CSF volume exhibited a significantly positive association (+0.65 ) with chronological age in normal subjects followed by cerebrum gray matter (-0.449) and cerebrum white matter (-0.46 ). Upon a ten-fold cross-validation score for various combinations of neuroanatomical volume to understand the brain age, a combination of cerebrum gray matter, cerebrum white matter, total gray matter, total white matter, total hippocampus volume, CSF, and WMH volume showed the highest cross-validation accuracy for brain age determination (Fig.4). The bias in brainAGE was corrected by using a simple linear regression with brainAGE as the independent variable and the chronological age as the dependent variable (Fig. 5B) in which the effect of the chronological age was removed to obtain the corrected brainAGE3. Application of the BrainAge prediction model using the optimized neuroanatomical features developed from the cognitively-normal cohort in a random sample of Mild Cognitively Impaired (N=50) subjects successfully predicted increased brain age in the MCI group compared to the chronological age with significantly higher accuracy (Fig. 5C).CONCLUSION
We have established a highly precise brain age estimation model using ten MRI-determined neuroanatomical features wrapped in generalized additive models using splines and boosting. We also elucidate the need for correction of biases for accurate determination of the brainAGE delta. The model successfully showed that subjects have a dissociation between brain age and chronological age, where brain age is higher than their chronological age.Acknowledgements
MRI and Cognitive data were obtained from the Alzheimer's Disease Neuroimaging Initiative (ADNI) database (adni.loni.usc.edu). Data collection and sharing for this project was funded by the Alzheimer's Disease Neuroimaging Initiative (ADNI) (National Institutes of Health Grant U01 AG024904) and DOD ADNI (Department of Defense award number W81XWH-12-2-0012). ADNI is funded by the National Institute on Aging, the National Institute of Biomedical Imaging and BioengineeringReferences
- Wood S (2017). Generalized Additive Models: An Introduction with R, 2 edition. Chapman and Hall/CRC.
- .Anatürk M, Kaufmann T, Cole JH, Suri S, Griffanti L, Zsoldos E, Filippini N, Singh-Manoux A, Kivimäki M, Westlye LT, Ebmeier KP, de Lange AG. Prediction of brain age and cognitive age: Quantifying brain and cognitive maintenance in aging. Hum Brain Mapp. 2021 Apr 15;42(6):1626-1640. doi: 10.1002/hbm.25316. Epub 2020 Dec 14. PMID: 33314530; PMCID: PMC7978127.
- Smith SM, Vidaurre D, Alfaro-Almagro F, Nichols TE, Miller KL. Estimation of brain age delta from brain imaging. Neuroimage. 2019 Oct 15;200:528-539. doi: 10.1016/j.neuroimage.2019.06.017. Epub 2019 Jun 12. PMID: 31201988; PMCID: PMC6711452.
Figures
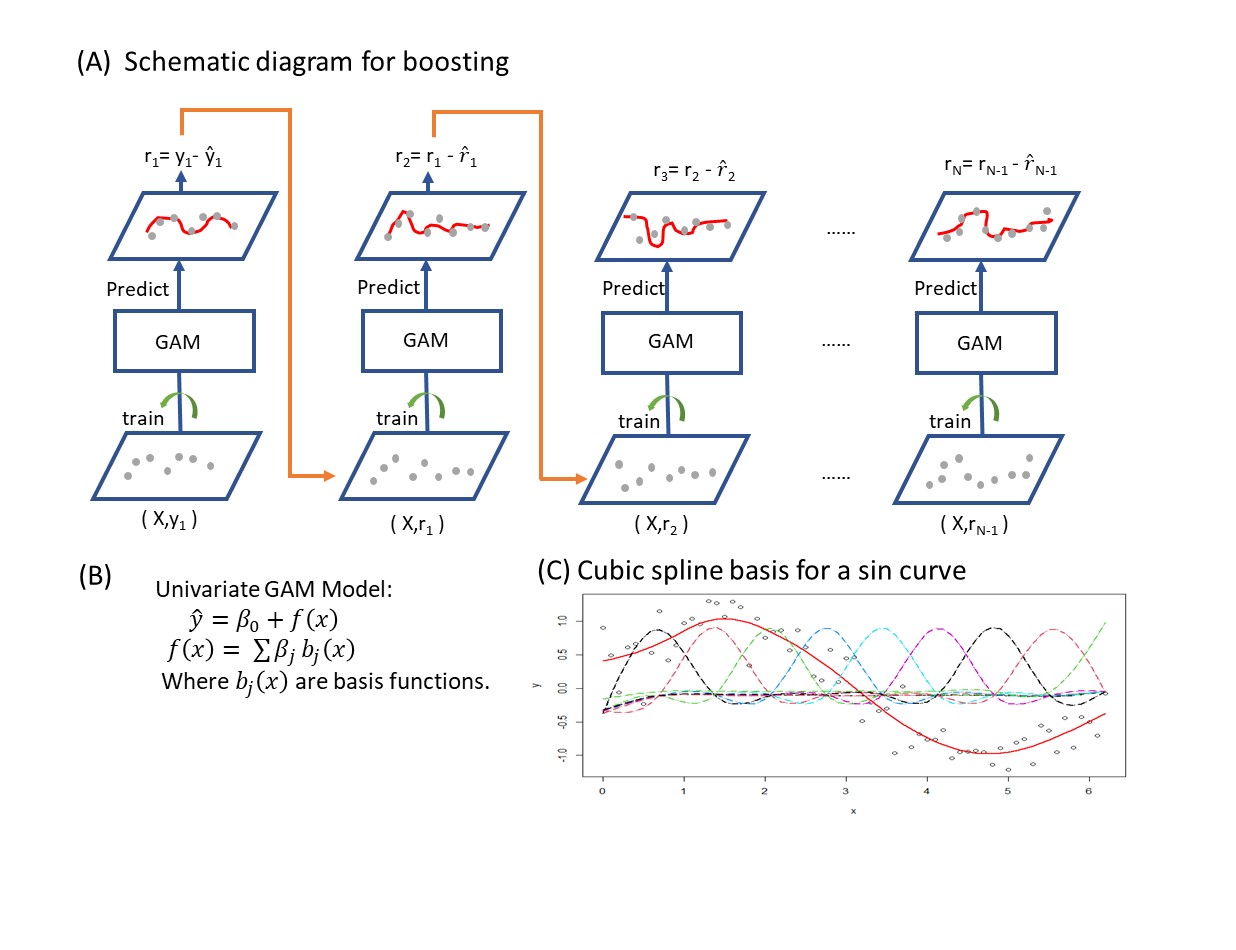
Fig.1-(A) The schematic diagram of the boosting algorithm where GAM models are fitted sequentially. (B) presents the equation of a basic univariate GAM model. (C) shows an example of how GAM can be used to estimate a non-linear function (sin curve in the image) by adding up basis functions.
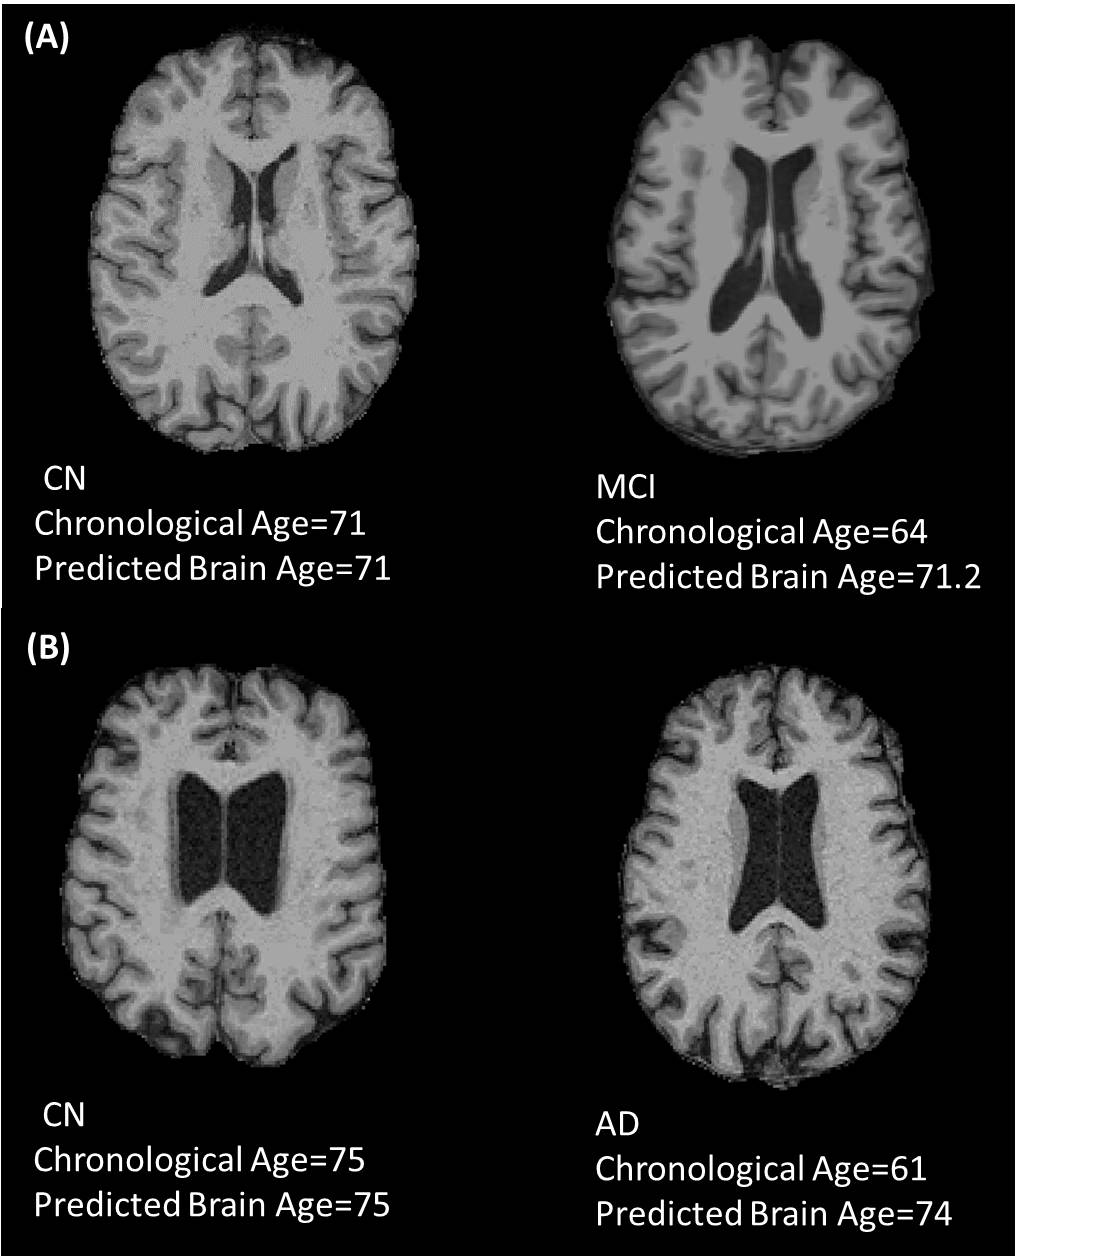
Fig.2-T1 weighted MRI of MCI and AD subjects with their normal counterparts having the same predicted brain age equal to their chronological age. (A)The brain of a 64-year-old MCI subject is similar to a 71 years old cognitively normal subject. (B)The brain of a 61-year-old AD subject resembles that of a 75 years old cognitively normal subject. The brainAGE of the MCI subject is 7 years whereas the AD subject has a brainAGE of 13 years.
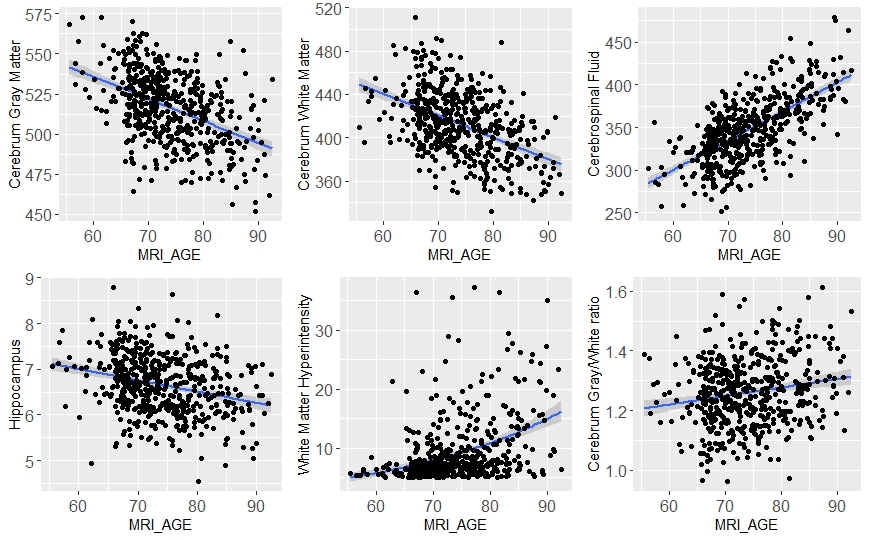
Fig.3- The behaviour of the MRI biomarkers with chronological age in cognitively normal subjects.
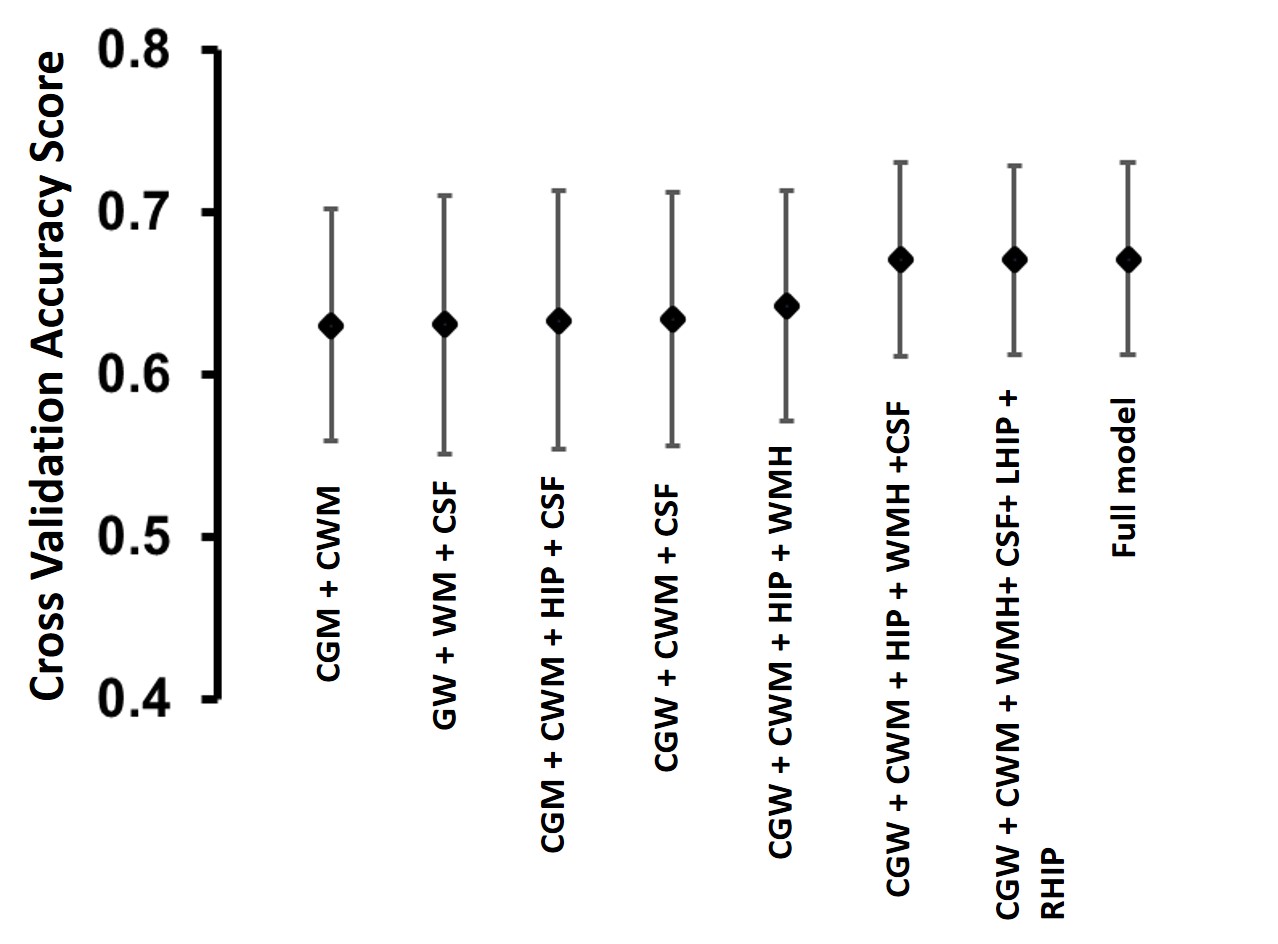
Fig.4- The 10-fold cross-validation accuracy score of different combinations of MRI markers for predicting brainAGE. The full model with all the variables achieves the best result as expected but a decent score can be achieved by using only two or three MRI markers. CGM – Cerebrum Gray Matter, CWM – Cerebrum White Matter, HIP – Hippocampus Volume, CSF – Cerebrospinal Fluid, WMH – White matter hyperintensity, LHIP – Left Hippocampus, RHIP – Right Hippocampus.
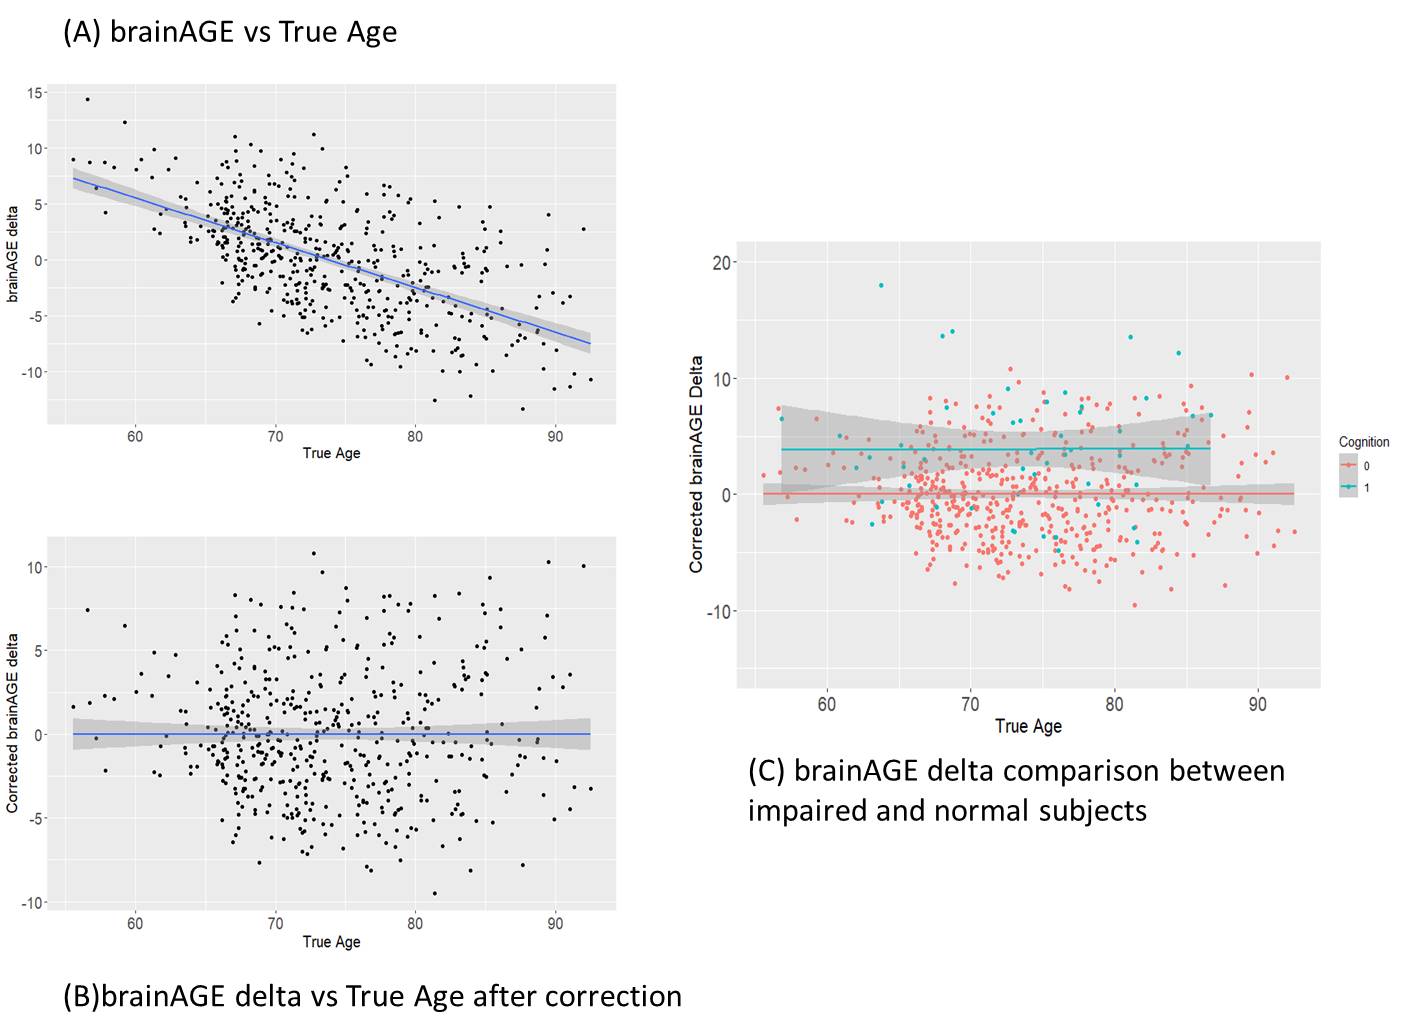
Fig.5- (A) Depicts the dependence of brainAGE on true age. The fitted line has a nonzero slope implying dependence of brainAGE on true age. (B) shows the brainAGE corrected for true age having a zero slope. (C) compares the brainAGE delta between impaired(blue) and normal(red) subjects. The intercept of impaired subjects is higher than the intercept of normal subjects implying that brainAGE delta for impaired subjects is greater than zero.
DOI: https://doi.org/10.58530/2023/2810