2807
Functional-structural decoupling in visual network is associated with cognitive decline in patients with type 2 diabetes mellitus.
Minhua Ni1, Zeyang Li1, Ying Yu1, Sining Li1, Linfeng Yan1, and Guangbin Cui1
1Tangdu Hospital, Xi`an, China
1Tangdu Hospital, Xi`an, China
Synopsis
Keywords: Dementia, fMRI (resting state)
In this study, functional and structural changes in visual network (VN) of type 2 diabetes mellitus (T2DM) were investigated using multimodal magnetic resonance imaging. We explored degree centrality (DC), amplitude of low frequency fluctuation (ALFF), fractional anisotropy (FA), DC-FA and ALFF-FA in VN. Compared with healthy controls, deteriorated DC, ALFF and DC-FA coefficients in VN were observed in T2DM. These indicators showed positive correlations with cognitive function in T2DM, especially memory and executive function. Functional-structural decoupling may be a potential image biomarker of cognitive function change in T2DM.Introduction:
Functional-structural coupling (F-S C) and visual network (VN) associated alterations are suggested to be potential mechanisms in cognitive impairment. However, the relationship of F-S C evidence derived from functional magnetic resonance imaging with type 2 diabetes mellitus (T2DM). This study was conducted in order to investigate the functional-structural coupling alterations in VN in T2DM and its potential clinical relevance.Methods:
Our Institutional Review Board approved the protocol and written informed consent was obtained from each subject. This study included 30 confirmed T2DM patients and 29 matched healthy controls. All participants underwent brain magnetic resonance examination on a 3.0T scanner (Discovery MR750, GE Healthcare) with 8-channel head coil, and cognitive function assessments. Volumetric T1-weighted (three-dimensional brain volume imaging, 3D-BRAVO) (echo time (TE)/ repetition time (TR) = 3.2/8.2 ms, inversion time (TI) = 450 ms, flip angle (FA)= 12º, acquisition matrix = 256 × 256, slice thickness = 1 mm, slice number = 188) images were collected for anatomic structure. Blood oxygen level-dependent (BOLD) contrast with the following settings: (TE)/repetition time (TR) = 30/2000 ms, flip angle (FA) = 90°, acquisition matrix = 64 × 64, field of view = 220 mm × 220 mm, thickness = 3 mm, scanning gap = 1 mm, slices number = 36 and scan time = 6 min. Resting-state fMRI(rs-fMRI) included gradient-echo planar sequence sensitive to BOLD contrast (TR = 2,000 ms, TE = 30 ms, FA = 90°) and rs-fMRI was preprocessed in Data Processing Assistant for Resting-State fMRI (DPABI,Results:
The study included 30 T2DM patients (22 males and 8 females; mean age of 52.60 ± 8.51 years) and 29 HCs (18 males and 11 females; mean age of 49.69 ± 5.19 years). These participants had no significant difference in age or gender (P > 0.05). All individuals received an assessment of cognitive function. Two groups had no significant difference in Montreal Cognitive Assessment (MoCA) score (T2DM, 27.04 ± 2.21; HCs, 26.29± 2.66). Three Visual components (VCs) were selected using group ICA. T2DM group showed significantly lower DC and ALFF values in the VC1 (PDC = 0.003, PALFF = 0.038) compare with HC group. No significant changes were found in VC2 and VC3. For functional-structural coupling coefficients, T2DM group exhibited lower DC-FA coefficients (rDM = 0.34 ± 0.27, rHC = 0.49 ± 0.17, PFDR = 0.014) in VC1, while DC-ALFF coefficient had no significant difference between two groups. The DC in VC1 was positively correlated with Trial 4 and Total trial 1-5 in CVLT. The positive correlation between DC-FA coefficients in VC1 and Total perseverative responses % of WCST was also observed.Discussion:
In this study, compared with HC group, DC, ALFF and DC-FA coefficients in VC1 were significantly lower in T2DM group, while FA had no significant change. The DC in VC1 was positively correlated with Trial 4 and Total trial 1-5 in CVLT. The positive correlation between DC-FA coefficients in VC1 and Total perseverative responses % of WCST was also observed. The results showed that the abnormal neuronal function mainly concentrated in VC1, while there was no significant change in VC2 and VC3. Anatomically, VC1 is located in BA 17, known as the primary visual cortex, and mainly includes the inferior talus gyrus in the occipital cortex. The dysfunction of the primary visual cortex (VC1), the first and simplest visual cortex area, may be a potential image biomarker of cognitive function change and provide a new insight into the mechanism of T2DM in the early stage of cognitive change (pre MCI stage). No significant structural changes were found in T2DM patients in the pre-MCI stage, but neuronal abnormalities and functional-structural decoupling had occurred in this stage, which may suggest that cerebral structure and function are closely related. This study explored this relationship and found that the higher the DC-FA coefficients were, the higher the executive function related scores were. Taken together, these findings indicate that DC and DC-FA coefficients in VN may be potential imaging biomarkers for revealing early cognitive deficits of different dimensions in T2DM.Acknowledgements
No interest conflicts.References
[1] Li J, Zhang Q, Zhang N, et al. Increased Brain Iron Deposition in the Putamen in Patients with Type 2 Diabetes Mellitus Detected by Quantitative Susceptibility Mapping. [J]. J Diabetes Res.2020;2020:7242530. DOI:10.1155/2020/7242530
[2] Yan CG, Wang XD, Zuo XN, et al. DPABI: Data Processing & Analysis for (Resting-State) Brain Imaging. [J]. Neuroinformatics.2016;14(3):339-351. DOI:10.1007/s12021-016-9299-4
Figures
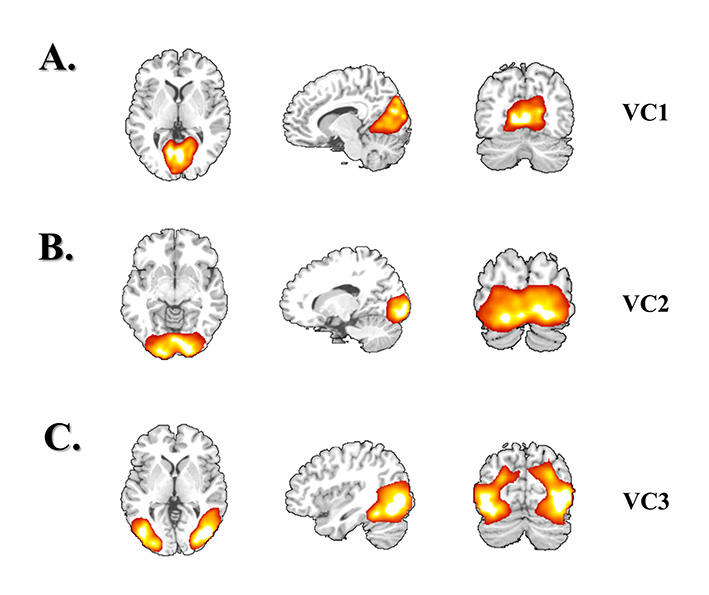
Figure 1.
Topography of visual networks estimated
from the resting-state fMRI data using ICA. (A) VC1. (B)VC2. (C)VC3 ICA: independent component analysis; fMRI:
functional magnetic resonance image; VC: visual component.
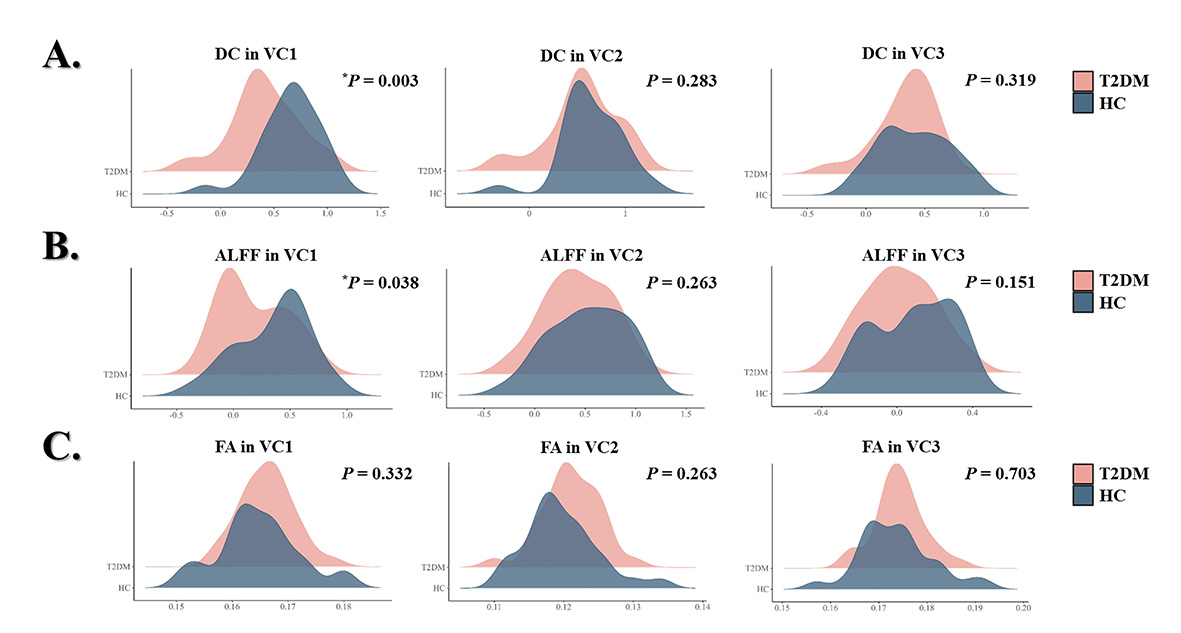
Figure 2.
Between-group comparison of functional
(DC and ALFF) and structural (FA) biomarkers. (A) The DC in three VCs
differences between T2DM and HC groups. * P < 0.05. (B) The ALFF in
three VCs differences between T2DM and HC groups. * P < 0.05. (C) The
FA in three VCs differences between T2DM and HC groups. DC: degree centrality; ALFF, amplitude of
low-frequency fluctuation; FA, fractional anisotropy; VC: visual component; T2DM:
type 2 diabetes mellitus; HC:
healthy controls.
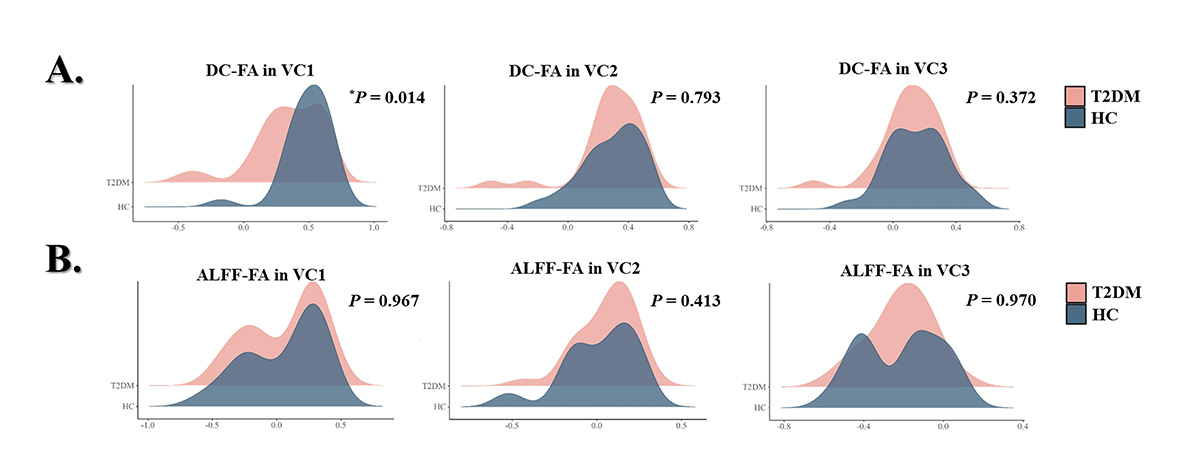
Figure 5.
Between-group comparison of functional-structural
coupling coefficients. (A) The DC-FA coefficients
in three VCs differences between T2DM and HC groups. * P < 0.05. (B) The
ALFF-FA coefficients
in three VCs differences between T2DM and HC groups. DC: degree centrality; ALFF, amplitude of
low-frequency fluctuation; FA, fractional anisotropy; VC: visual component; T2DM:
type 2 diabetes mellitus; HC:
healthy controls.
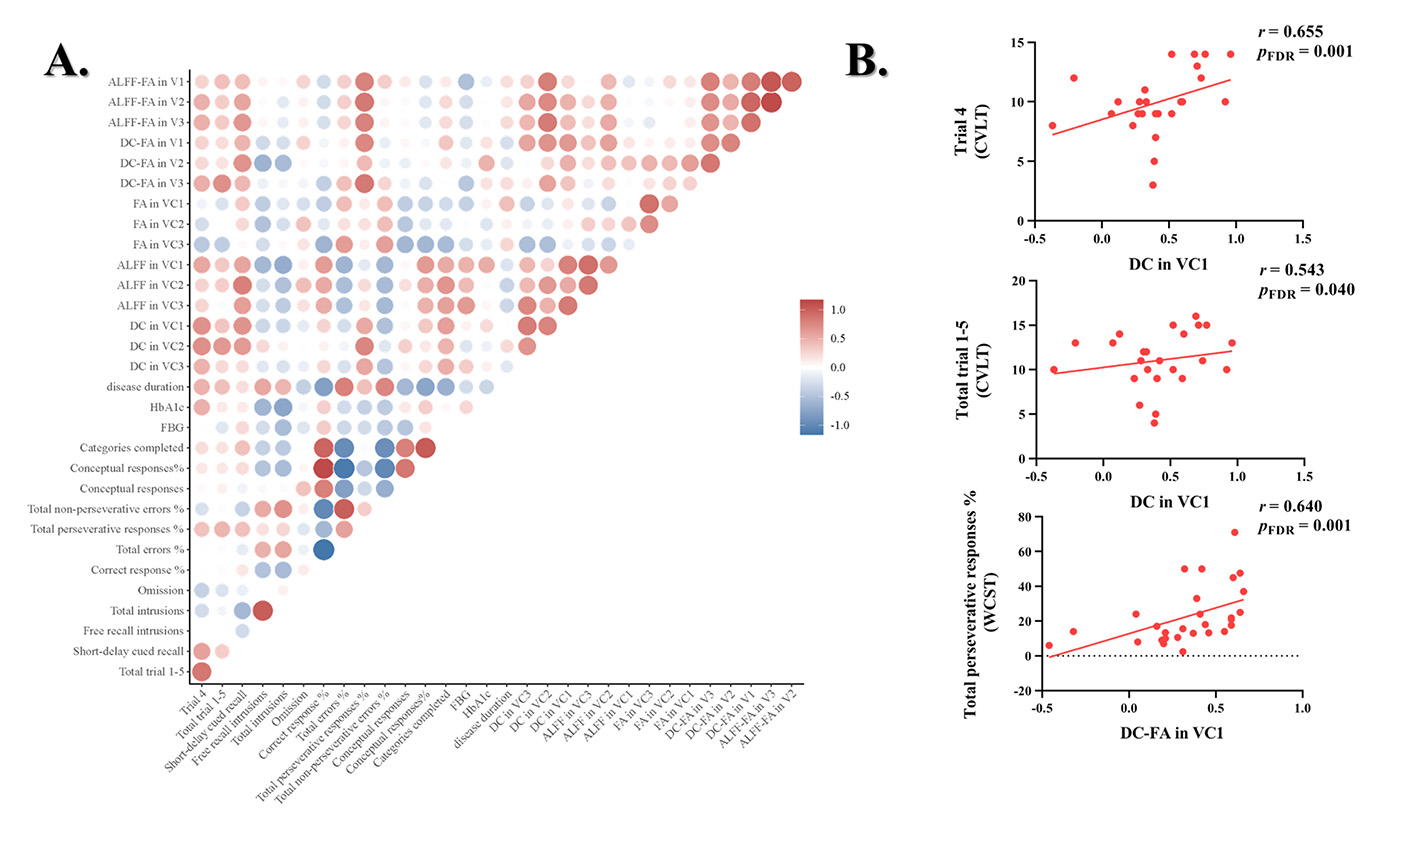
Figure 6. Correlation analysis among image
indicators, clinical indicators and cognitive performance in T2DM groups. (A)
The overall correlation analysis matrix among image indicators, clinical
indicators and cognitive performance. (B) The
correlations remained significant after FDR
correction, DC: degree centrality;
ALFF, amplitude of low-frequency fluctuation; FA, fractional anisotropy; VC: visual
component; CVLT, California Verbal Learning Test; WCST,
Wisconsin Card Sorting Test; FDR: false
discovery rate; T2DM: type 2 diabetes
mellitus.
DOI: https://doi.org/10.58530/2023/2807