2804
Reduced dynamism of brain activity underlying spatial deficits in subjective cognitive decline1Department of Radiology, Drum Tower Hospital, Clinical College of Nanjing Medical University, Nanjing, China, 2Department of Radiology, The Affiliated Drum Tower Hospital of Nanjing University Medical School, Nanjing, China
Synopsis
Keywords: Alzheimer's Disease, fMRI (resting state), subjective cognitive decline
The alterations of brain dynamics and the associations with spatial navigation in individuals with subjective cognitive decline (SCD) remain unknown. In this study, 12 states with distinct brain activity were identified in a cohort of 80 SCD and 77 normal control (NC) participants using the hidden Markov model (HMM). The SCD group showed an inability to dynamically upregulate and downregulate the state with general network activation. Significant correlations between brain dynamics and spatial navigation were observed. The combined features of spatial navigation and brain dynamics showed an area under the curve of 0.854 in distinguishing between SCD and NC.Introduction
Alzheimer’s disease (AD) continues to be a global concern. Individuals with subjective cognitive decline (SCD) have been considered at a higher risk of preclinical AD than the normal elderly individuals without cognitive complaints1. Spatial navigation impairment is commonly observed in AD patients; however, its integrity in SCD subjects and the underlying neural mechanisms remain poorly understood2. Previous studies based on resting-state functional magnetic resonance imaging (rs-fMRI) have suggested that the dynamic analysis might better reflect the dynamic nature of the brain and provide a novel perspective for exploring neural substrates underlying neuropsychological disorders and behavioural impairments3, 4. In the present study, we aimed to investigate the large-scale neural dynamics of brain intrinsic activity using a hidden Markov model (HMM) in a cohort of SCD and normal controls (NCs) and to assess the associations with spatial navigation performance.Methods
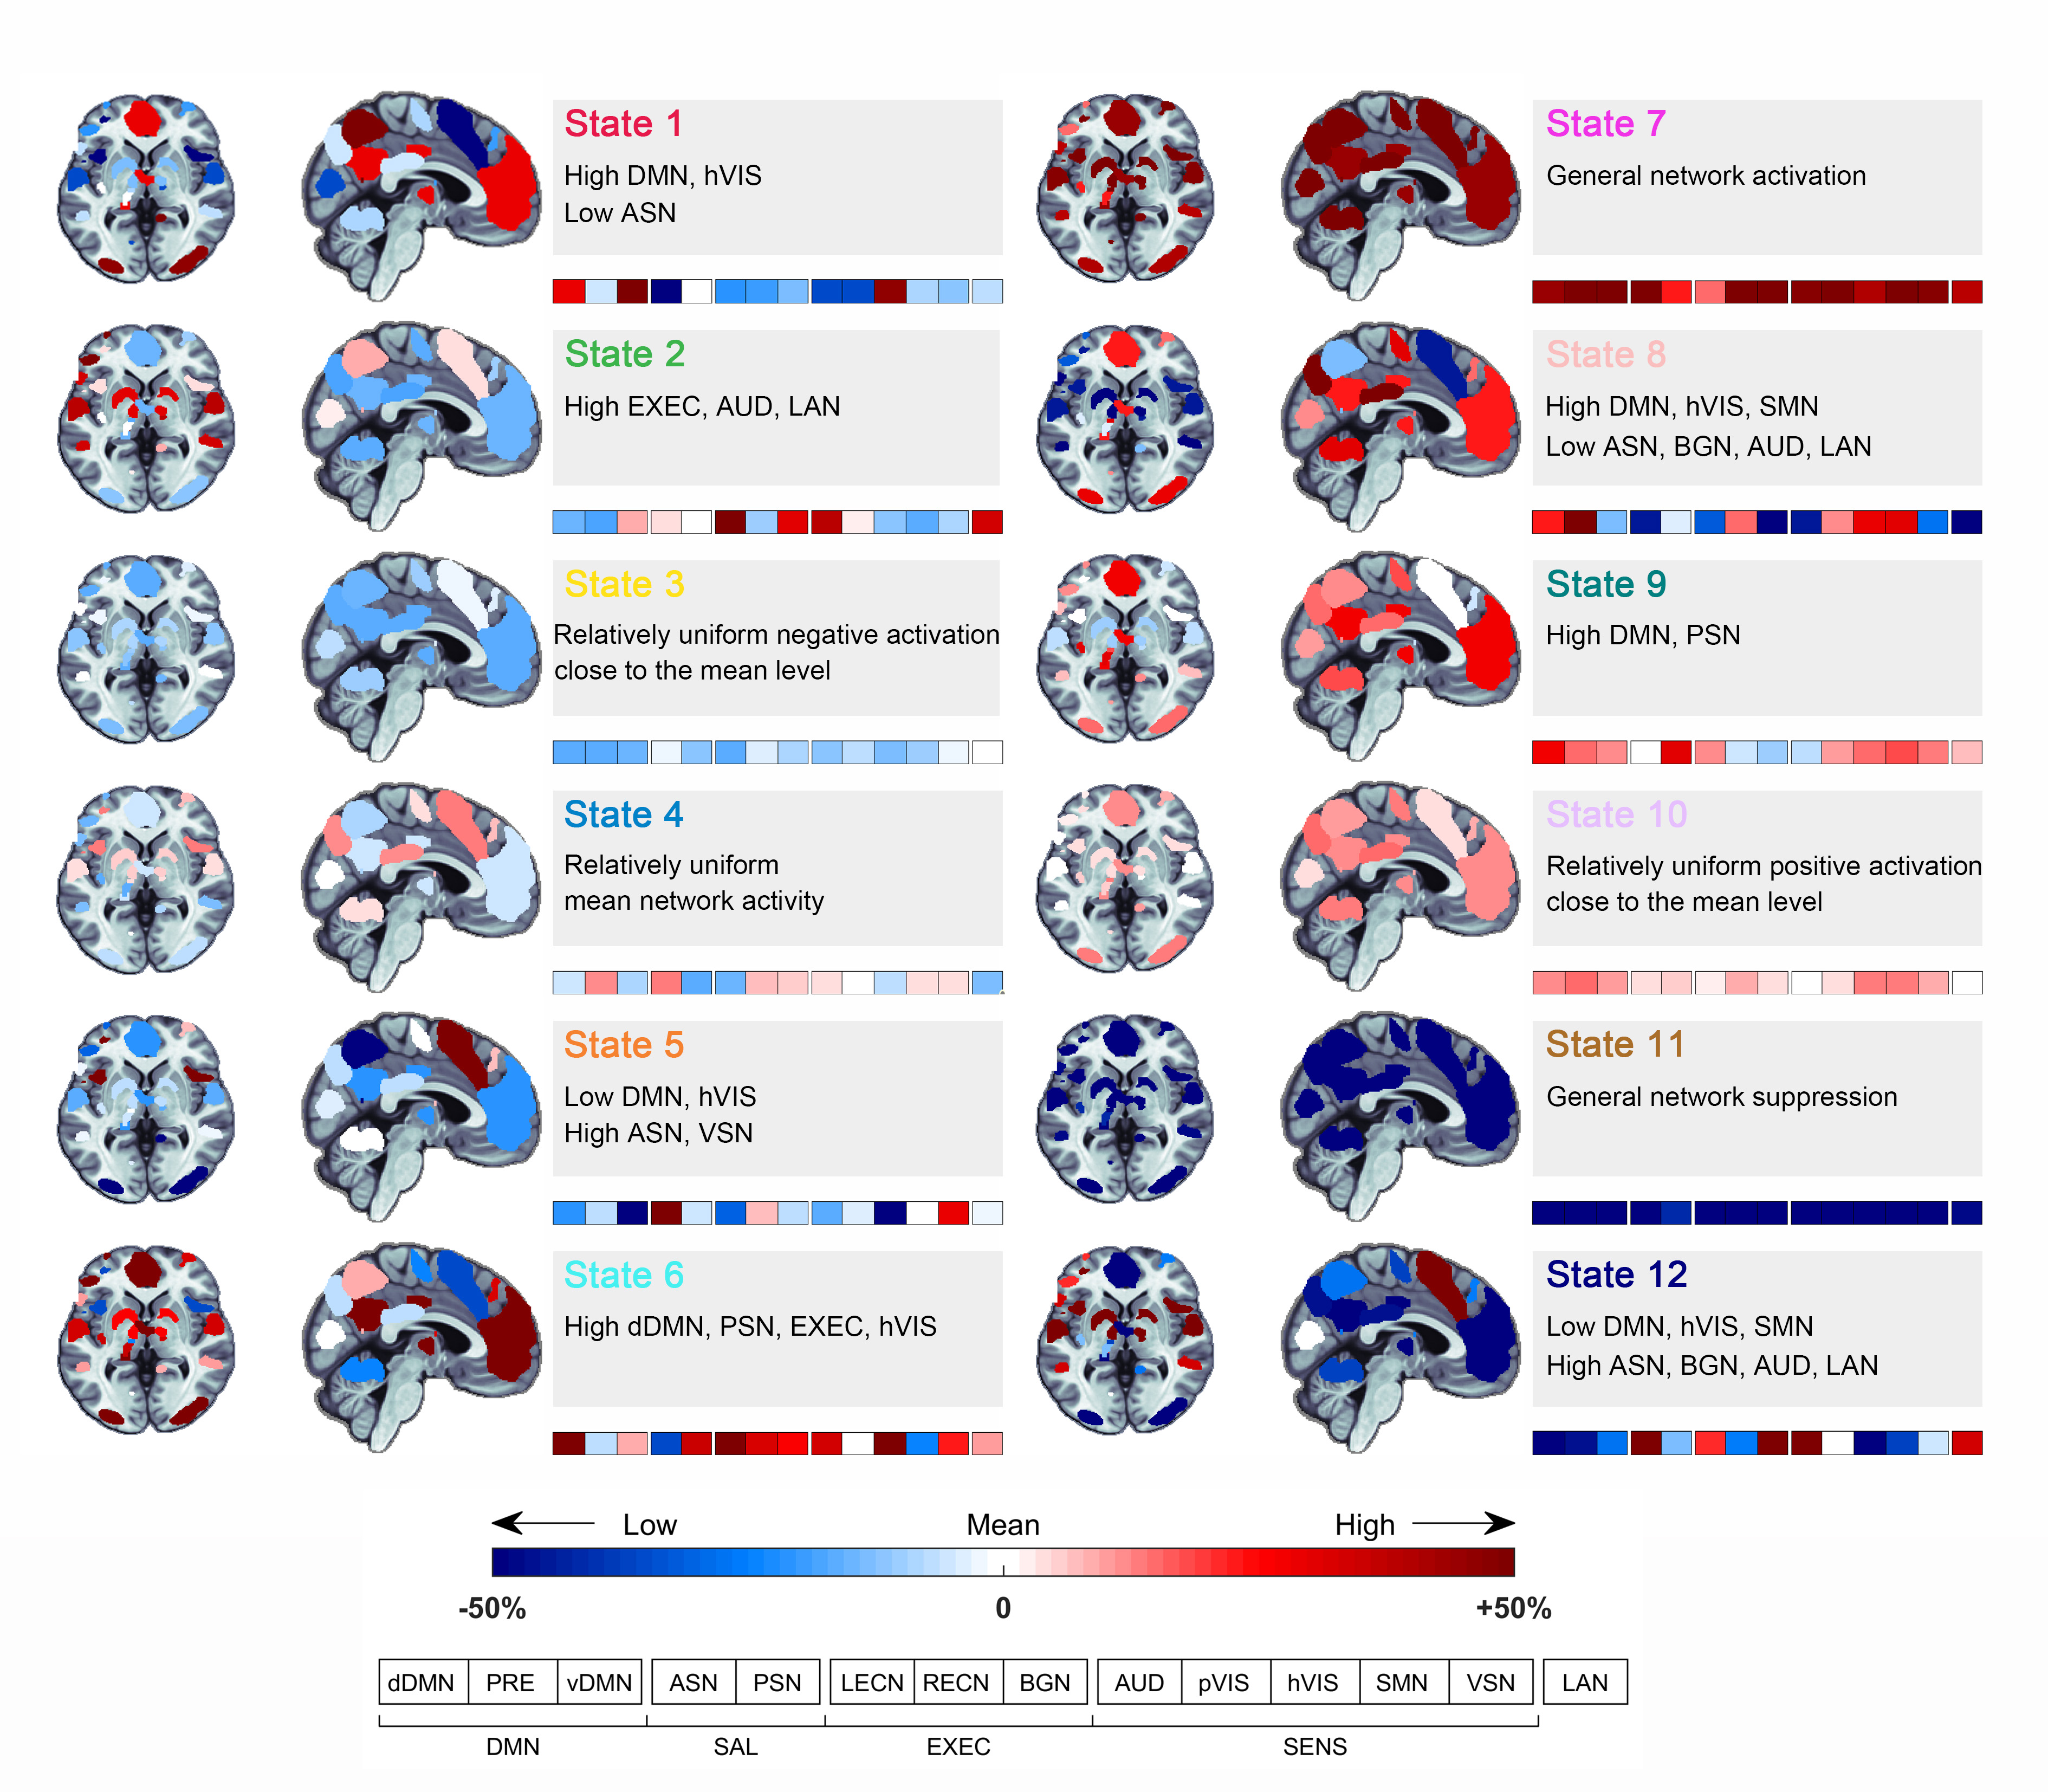
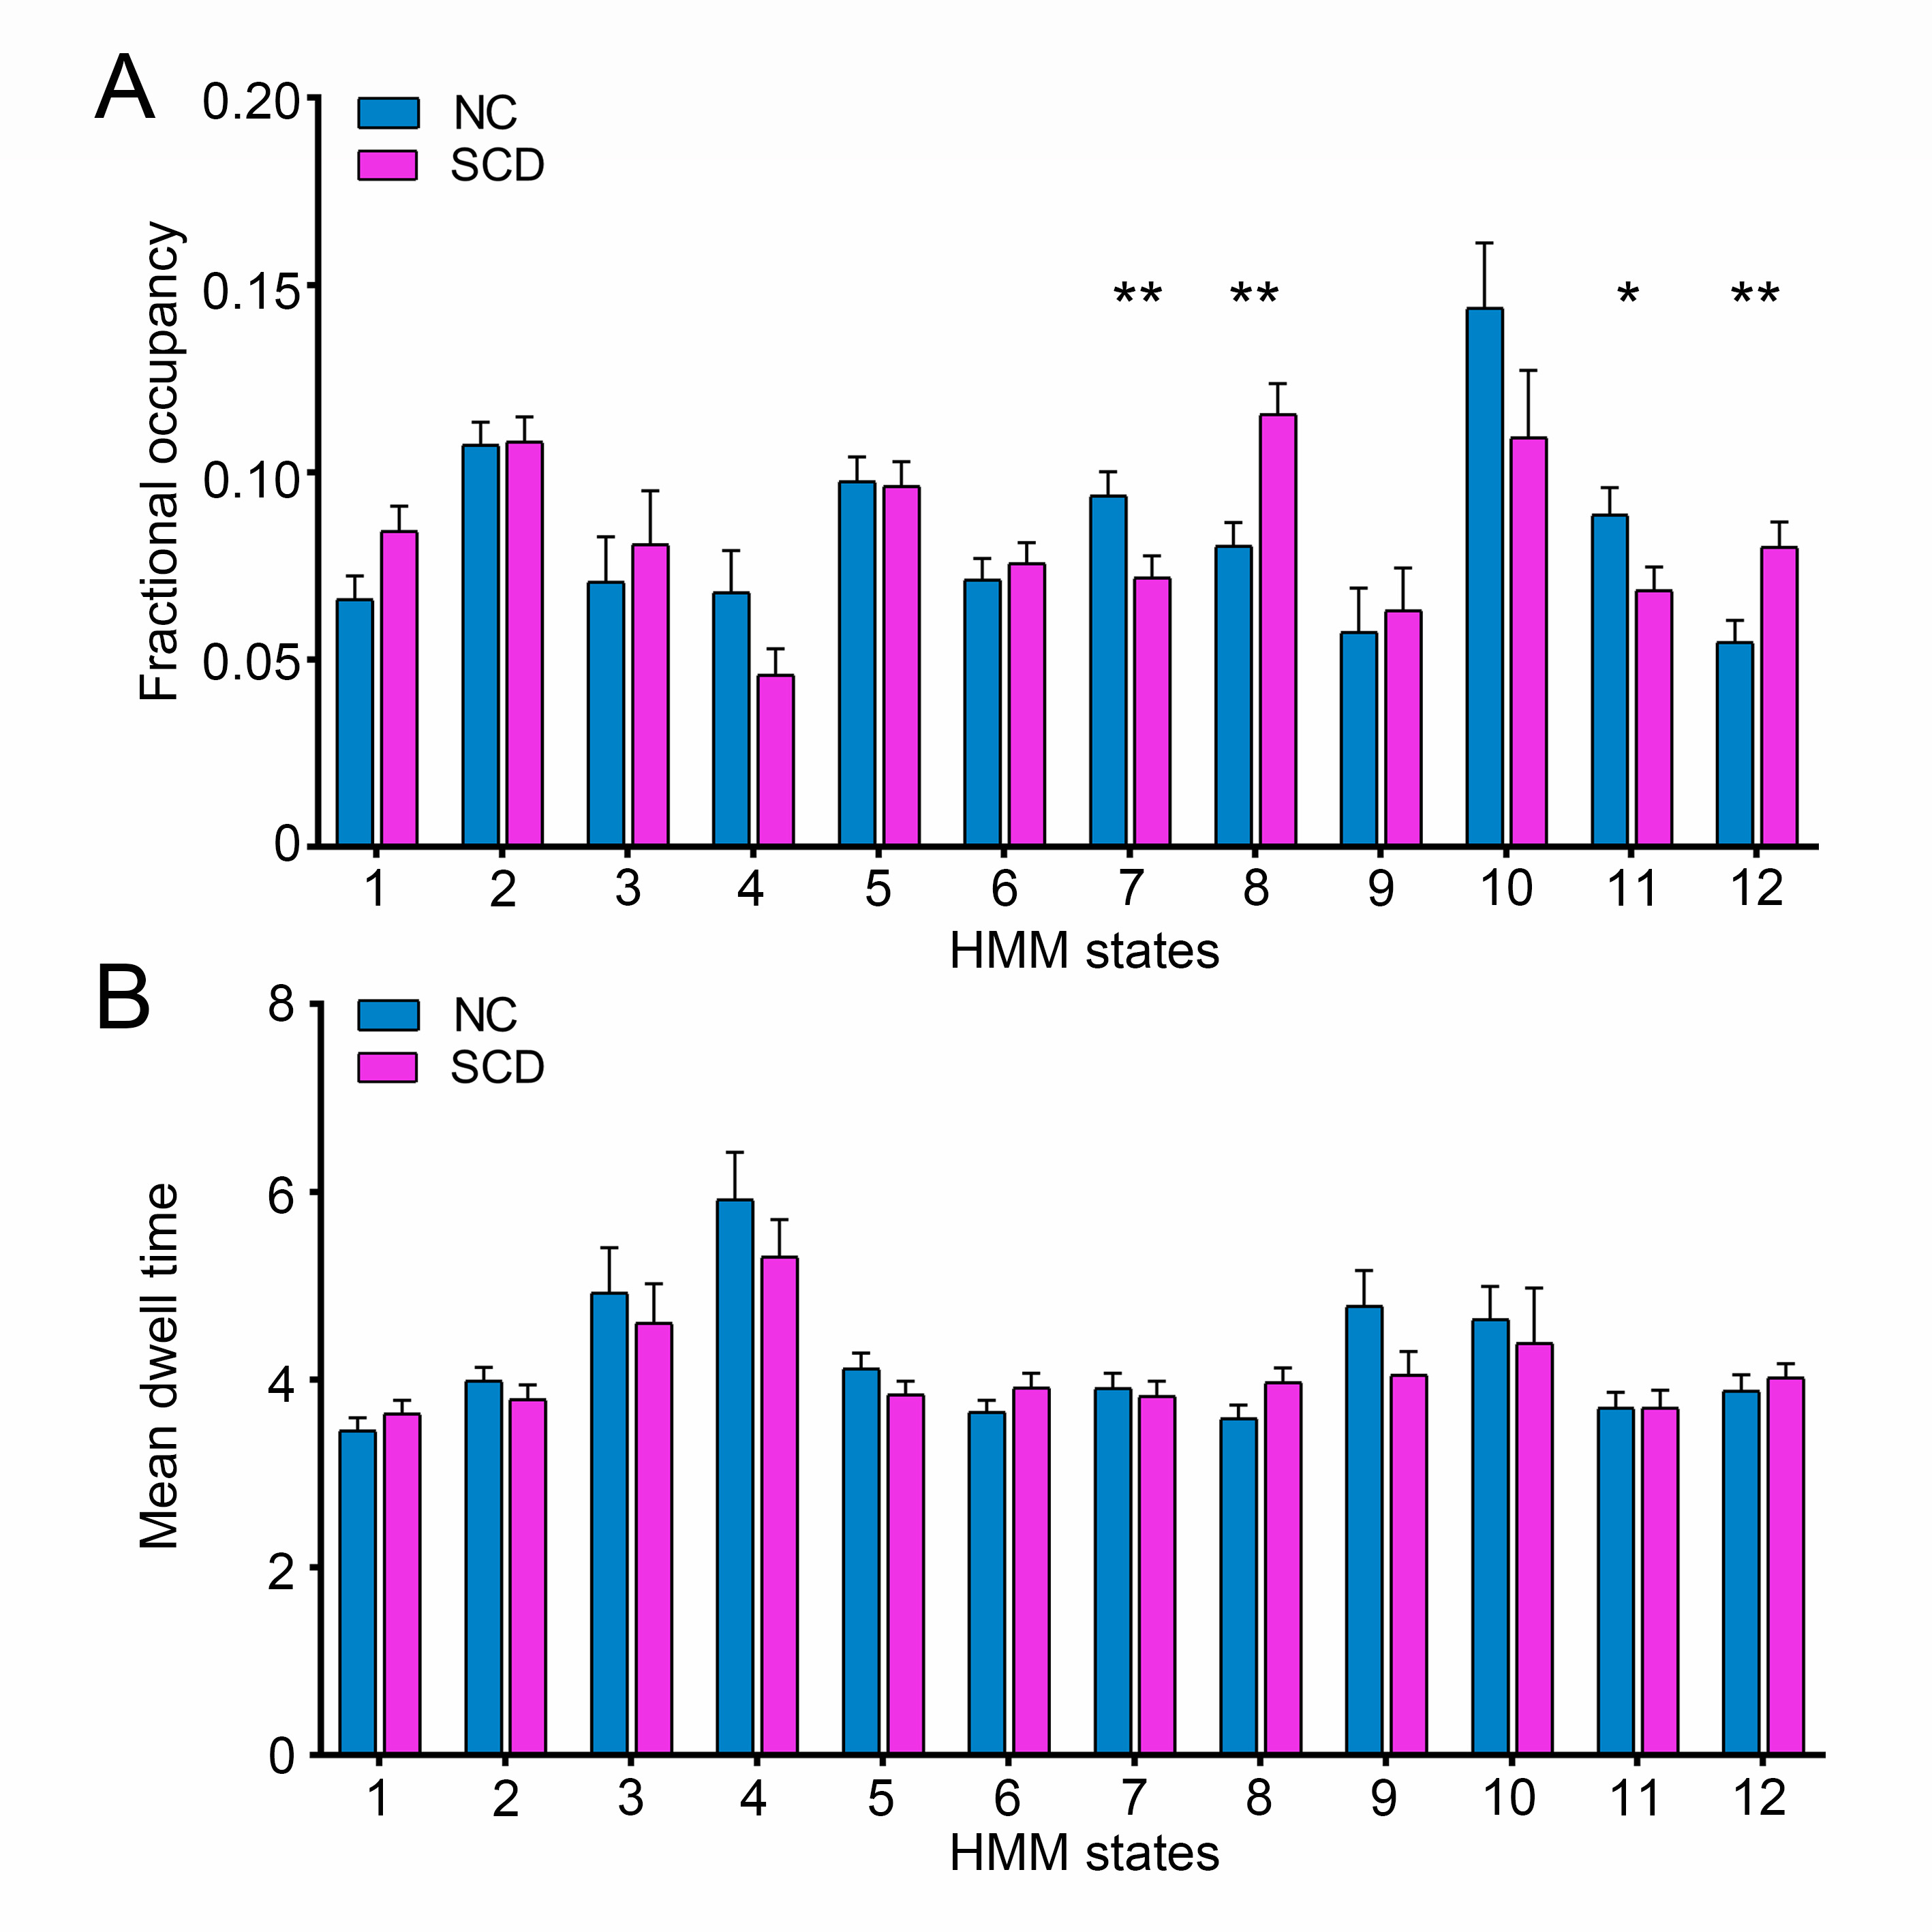
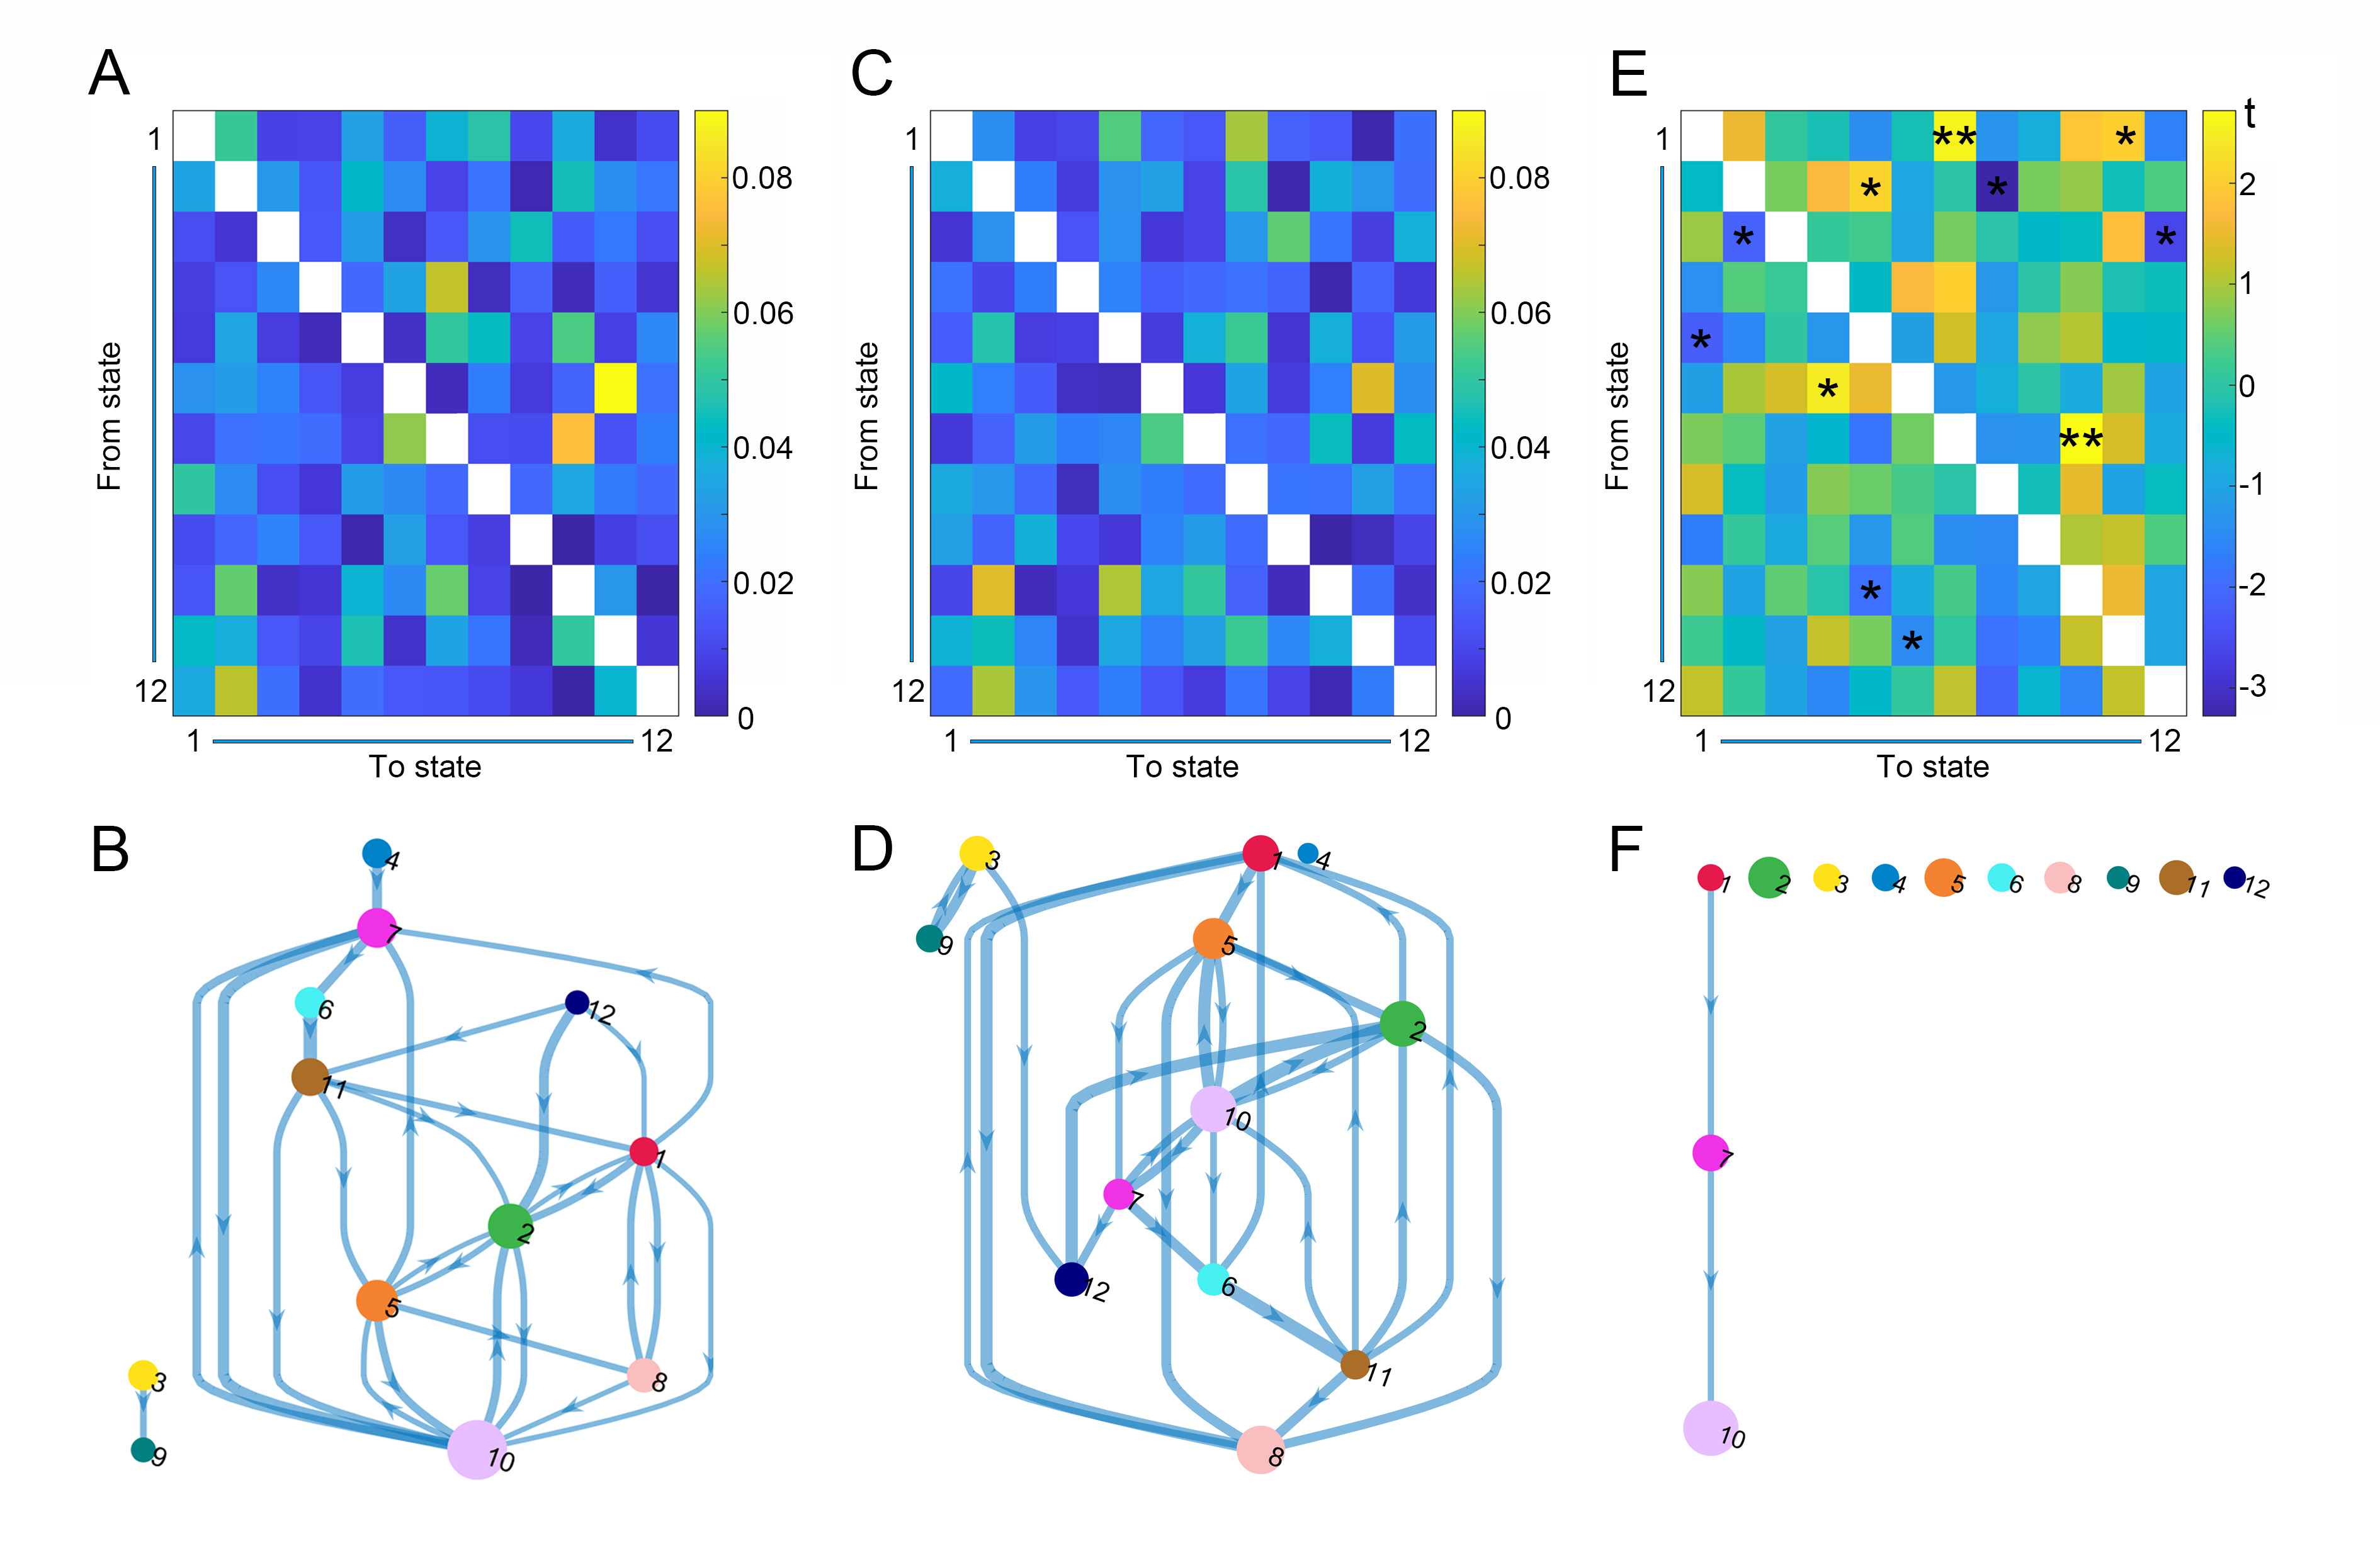
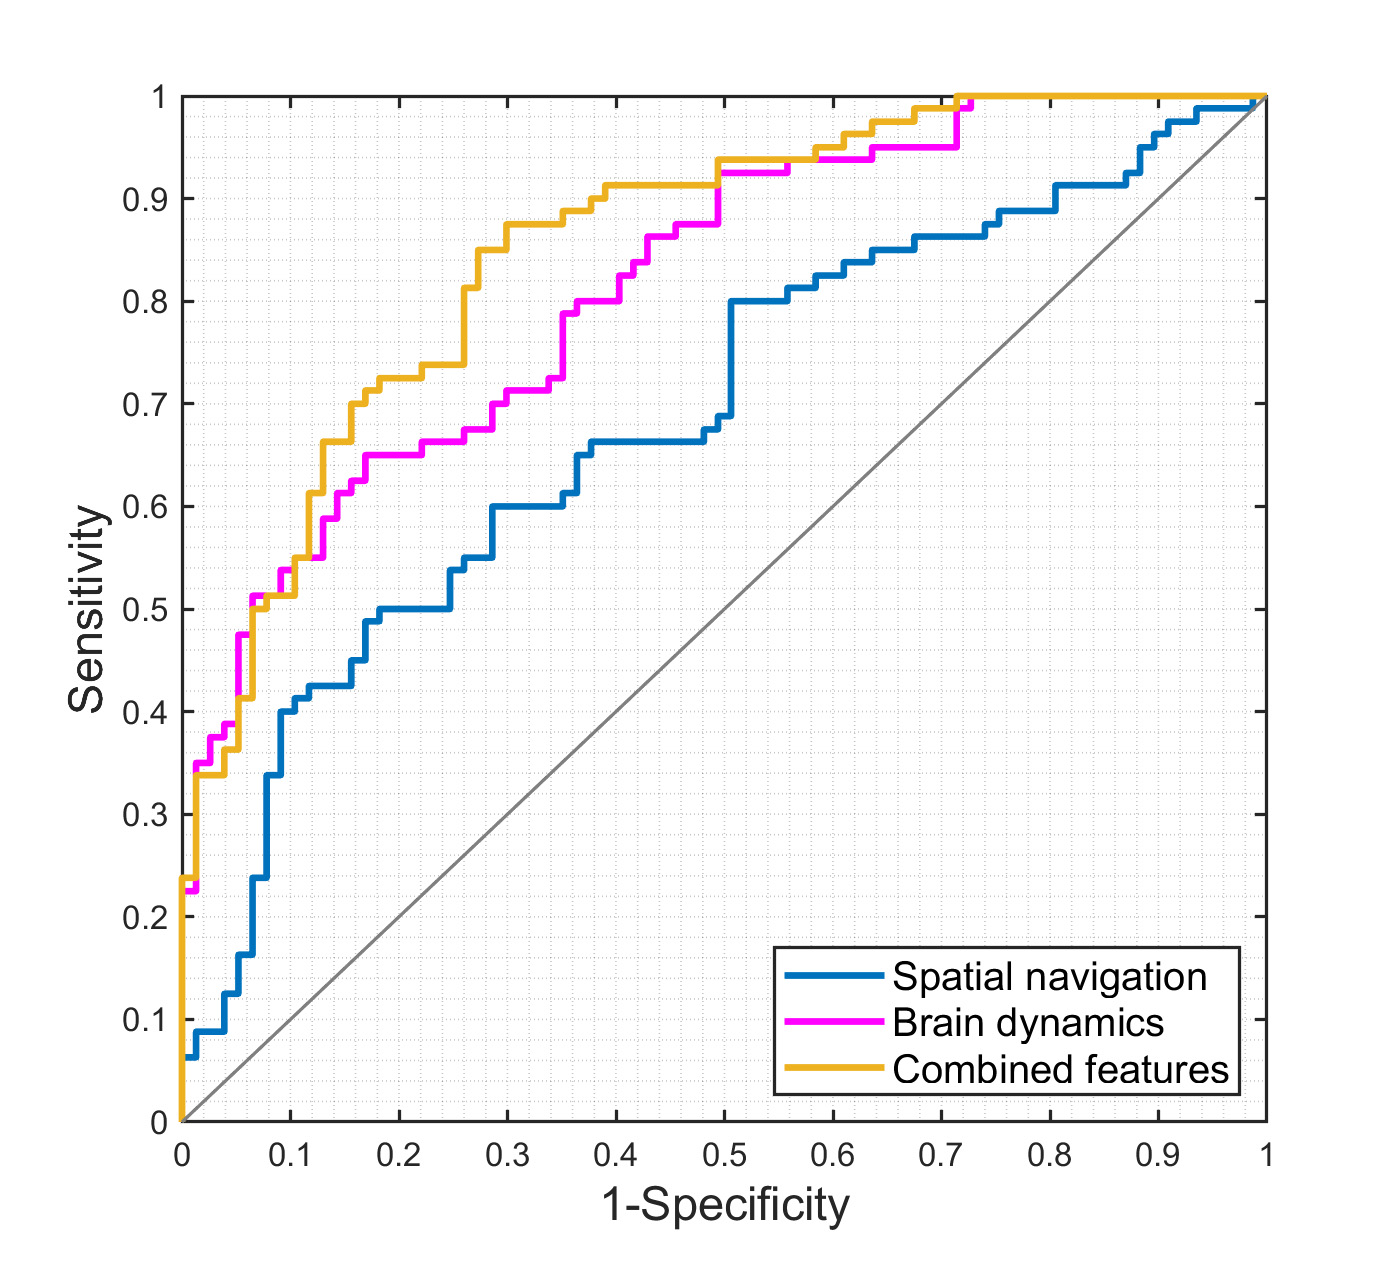
In total, 80 SCD subjects and 77 NCs were enrolled in this study. Each participant was administered a set of standardized neuropsychological tests, a computerized spatial navigation test, and brain MRI scanning. The temporal dynamics of blood oxygenation level-dependent (BOLD) activity were modeled in 14 predefined canonical resting-state networks using an HMM5. These 14 predefined canonical networks included dorsal and ventral default mode networks (dDMN and vDMN), precuneus network (PRE), anterior and posterior salience networks (ASN and PSN), left and right executive control networks (lECN and rECN), basal ganglia network (BGN), auditory network (AUD), primary and high visual networks (pVIS and hVIS), sensorimotor network (SMN), visuospatial network (VSN), and language network (LAN). The HMM-MAR MATLAB toolbox was used to perform Variational Bayes inference on the HMM using 500 training circles. Following previous studies, we inferred the HMM with 12 states6, 7. The fractional occupancy and mean dwell time in each of the 12 states as well as transition probabilities between states were quantified for each subject. Fractional occupancy refers to the proportion of time spent in the state during rs-fMRI data acquisition, and mean dwell time is defined as the average time resided in the state during each visit. The transition probability matrix was encoded by the likelihood of switching from one state to another. The between-group differences in spatial navigation performance and brain temporal dynamics were calculated. The classification ability of spatial navigation and brain temporal dynamics were assessed using receiver operating characteristic (ROC) curve analyses.Results
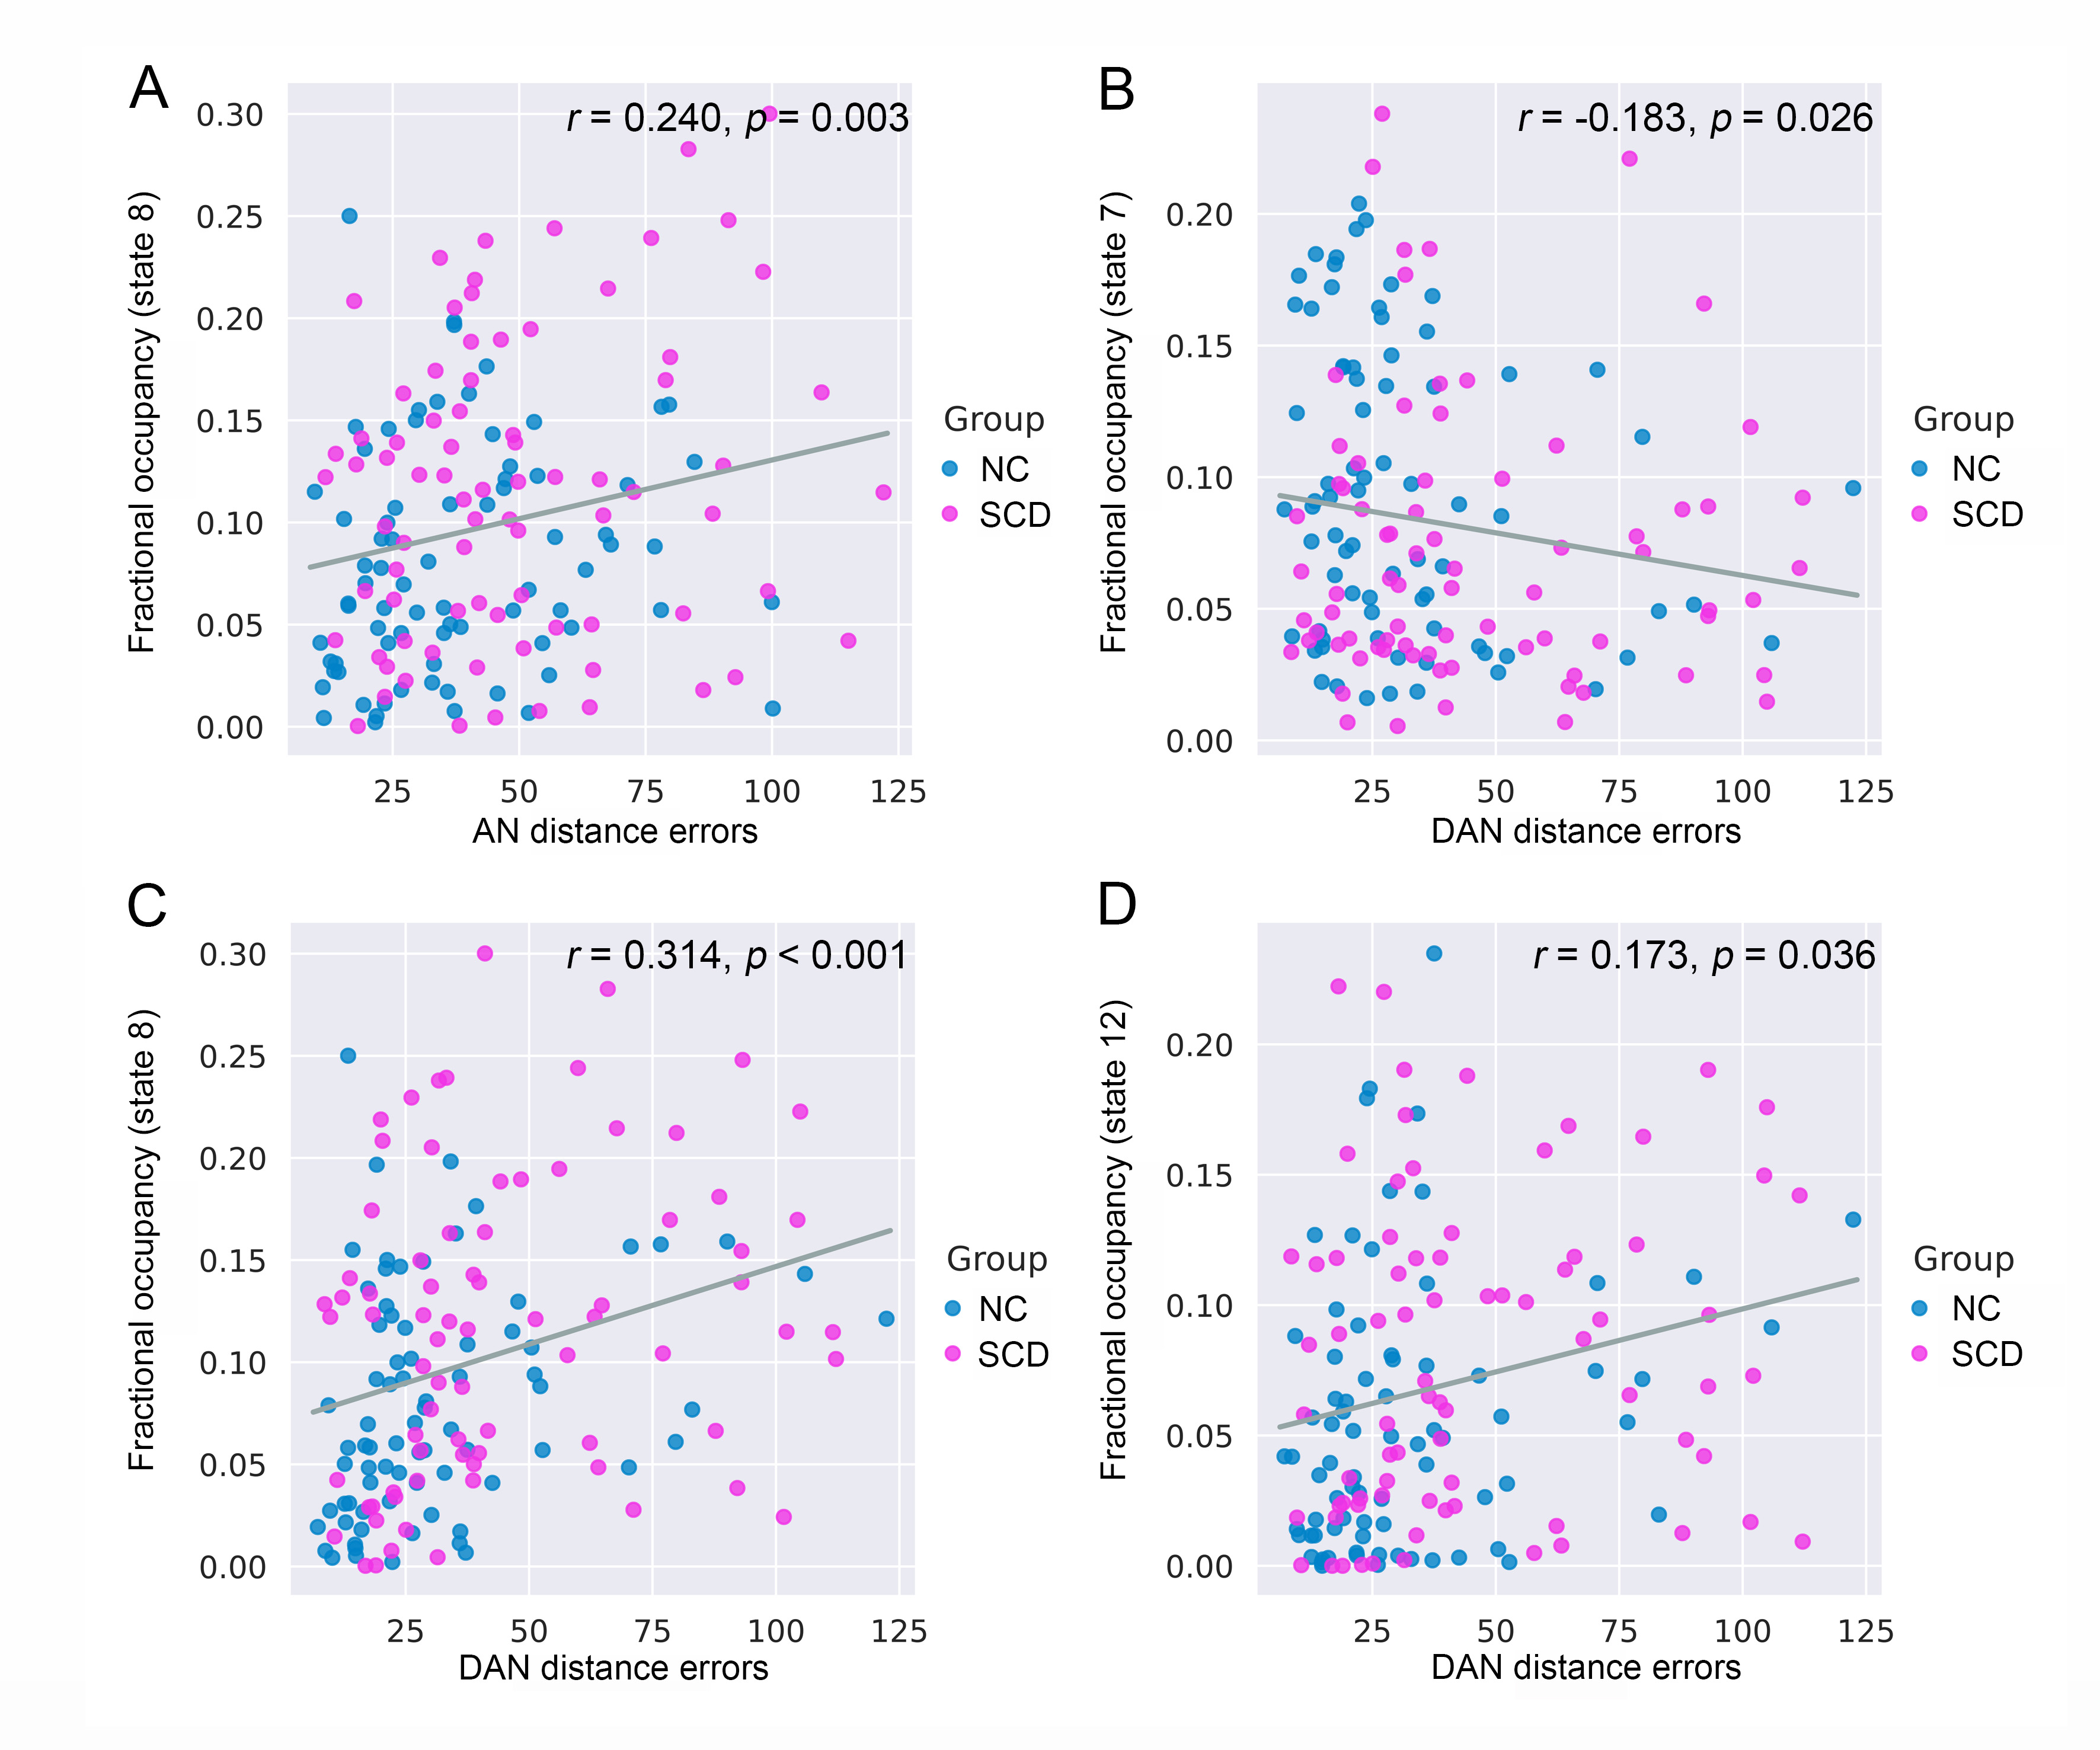
Compared to the NC group, the SCD group showed significantly larger navigation distance errors. The SCD group showed more fractional occupancy in state 8 and state 12, while less fractional occupancy in state 7. The SCD group showed significantly decreased transition probabilities from state 1 to state 7 and from state 7 to state 10. Fractional occupancy in state 8 was positively correlated with allocentric distance errors (r = 0.240, p = 0.003) and delayed allocentric distance errors (r = 0.314, p < 0.001). Fractional occupancy in state 7 showed negative correlations with delayed allocentric distance errors (r = -0.183, p = 0.026). More fractional occupancy in state 12 was associated with larger delayed allocentric distance errors (r = 0.173, p = 0.036). The transition probability from state 7 to state 10 was negatively correlated with delayed allocentric distance errors (r = -0.164, p = 0.047). The ROC curve based on spatial navigation features showed an area under the curve (AUC) value of 0.687, while that based on brain dynamics features showed an AUC value of 0.817. The combined features achieved the highest AUC value of 0.854, with an accuracy of 76.4%.Discussion
The present study was the first to try to infer brain dynamics using the HMM in a cohort of SCD and NC participants. Specifically, state 8 and state 12 occurred more often in the SCD group, while state 7 occurred more often in the NC group. The more fractional occupancy in state 7 indicated that the NC group was more inclined to be in the state with the strongest positive activations, which may represent high information processing and transfer across networks. However, this process occurred less frequently in the SCD group. In contrast, the increased fractional occupancy in state 8 and 12 suggested that the vDMN, PSN, and VSN were less activated in the SCD group, which may further result in deficiencies in self-projective thinking, interoceptive awareness, and visuospatial ability8-10. The SCD group was less likely to transition from state 1 to state 7 and from state 7 to state 10, suggesting that the SCD group was characterized by an inability to dynamically activate and deactivate the state with the highest network activation. This implied that the mechanisms that upregulate and downregulate brain network activation were disrupted in SCD subjects, which may further contribute to deficits in neural flexibility and capacity. Classification analysis revealed that the combination of sensitive objective markers extracted from behaviour and functional neuroimaging may have the potential to identify SCD individuals from NCs.Conclusion
This study may suggest the neural basis underlying spatial deficits in SCD subjects from the perspective of reduced dynamism of brain activity and indicate the promising role of spatial navigation and brain dynamics in the preclinical identification of incipient AD patients.Acknowledgements
This work was supported by the National Science and Technology Innovation 2030 -- Major program of "Brain Science and Brain-Like Research" (2022ZD0211800); the National Natural Science Foundation of China (81720108022, 81971596, 82001793); the Key Scientific Research Project of Jiangsu Health Committee (K2019025); the Industry and Information Technology Department of Nanjing (SE179-2021); the Educational Research Project of Nanjing Medical University (2019ZC036); the Project of Nanjing Health Science and Technology Development (YKK19055); and funding for Clinical Trials from the Affiliated Drum Tower Hospital, Medical School of Nanjing University.References
1. Jessen F, Amariglio RE, Buckley RF, et al. The characterisation of subjective cognitive decline. Lancet Neurol. 2020;19(3):271-278.
2. Coughlan G, Laczó J, Hort J, et al. Spatial navigation deficits - overlooked cognitive marker for preclinical Alzheimer disease? Nat Rev Neurol. 2018;14(8):496-506.
3. Fiorenzato E, Strafella AP, Kim J, et al. Dynamic functional connectivity changes associated with dementia in Parkinson's disease. Brain. 2019;142(9):2860-2872.
4. Meer JNV, Breakspear M, Chang LJ, et al. Movie viewing elicits rich and reliable brain state dynamics. Nat Commun. 2020;11(1):5004.
5. Shirer WR, Ryali S, Rykhlevskaia E, et al. Decoding subject-driven cognitive states with whole-brain connectivity patterns. Cereb Cortex. 2012;22(1):158-165.
6. Wang S, Wen H, Hu X, et al. Transition and Dynamic Reconfiguration of Whole-Brain Network in Major Depressive Disorder. Mol Neurobiol. 2020;57(10):4031-4044.
7. Vidaurre D, Smith SM, Woolrich MW. Brain network dynamics are hierarchically organized in time. Proc Natl Acad Sci U S A. 2017;114(48):12827-12832.
8. Ma ZZ, Lu YC, Wu JJ, et al. Alteration of spatial patterns at the network-level in facial synkinesis: an independent component and connectome analysis. Ann Transl Med. 2021;9(3):240.
9. Sobczak AM, Bohaterewicz B, Ceglarek A, et al. Brain Under Fatigue - Can Perceived Fatigability in Multiple Sclerosis Be Seen on the Level of Functional Brain Network Architecture? Front Hum Neurosci. 2022;16:852981.
10. Kawabata K, Watanabe H, Hara K, et al. Distinct manifestation of cognitive deficits associate with different resting-state network disruptions in non-demented patients with Parkinson's disease. J Neurol. 2018;265(3):688-700.
Figures