2803
Myelin quantification: is it possible to obtain comparable g-ratio maps from different acquisition techniques?1Department of Brain and Behavioural Sciences, University of Pavia, Pavia, Italy, 2Department of Electrical, Computer and Biomedical Engineering, University of Pavia, Pavia, Italy, 3NMR Research Unit, Department of Neuroinflammation, Queen Square Multiple Sclerosis Centre, UCL Queen Square Institute of Neurology, University College London (UCL), London, United Kingdom, 4Neurology-Neuroimmunology Department Multiple Sclerosis Centre of Catalonia (Cemcat), Vall d’Hebron Barcelona Hospital Campus, Barcelona, Spain, 5Department of Medical Physics and Biomedical Engineering, Centre for Medical Image Computing (CMIC), University College London, London, United Kingdom, 6E-Health Center, Universitat Oberta de Catalunya, Barcelona, Spain, 7Department of Medical Physics and Biomedical Engineering, Centre for Medical Image Computing (CMIC), University College London, London, Italy, 8Brain Connectivity Centre, IRCCS Mondino Foundation, Pavia, Italy
Synopsis
Keywords: White Matter, Multi-Contrast, Myelin
Quantifying myelin in vivo with MRI is useful for studying multiple sclerosis by calculating the g-ratio. To estimate the g-ratio, special sequences often must be set. We have developed a preliminary method for calculating g-ratio from clinical images i.e. T1w and T2w. We then compared three methods to obtain the g-ratio: from quantitative Magnetization Transfer (qMT) (gold standard), from Macromolecular Tissue Volume (MTV) and from T1w/T2w. The MTV (g_MTV) and T1w/T2w (g_T1wT2w) g-ratios were different from the qMT g-ratio (g_qMT). g_MTV flattens differences between healthy and pathological subjects whereas g_T1wT2w has the same median trend as g_qMT.Introduction
Quantifying myelin in vivo is valuable for investigating the progression of demyelinating diseases such as multiple sclerosis (MS)1,2. Demyelination and remyelination affect myelin thickness and in turn nerve conductivity. A promising index for quantifying myelin damage is the g-ratio, which provides an estimate of the thickness of the myelin sheath as the ratio between the internal and external axon diameter. Using MRI, it is possible to estimate the g-ratio from different acquisition techniques. However, while a variety of approaches for g-ratio mapping have been demonstrated, so far little attention has been given to the quantitative comparison of the resultant maps. It is imperative to demonstrate the robustness of g-ratio imaging, especially in disease.We calculated the g-ratio in a cohort of healthy and MS subjects with three different methods, using maps obtained from the Neurite Orientation Dispersion and Density Imaging (NODDI)3 in combination with: (1) quantitative Magnetization Transfer (qMT)4; (2) Macromolecular Tissue Volume (MTV)5; (3) T1w/T2w6.
We compared the three methods, assuming NODDI+qMT as the gold standard, and evaluated their ability to discriminate between disease groups.
Methods
Subjects and acquisition: 17 Healthy Controls (HC)(13 Females, 57±8years), 7 primary progressive MS (PPMS, 2 Females, 61±4years), 3 relapsing-remitting MS (RRMS; 1 Female, 64±3years), and 31 secondary progressive MS (SPMS; 21 Females, 56±6years) were recruited.The following data were acquired, using a 3T Philips Ingenia CX-scanner: Diffusion weighted (DW) images using a spin-echo EPI sequence (TR/TE=6287/96ms, 2x2x2mm3, 3/20/20/36 DW per b-value=0/1000/2000/2800s/mm2); T1w scan (TR/TE/TI=6.9/3.1/810ms, 1x1x1mm3, flip-angle=8°); qMT (TR/TE=7626/59ms, 2x2x2mm3, 10 MT weighted and 2 reference images). In a subgroup (21 subjects) the MTV was calculated from B1-mapping (TE/TR=59/1500ms, 2x2x2mm3, flip-angle=60°,120°) and two 3D-FFE acquisitions (multi-echo with TR=29ms, TE1/dTE=2.3/3.3ms, 8 echoes, 1x1x1mm3, flip-angle=24° and 1 echo with flip-angle=4°).
Maps Fitting: We obtained: from DW images the isotropic and intracellular volume fractions, Viso and Vic (NODDI model), from qMT the Bound Pool Fraction (BPF)7 and from 3D-FFE scans the MTV map8.
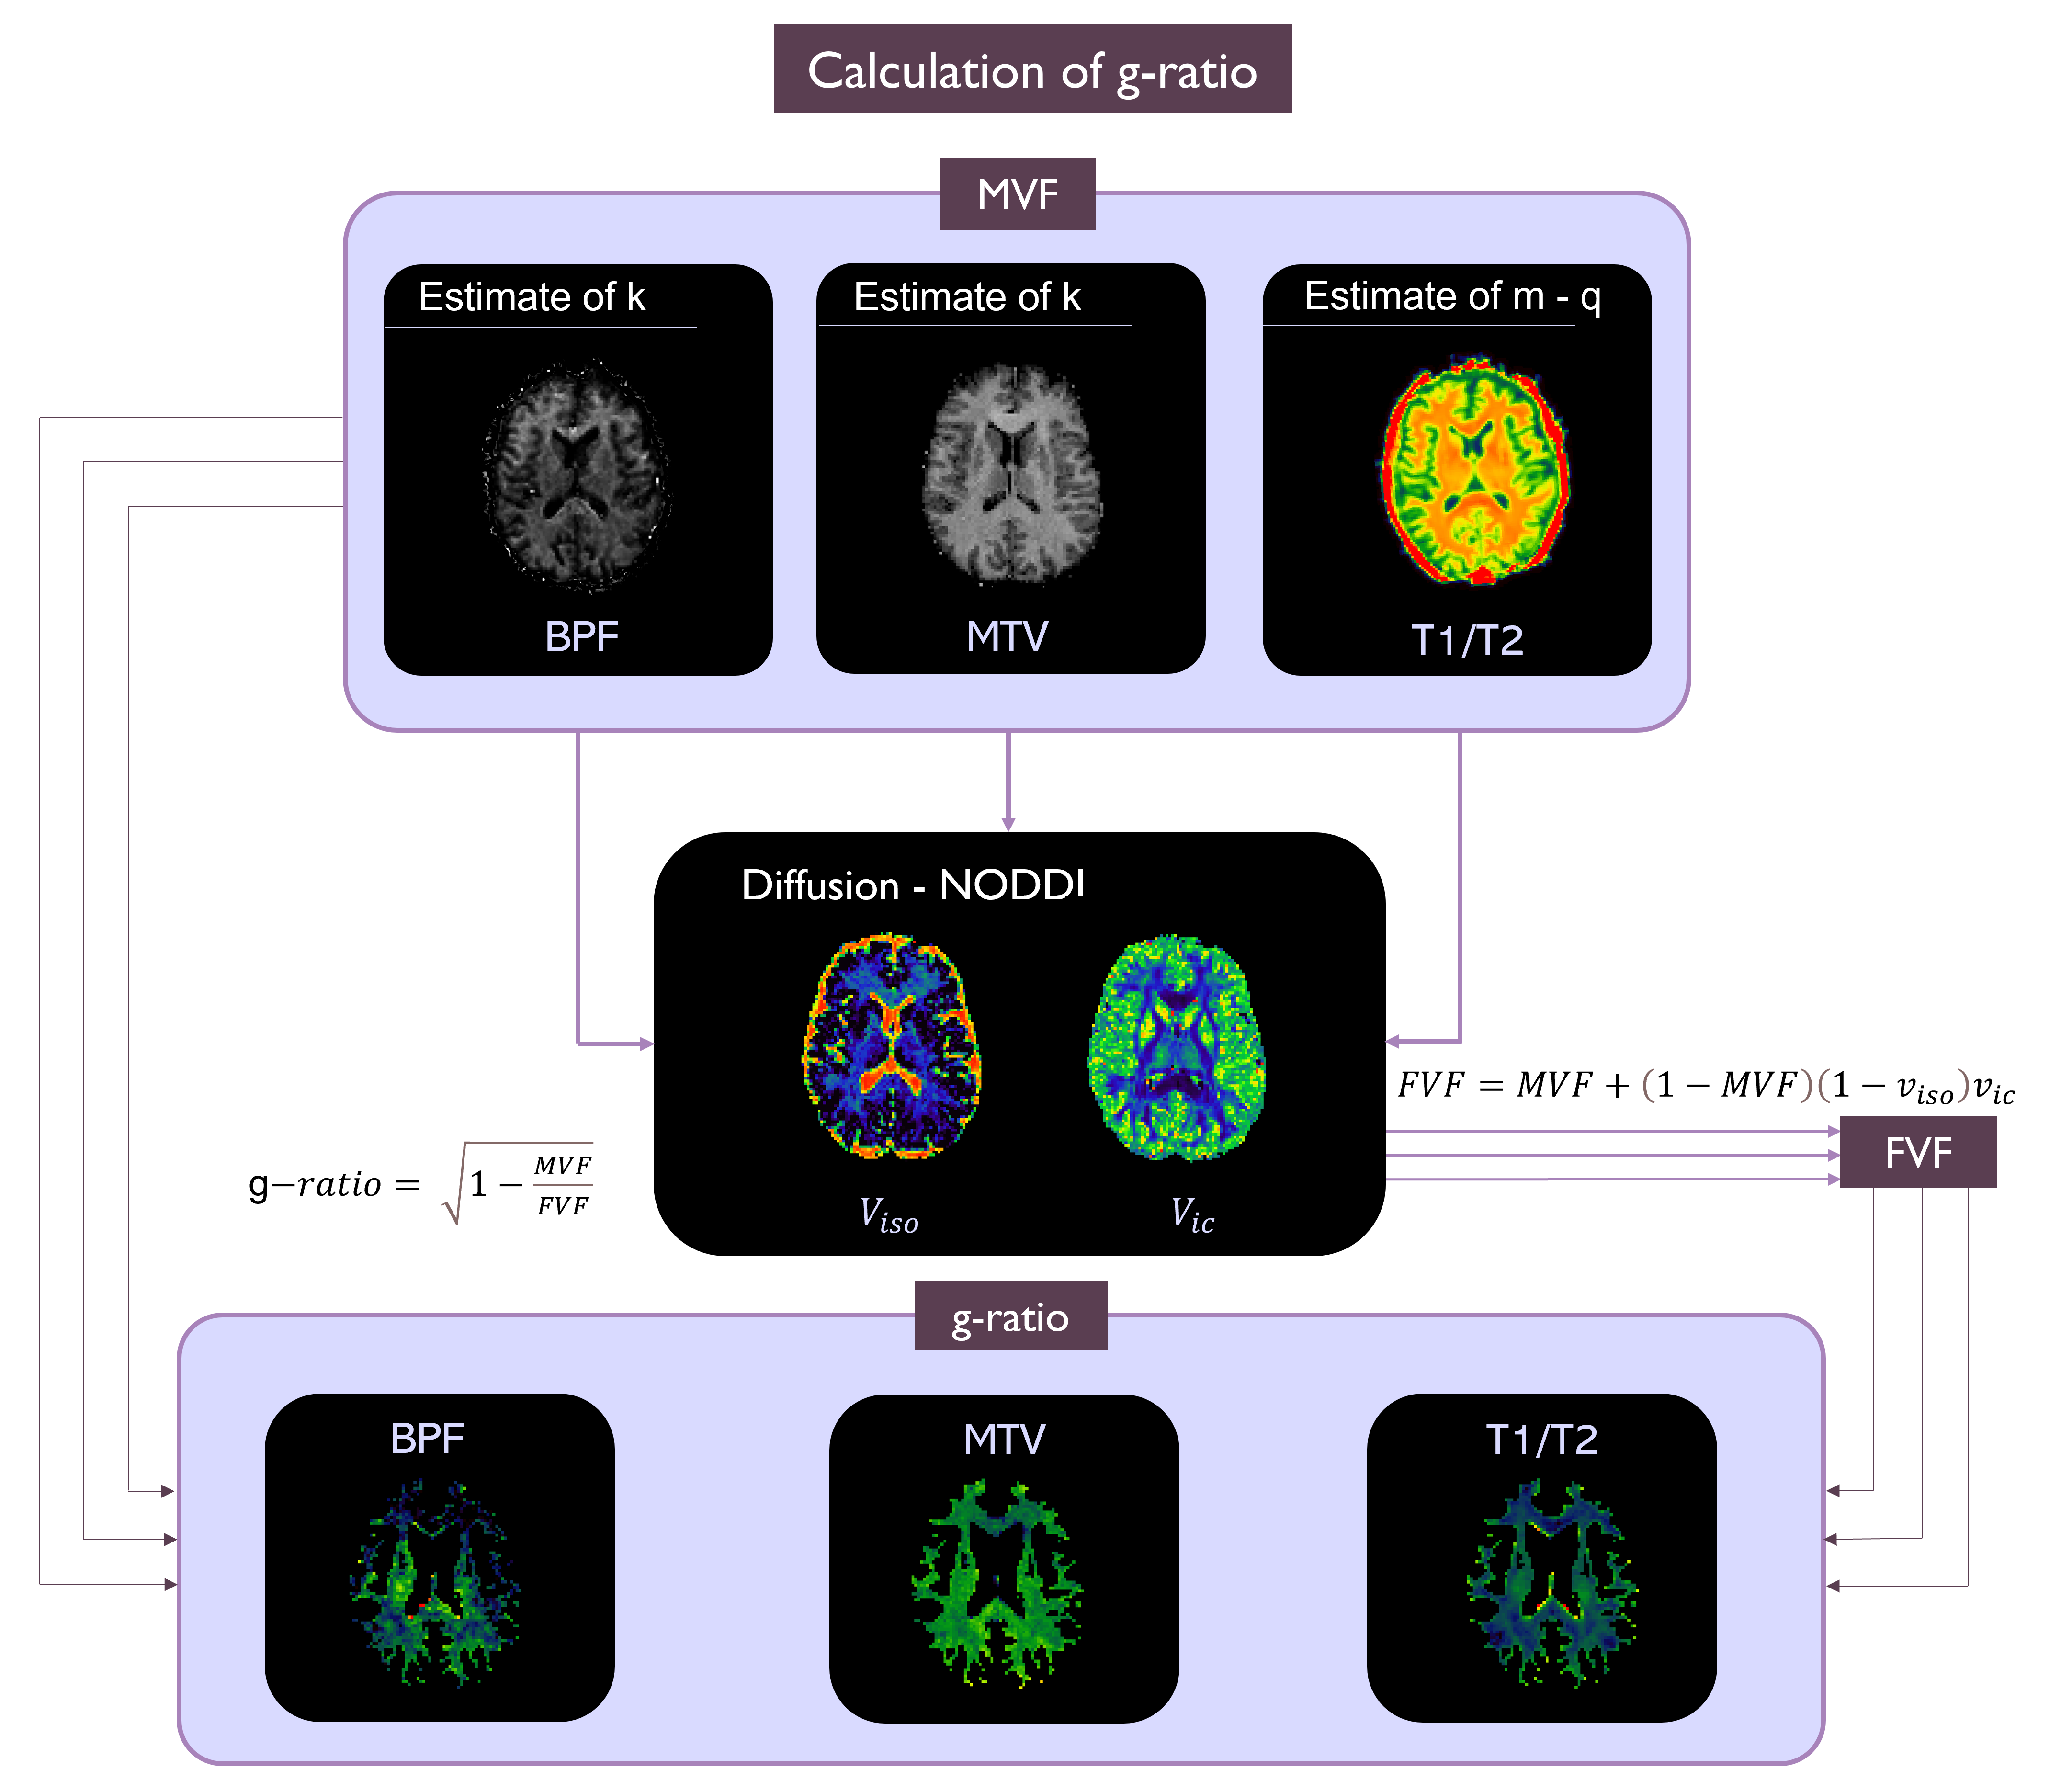
g-ratio calculation: g-ratio can be expressed as a function of Myelin Volume Fraction (MVF) and Fiber Volume Fraction (FVF)9,10 as follows:
$$g-ratio=\sqrt{1-\frac{MVF}{FVF}}$$
where $$$FVF=MVF+(1-MVF)(1-v_{iso})v_{ic}$$$
MVF calculation was performed using the qMT, MTV and T1w/T2w. We implemented existing methods for g-ratio mapping for qMT and MTV, while we developed a way to calculate g-ratio from T1w/T2w. The method using qMT was considered as the gold standard11. MVF was calculated as follows:
$$MVF_{qMT}=kBPF$$
Using MTV, similarly, the MVF is12:
$$MVF_{MTV}=αMTV$$
where k and α are two calibration constants determined by setting the mean g-ratio value in the forceps major to be equal to 0.7. A single value of k and α was obtained averaging those evaluated in 5 HCs. These parameters were applied to all subjects to obtain the g-ratio from qMT (g_qMT) and MTV (g_MTV).
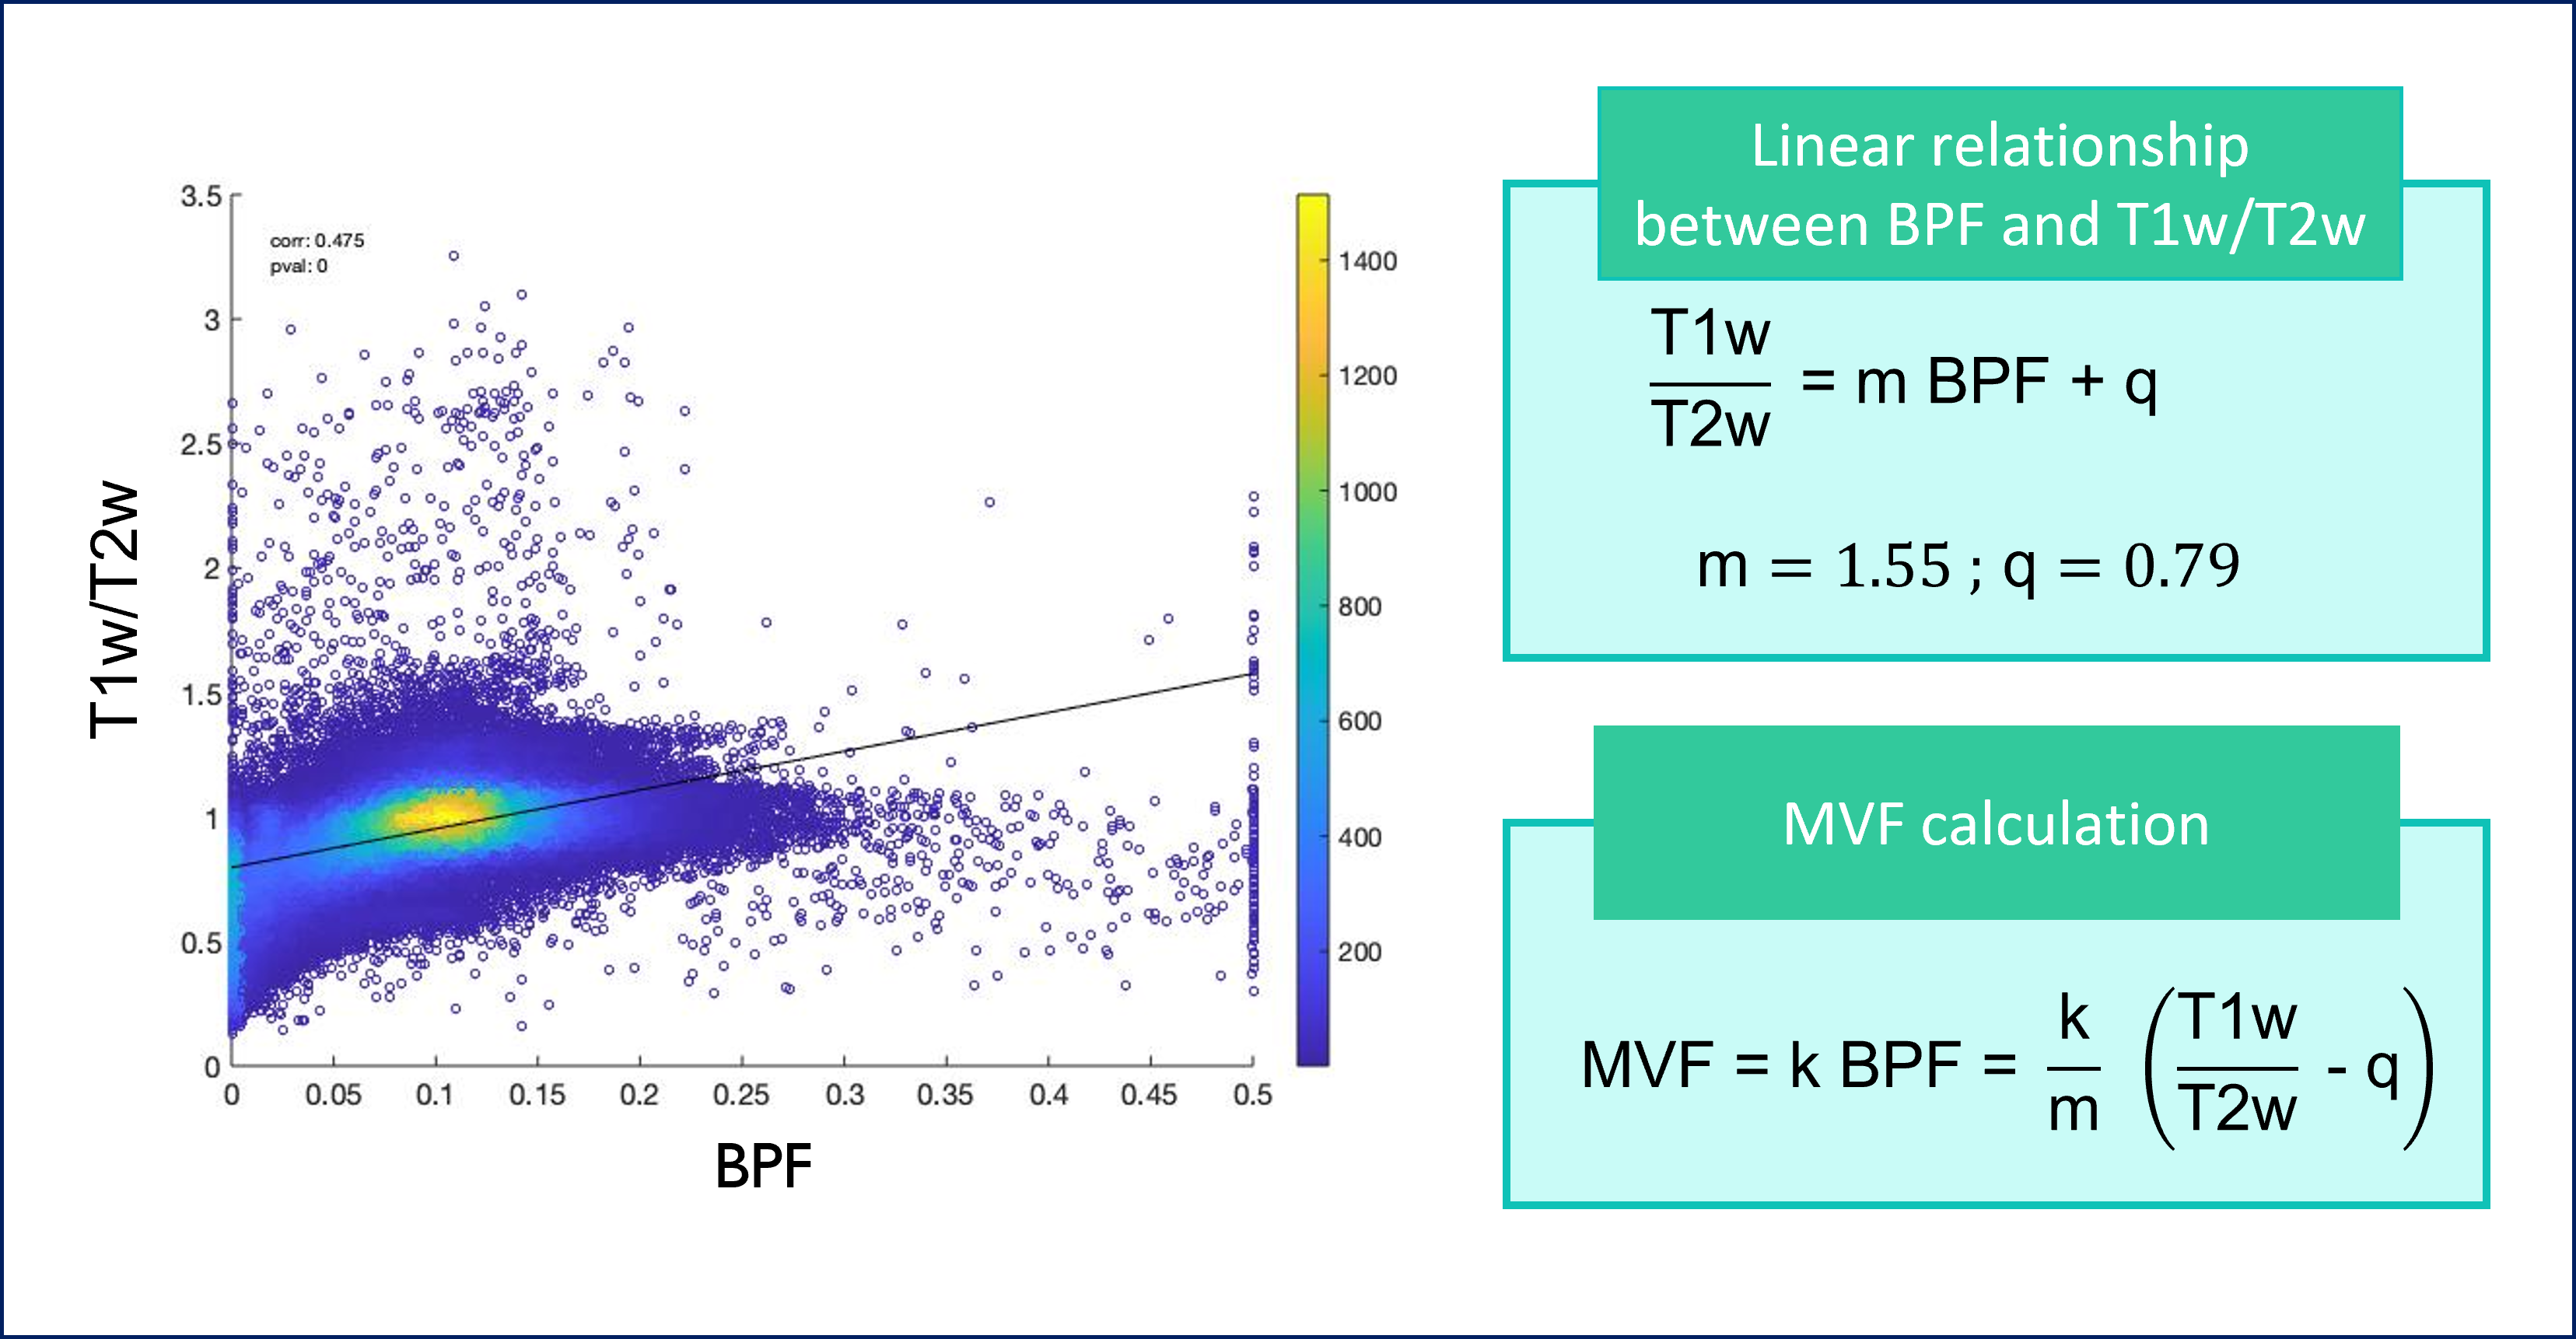
To calculate MVF from T1w/T2w (MRtool13,6), T2w volume was obtained by averaging all DW volumes with b-value=0. The relationship between BPF and T1w/T2w was investigated by considering the voxels belonging to the corpus callosum (CC) of all subjects and the result was used to calculate the g-ratio for all subjects (g_T1wT2w)(Figure 1).
Methods comparison: A Mann-Whitney U-test was performed in all 59 subjects between g_qMT and g_T1wT2w and in 21 subjects between g_qMT and g_MTV using all voxels in CC.
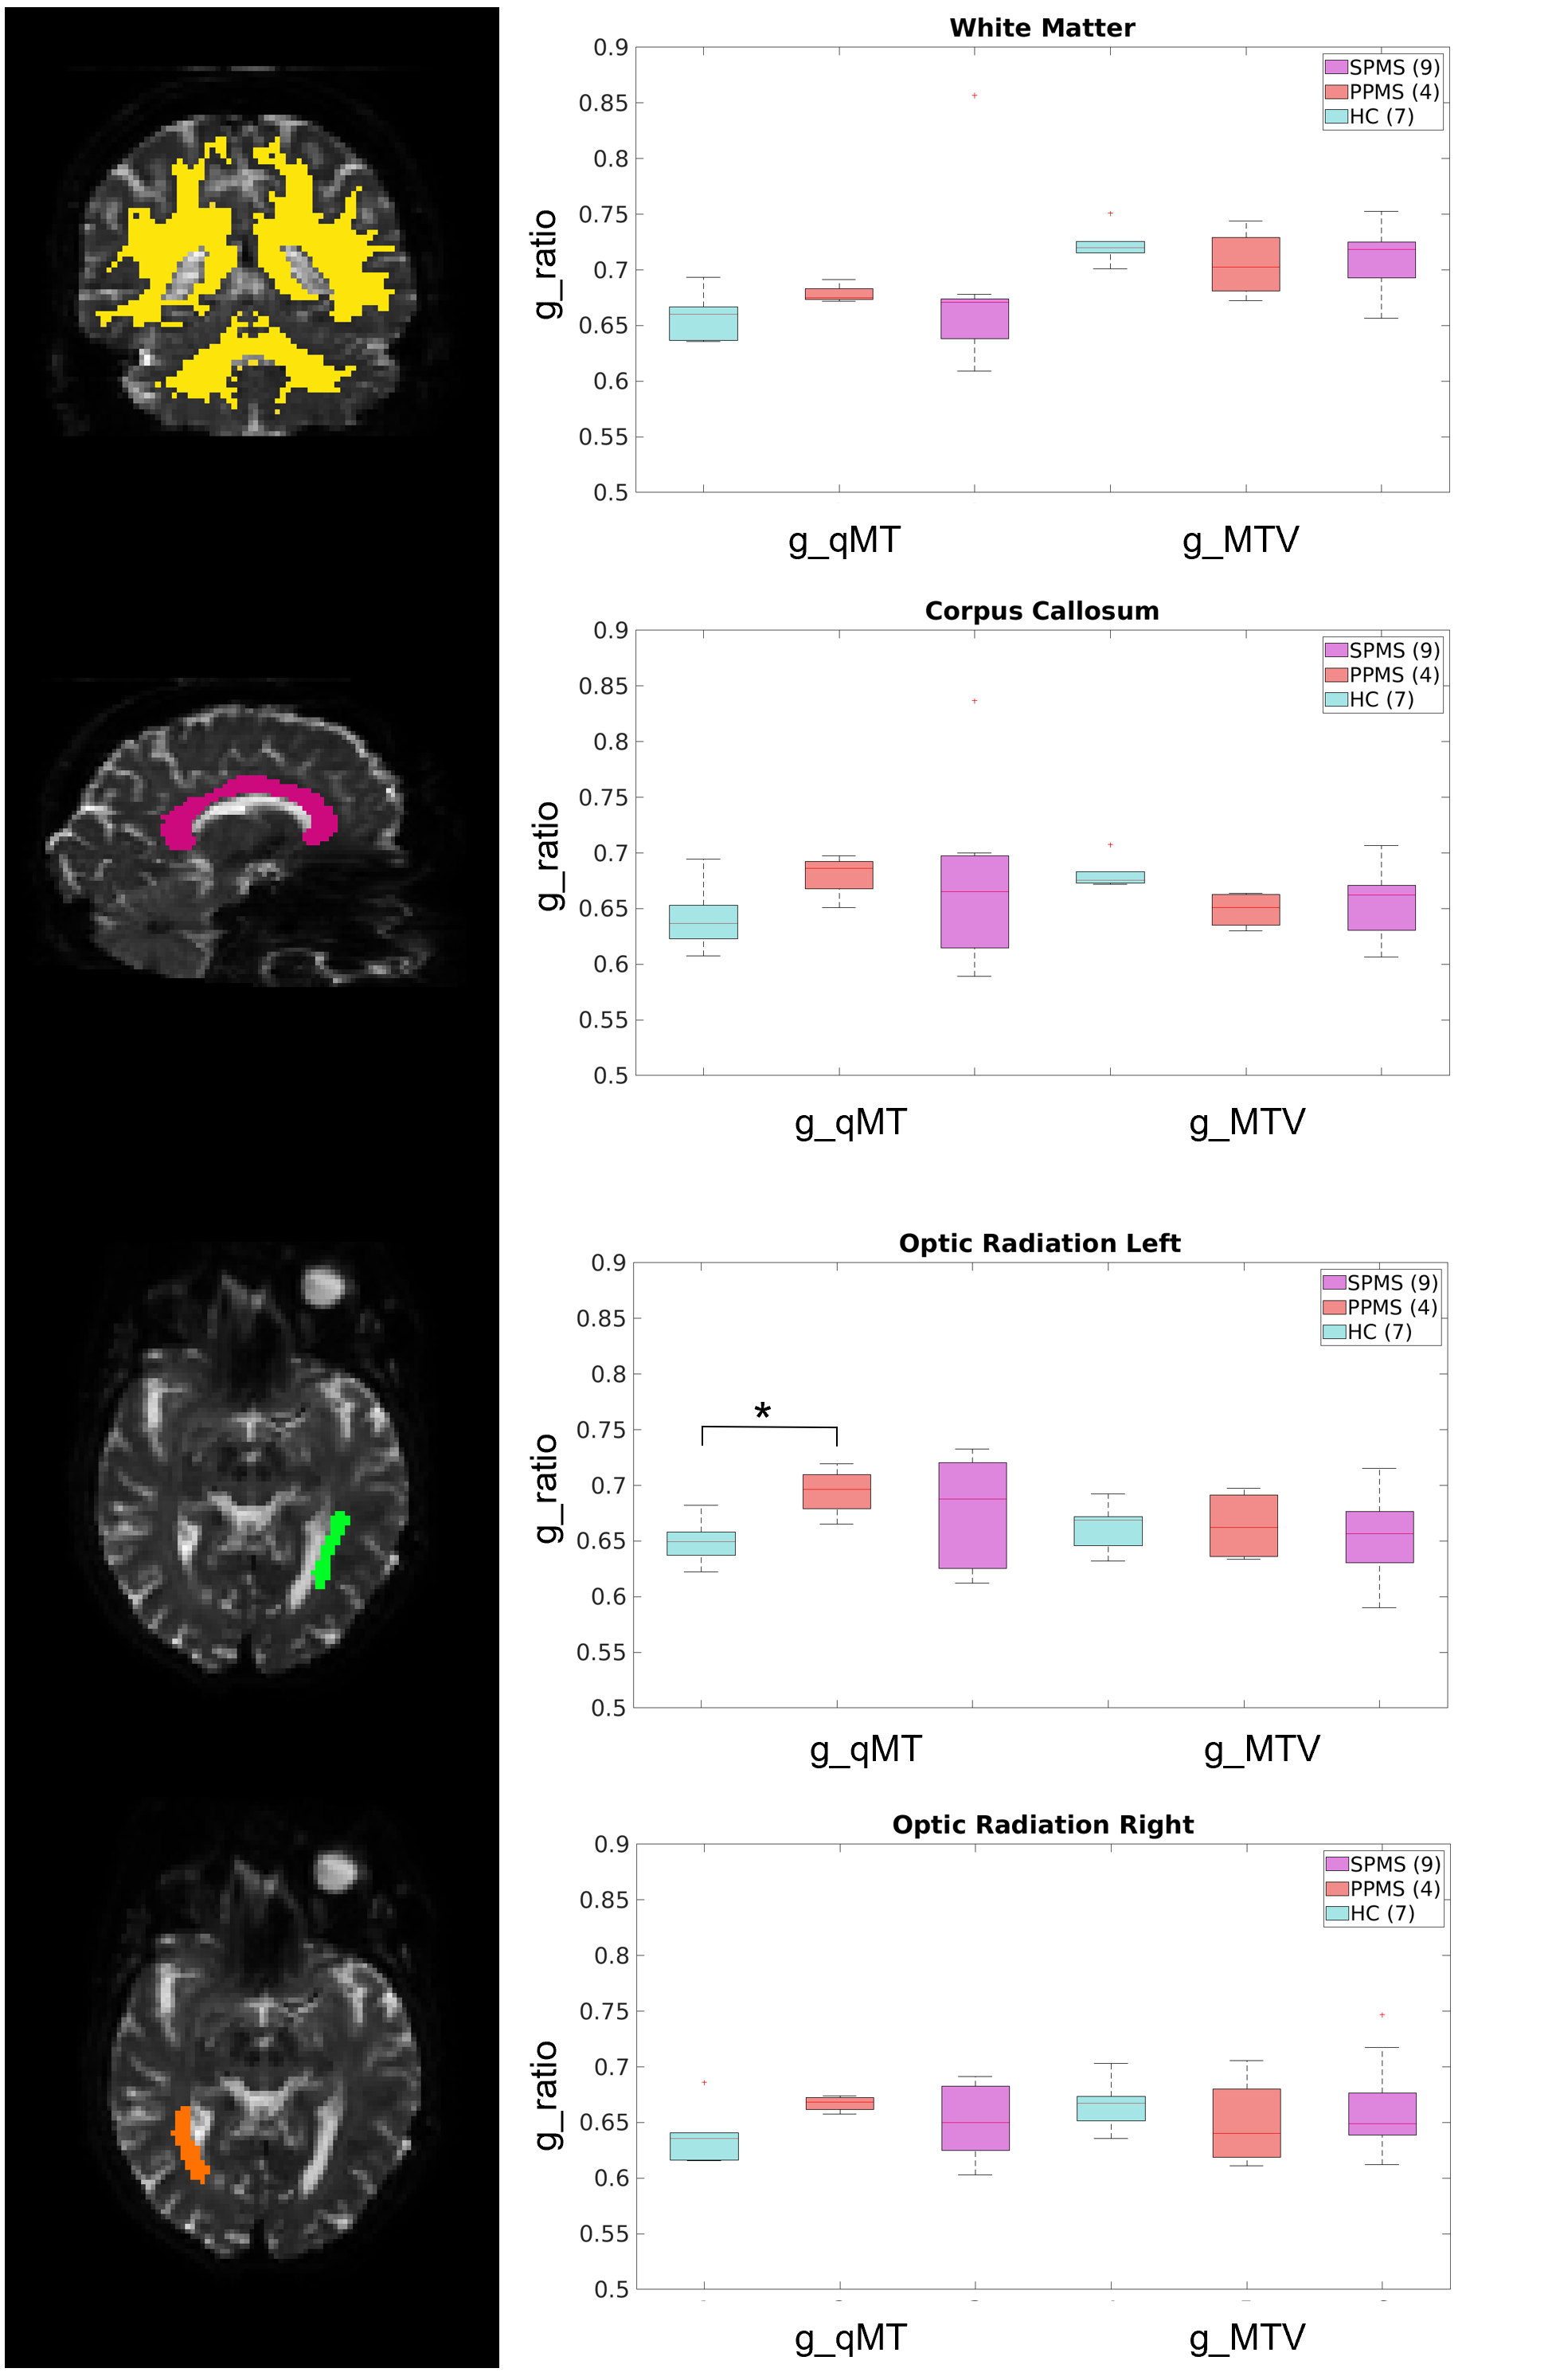
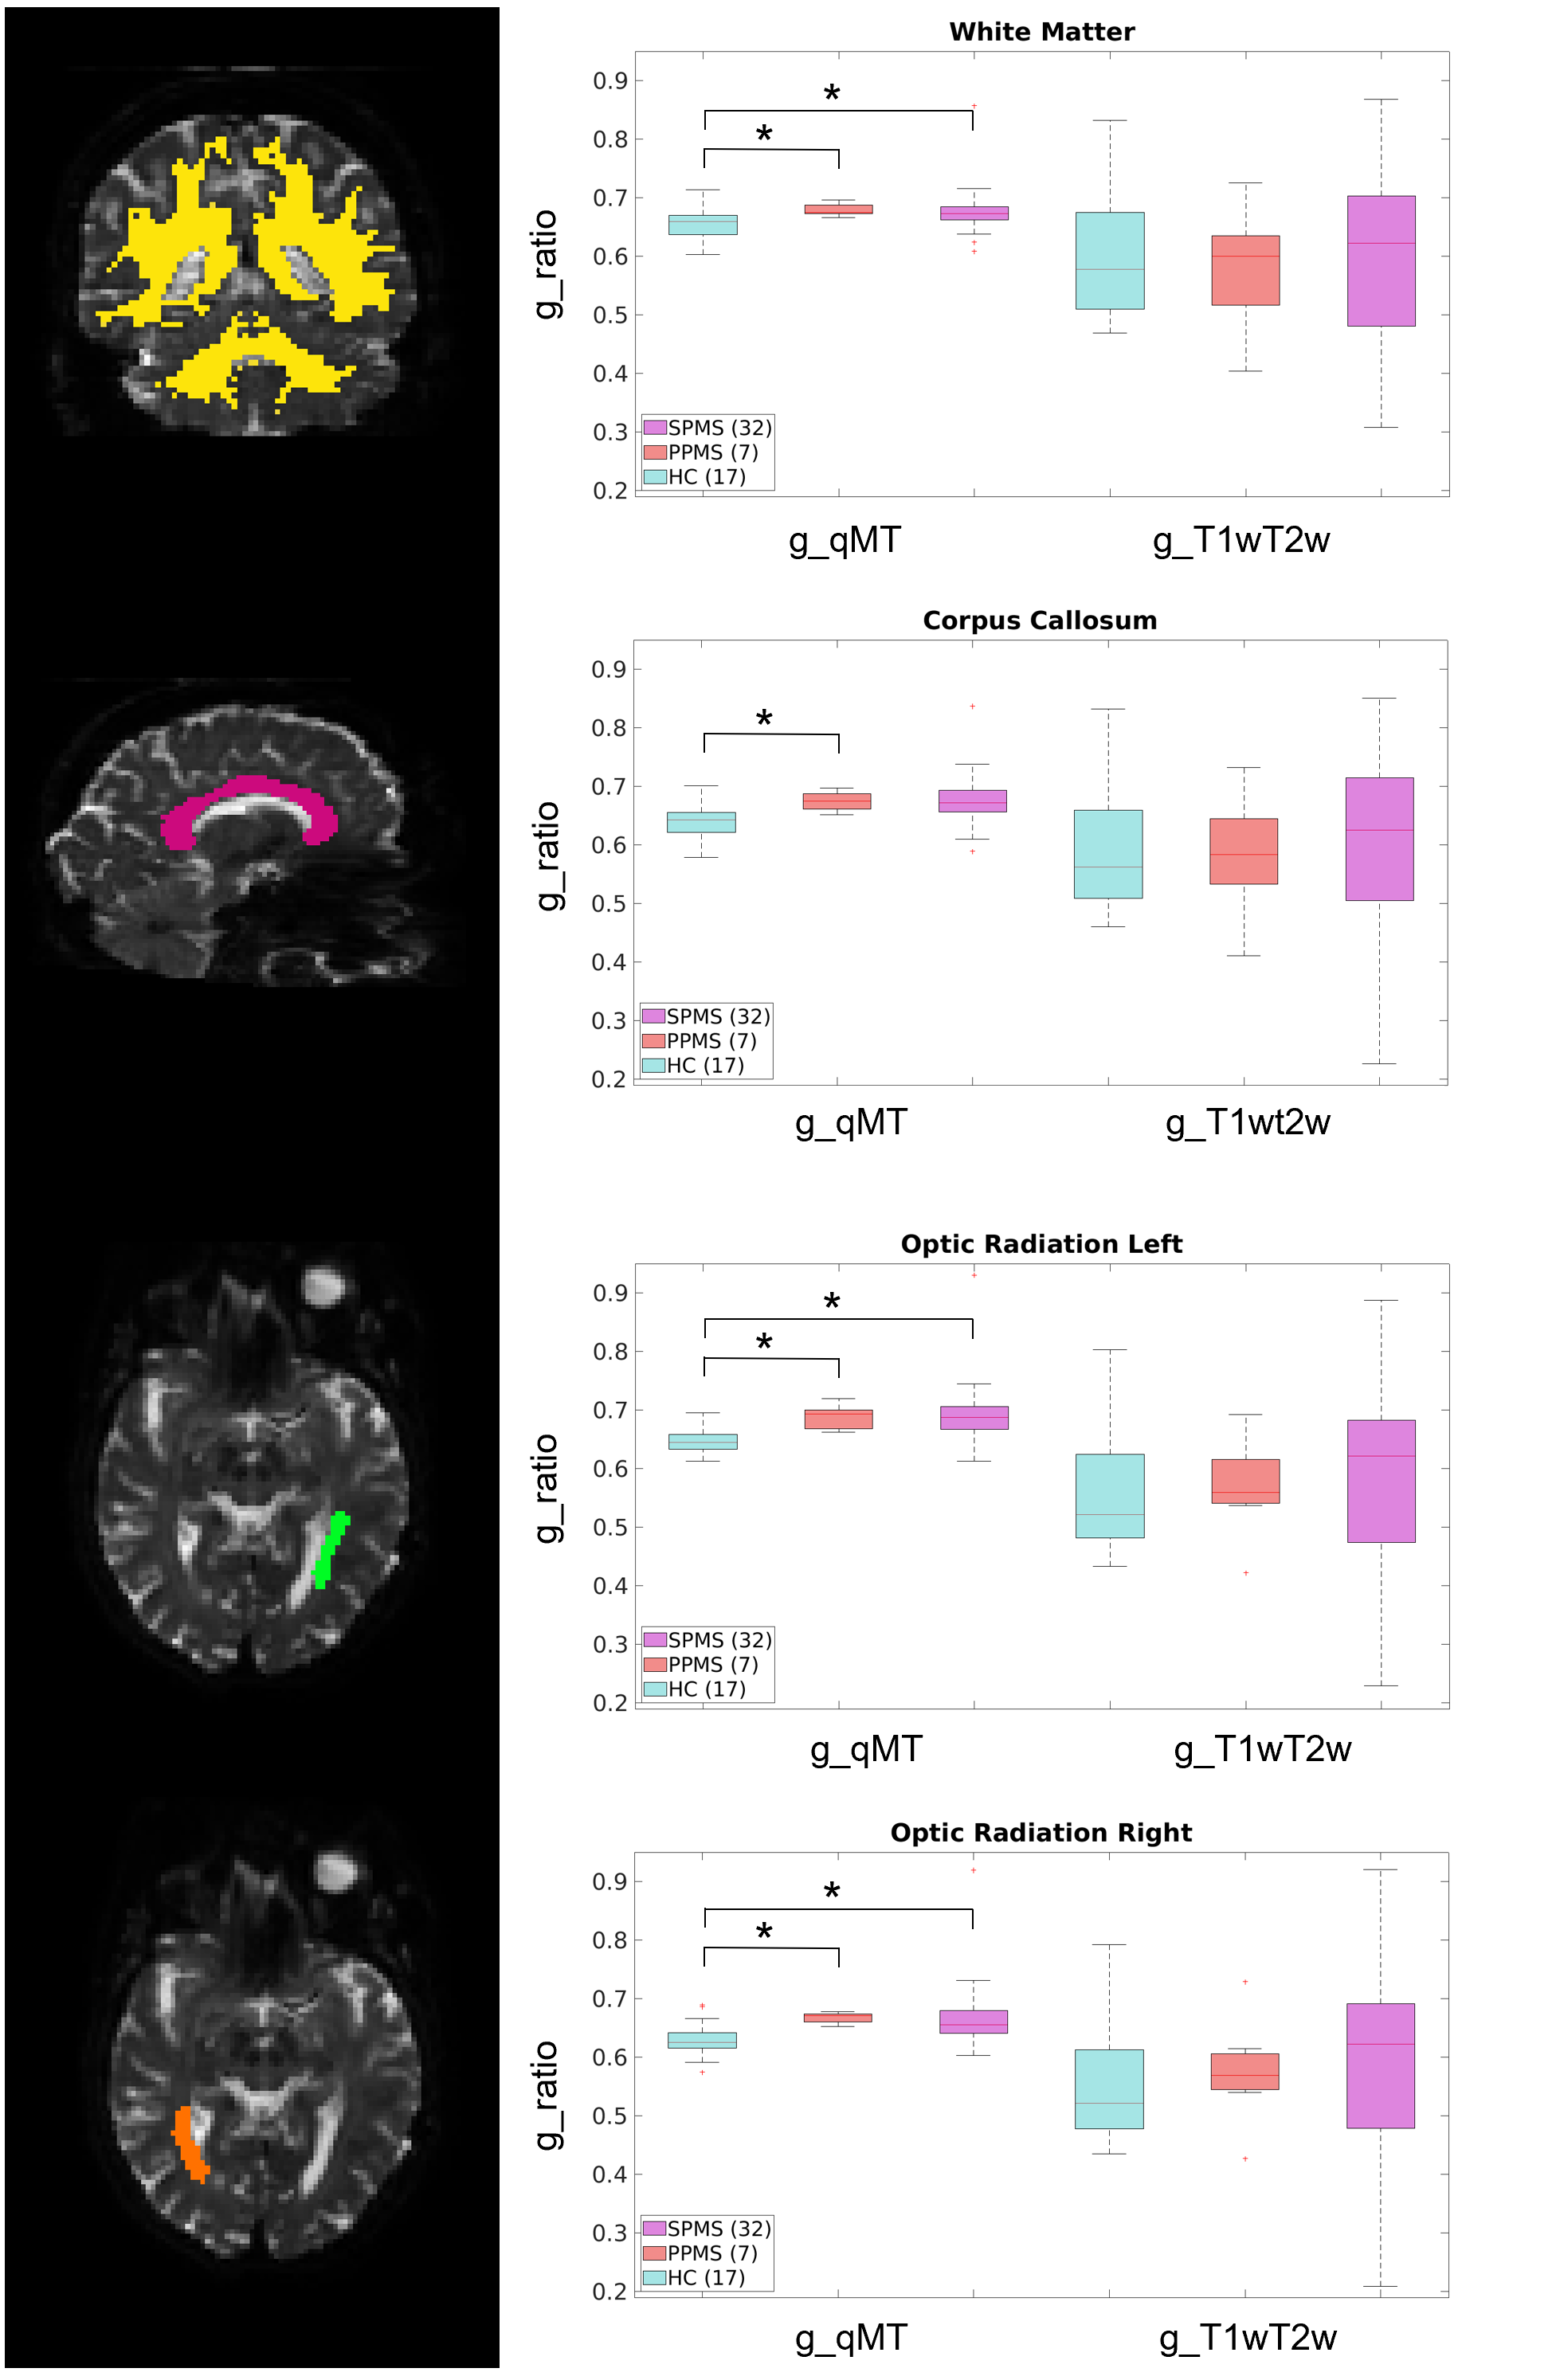
Capacity to discriminate pathology: The g-ratio distribution was evaluated between groups, i.e. HC, PPMS and SPMS, comparing g_T1wT2w and g_MTV with respect to g_qMT. The mean values of the following regions were used for comparison: white matter (WM), CC, left and right optic radiation (OR_L, OR_R).
Results
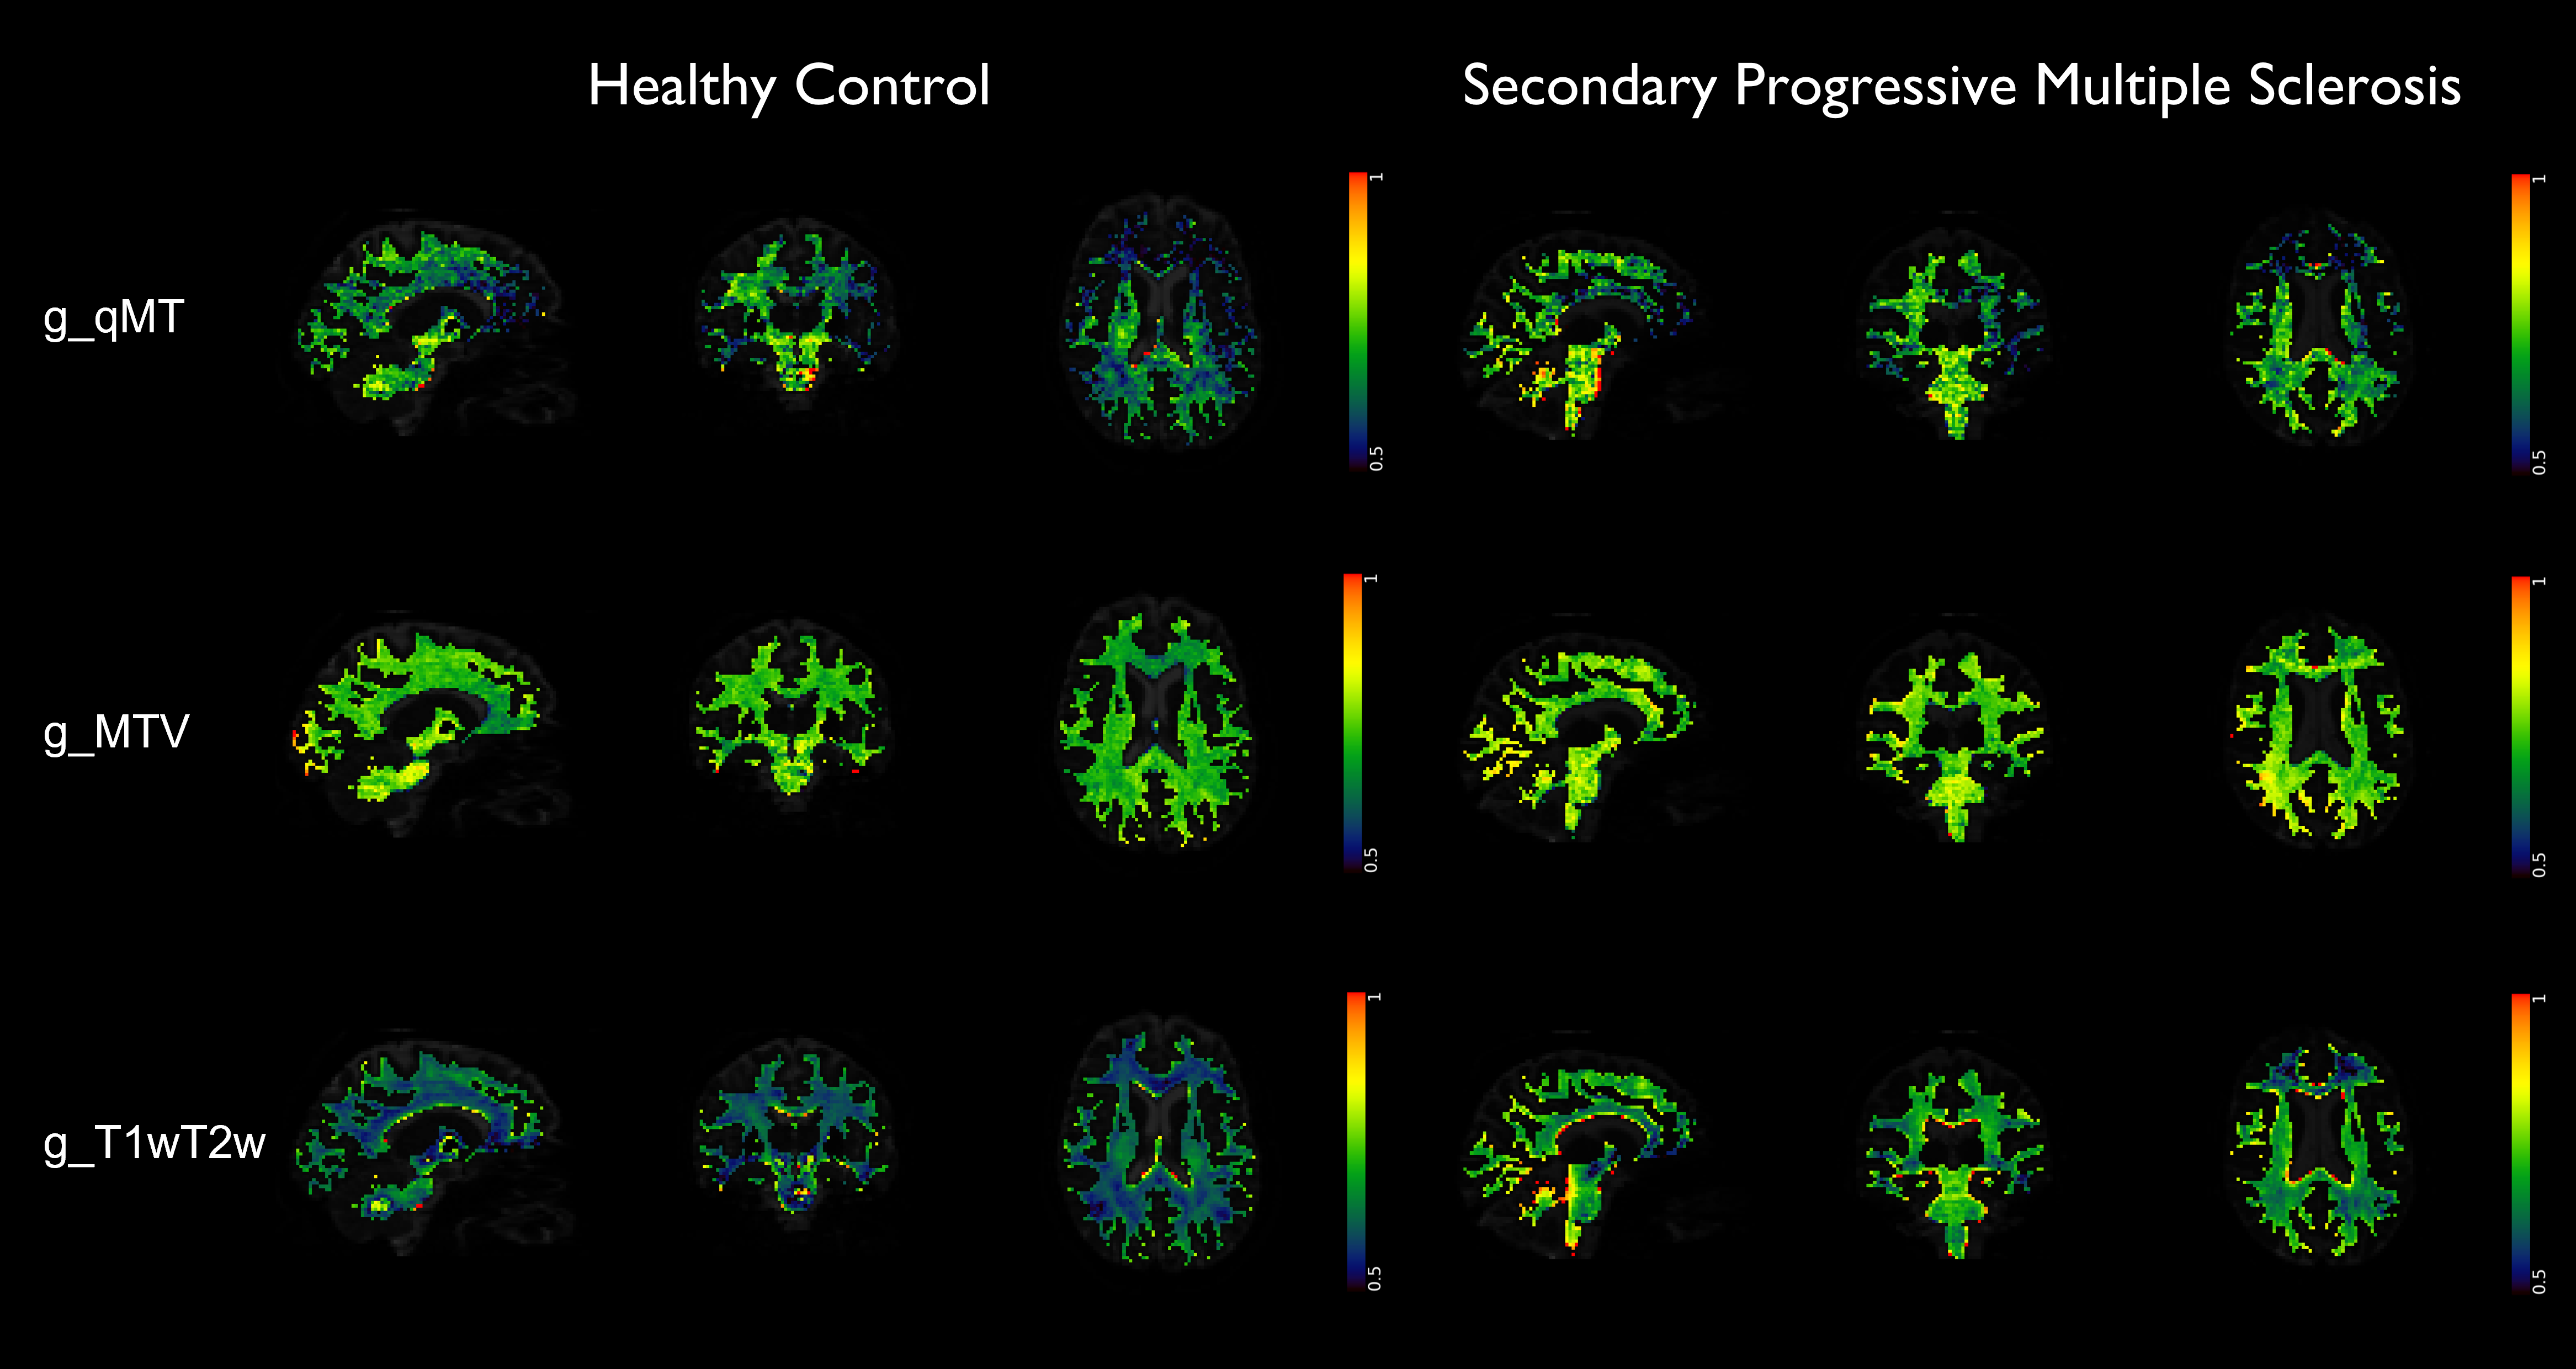
The calibration parameters were k=3.39 and α=1.07. The relationship between T1w/T2w and BPF was best fitted with a linear function (Figure 2). Figure 3 shows g-ratio maps obtained in WM for the three methods in a HC and an MS patient.Mann-Whitney U-test showed that both g_MTV and g_T1wT2w were different from g_qMT (p<0.001). Figures 4-5 show boxplots of g-ratios in the groups.
Discussion and Conclusion
Here, we used the same approach for estimating k and α to obtain the g-ratio from qMT and MTV, respectively. In addition, we developed a method to calculate the g-ratio from T1w/T2w images. A quantitative analysis showed that both g_MTV and g_T1wT2w were statistically different from the gold standard (g_qMT). Moreover, g_qMT showed significant differences between HC and MS patients, not replicated when using g_MTV and g_T1wT2w. Visually, the values obtained from g_MTV are flattening the differences between groups (Figure 4); moreover, g_MTV calculated in the CC showed a higher value in HC than in MS (lower myelin content), which needs further investigation as it may be due to the low number of subjects per group. g_T1wT2w maintained the trend of the medians between groups, following g_qMT, even though the ranges of g_T1wT2w assumed much larger values (Figure 5). One limitation of the g_T1wT2w is the use of sub-optimal T2w data. Interestingly, group differences were significant for all regions only using g_qMT in the larger group. Future work will investigate the differences in the g-ratio maps obtained with the three methods. Moreover, it will test whether high-resolution T1w/T2w data would help refining this promising method that could be widely used in clinics as T1w andT2w images are more standard acquisitions than qMT.Acknowledgements
Data were collected as part of a study funded by the MS Society grant #77 awarded to CWK and RS. RS has received research funding from the UK MS Society ( grant #77), CureDRPLA and Ataxia UK & we thank the UCL-UCLH Biomedical Research Centre for ongoing support. CGWK receives funding from Horizon2020 (Human Brain Project SGA3, Specific Grant Agreement No. 945539 ), BRC (#BRC704/CAP/CGW), MRC (#MR/S026088/1), Ataxia UK, MS Society (#77), Wings for Life (#169111). CGWK is a shareholder in Queen Square Analytics Ltd. C. Tur is currently being funded by a Junior Leader La Caixa Fellowship (fellowship code is LCF/BQ/PI20/11760008), awarded by “la Caixa” Foundation (ID 100010434). She has also received the 2021 Merck’s Award for the Investigation in MS, awarded by Fundación Merck Salud (Spain) and a grant awarded by the Instituto de Salud Carlos III (ISCIII), Ministerio de Ciencia e Innovación de España (PI21/01860). In 2015, she received an ECTRIMS Post-doctoral Research Fellowship and has received funding from the UK MS Society. She is a member of the Editorial Board of Neurology. She has also received honoraria from Roche and Novartis and is a steering committee member of the O’HAND trial and of the Consensus group on Follow-on DMTs. ED and FP receive funding from H2020 Research and Innovation Action Grants Human Brain Project (#785907, SGA2 and #945539, SGA3). ED receives funding from the MNL Project “Local Neuronal Microcircuits” of the Centro Fermi (Rome, Italy). FP and AR receive funding from Horizon2020 (#634541). FG receives the support of a fellowship from ”la Caixa” Foundation (ID 100010434). The fellowship code is “LCF/BQ/PR22/11920010”. AC is supported by the ECTRIMS post-doc fellowship (2022), previously received a UK MS Society PhD studentship (2020), a Guarantors of Brain “Entry” clinical fellowship (2019), and an ECTRIMS-MAGNIMS fellowship (2018).References
1. Dobson, R. & Giovannoni, G. Multiple sclerosis – a review. Eur. J. Neurol. 26, 27–40 (2019).
2. Milo, R. & Kahana, E. Multiple sclerosis: Geoepidemiology, genetics and the environment. Autoimmun. Rev. 9, A387–A394 (2010).
3. Zhang, H., Schneider, T., Wheeler-Kingshott, C. A. & Alexander, D. C. NODDI: Practical in vivo neurite orientation dispersion and density imaging of the human brain. Neuroimage 61, 1000–1016 (2012).
4. Gochberg, D. F. & Gore, J. C. Quantitative Magnetization Transfer Imaging via Selective Inversion Recovery With Short Repetition Times. Magn Reson Med 57, 437–441 (2007).
5. Mezer, A. et al. Quantifying the local tissue volume and composition in individual brains with MRI. Nat Med 19, 1667–1672 (2013).
6. Ganzetti, M., Wenderoth, N. & Mantini, D. Whole brain myelin mapping using T1- and T2-weighted MR imaging data. Front. Hum. Neurosci. 8, 1–14 (2014).
7. Battiston, M. et al. Fast bound pool fraction mapping via steady-state magnetization transfer saturation using single-shot EPI. Magn. Reson. Med. 82, 1025–1040 (2019).
8. Grussu, F. et al. Multi-parametric quantitative in vivo spinal cord MRI with unified signal readout and image denoising. Neuroimage 217, 116884 (2020).
9. Stikov, N. et al. In vivo histology of the myelin g-ratio with magnetic resonance imaging. Neuroimage 118, 397–405 (2015).
10. Mohammadi, S. & Callaghan, M. F. Towards in vivo g-ratio mapping using MRI: Unifying myelin and diffusion imaging. J. Neurosci. Methods 348, 108990 (2021).
11. Cercignani, M. et al. Characterizing axonal myelination within the healthy population: a tract-by-tract mapping of effects of age and gender on the fiber g-ratio. Neurobiol. Aging 49, 109–118 (2017).
12. Ellerbrock, I. & Mohammadi, S. Four in vivo g-ratio-weighted imaging methods: Comparability and repeatability at the group level. Hum. Brain Mapp. 39, 24–41 (2018).
13. Ganzetti, M., Wenderoth, N. & Mantini, D. Mapping pathological changes in brain structure by combining T1- and T2-weighted MR imaging data. Neuroradiology 57, 917–928 (2015).
Figures