2801
Comparison of machine learning models for discriminating obsessive-compulsive disorder based on automated fiber quantification1Huaxi MR Research Center(HMRRC), Department of Radiology, West China Hospital of Sichuan University, Chengdu, China, 2State Key Laboratory of Cognitive Neuroscience and Learning, Beijing Normal University, Beijing, China, 3Mental Health Center, West China Hospital of Sichuan University, Chengdu, China
Synopsis
Keywords: White Matter, Diffusion Tensor Imaging
In this study, we compared the classification performance of different machine learning models for discriminating OCD patients based on DTI tractography. Firstly, we extracted DTI metrics and tract volumes as features. Following feature selection, four machine learning models were performed for classification. Finally, a novel SHapley Additive exPlanations (SHAP) analysis was used to intepret the value of importance for each feature. We found that XGBoost exhibited the best classification performance among the four models. The model explanation by SHAP suggested that the volume of callosal orbital frontal tract was the most important factor in differentiating OCD from healthy controls.Introduction
Obsessive-compulsive disorder (OCD) is a common psychiatry characterized by repetitive thinking or behavior, evidence from diffusion tensor imaging (DTI) studies have demonstrated the abnormalities of white matter microstructures in OCD1,2. Machine learning models based on the DTI features could be used to classify OCD from healthy controls (HC) with a reasonable accuracy ranging from 75% to 84% according to the models applied3,4. Rapid progress in machine learning methods provides a potential opportunity to help advance accurate diagnosis of OCD for psychiatrists5. In the current study, we aim to compare the performance of different discrimination models based on DTI tractography in a large sample of OCD and HC samples. Furthermore, we applied SHapley Additive exPlanations (SHAP) analysis6, a game theory-based framework, to estimate the value of importance for each feature in the model and thus increase the model interpretability.Methods
A total of 71 DSM-IV criteria diagnosed drug naïve OCD patients and 81 age- and sex-matched HC were recruited in this study. All patients were scanned using 3-Tesla GE magnetic resonance imaging (MRI) to acquire with 16 diffusion-encoding gradient directions at b=1000s/mm2. The diffusion images were preprocessed using the FMRIB Software Library(FSL) 6.0. Then we performed AFQ (automated fiber quantification, version 1.2) analysis based on deterministic tractography. DTI metrics (FA, MD, AD, RD) and tract volume of 28 fibers7 were extracted to add up as 140 features to put in the model. Four machine learning algorithms, including XGBoost, SVM, Decision Tree Classifier (DTC) and AdaBoost were applied with 5 fold cross-validation. SHAP was utilized to explore the interpretability of the models (Figure 1).Results
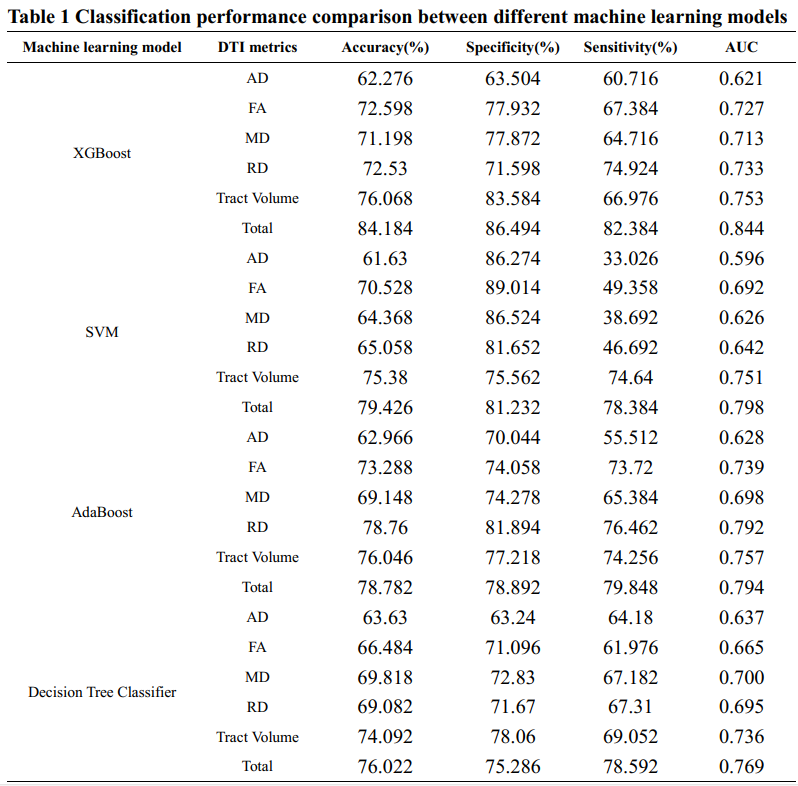
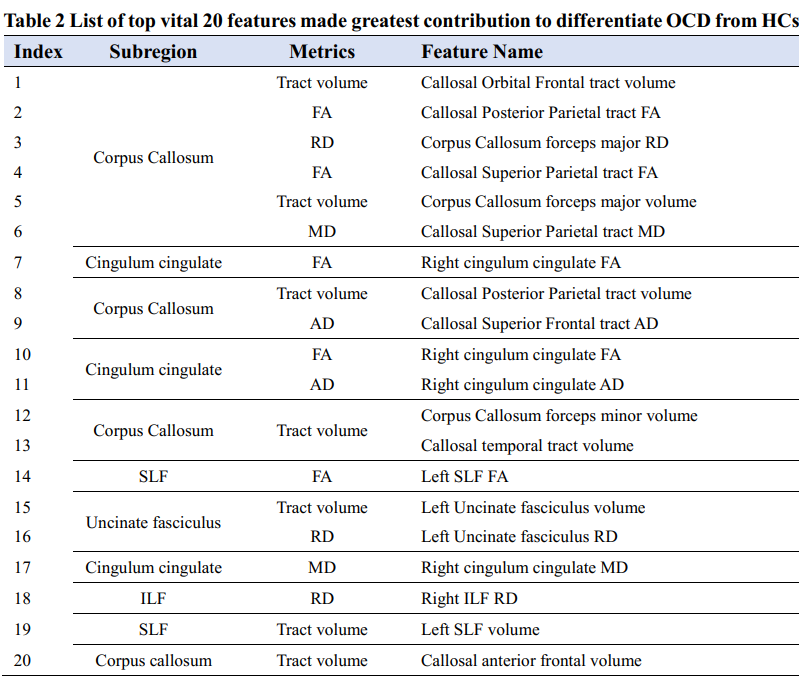
Among four models, the XGBoost model achieved the highest accuracy with an area under the curve (AUC), accuracy, sensitivity, and specificity of 0.844, 84.18%, 86.49%, 82.38%, respectively (Table 1). SHAP model further suggested that corpus callosum related DTI measurements made greatest contribution. Especially, tract volume of callosal orbital frontal fiber, FA of callosal posterior parietal fiber and RD of corpus callosum forceps major were the top three contribution factors (Details in Figure 3 and Table 2).Discussion and Conclusion
In terms of classification performance for discriminating OCD and HC, we found the XGBoost provided the best accuracy of 84.18% among the four models, which is comparable to previous studies using SVM3,4. Moreover, we applied the novel SHAP model to reveal that the volume of the callosal orbital frontal tract was the most important factor in differentiating OCD from HCs, followed by the FA of colossal posterior parietal tract and RD of corpus callosum forceps major. In current study, we offered an innovative classification framework based on the white matter microstructural features. By linking the XGBoot and SHAP model, we could understand and interpret the contribution of DTI features on discriminating OCD from HC on individual-level.Acknowledgements
This study was supported by grants from 1.3.5 Project for Disciplines of Excellence, West China Hospital, Sichuan University (grand number ZYJC21041) and Clinical and Translational Research Fund of Chinese Academy of Medical Sciences (grand number 2021-I2M-C&T- B-097).References
1. Piras et al. White matter microstructure and its relation to clinical features of obsessive-compulsive disorder: findings from the ENIGMA OCD Working Group. Translational Psychiatry 2021.
2. Bu et al. The structural connectome in ADHD, Psychoradiology 2021.
3. Li et al. Multivariate Pattern Analysis of DTI reveals differential white matter in individuals with obsessive-compulsive disorder. Human Brain Mapping 2014.
4. Zhou et al. Support Vector Machine Classification of Obsessive-Compulsive Disorder Based on whole-brain volumetry and diffusion tensor imaging. Frontiers in Psychiatry.2018.
5. Link et al. Predicting the feature of neuroimaging predictive models in mental health. Molecular Psychiatry 2022.
6. Lindberg SM, et al. A unified approach to interpreting model predictions. Proceedings of the 31st international conference on neural information processing systems. Long Beach, CA: Neural Information Processing Systems Foundation, Inc. (NIPS) 2017. P. 4768-77.
7. Yeatman et al. Lifespan maturation and degeneration of human brain white matter. Nature Communication 2014.
Figures
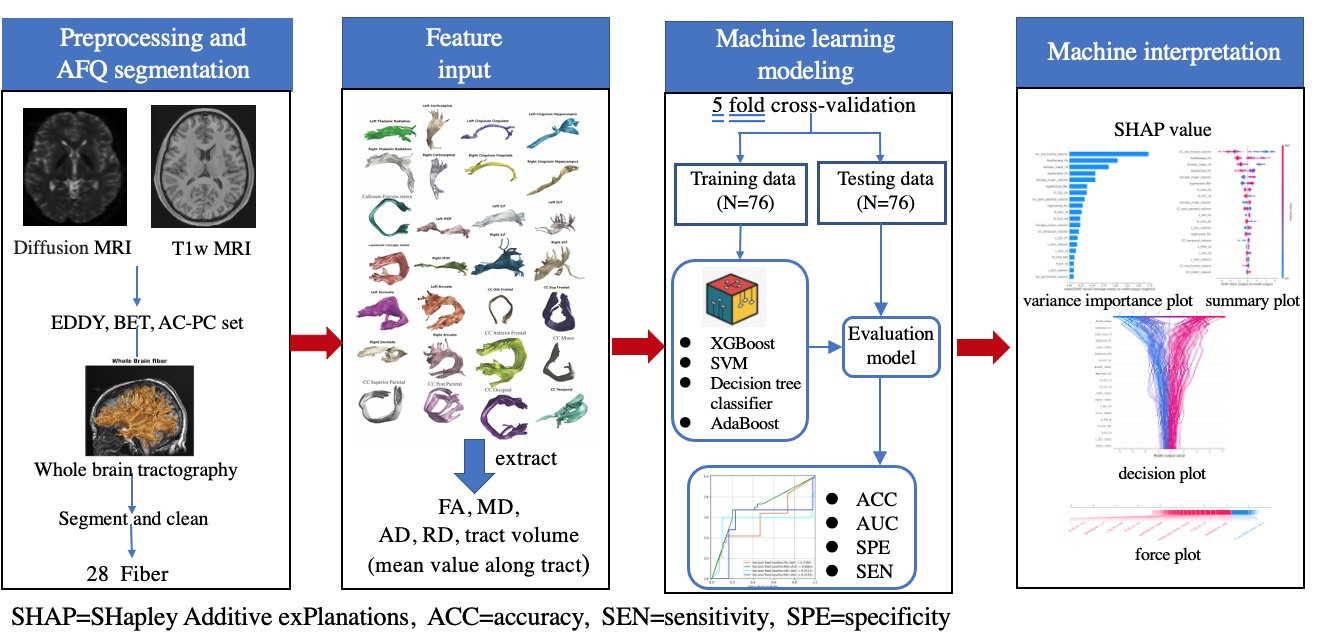
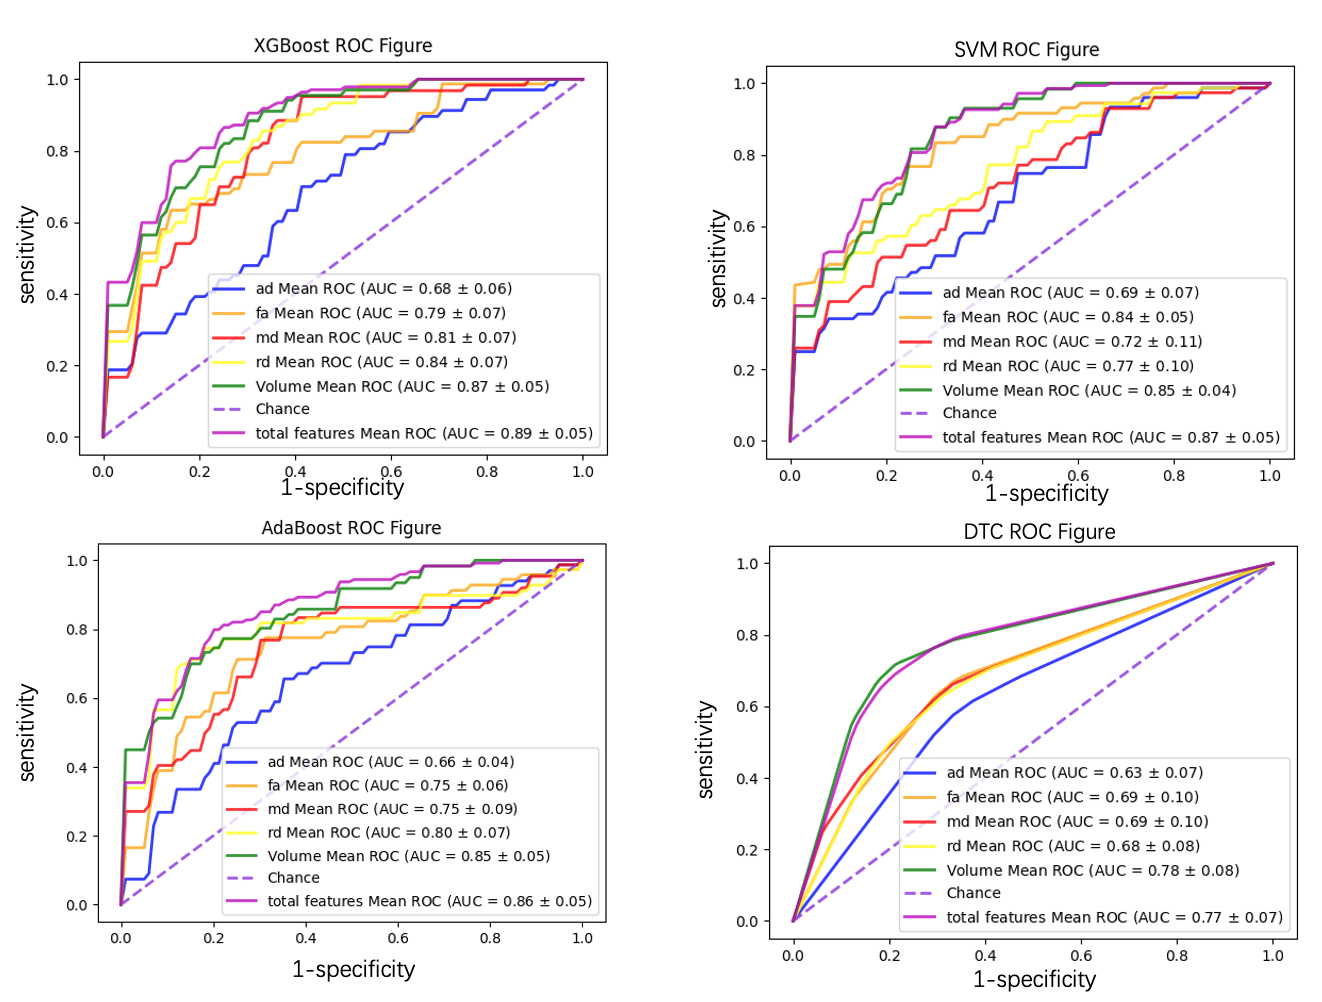
Figure 2. Receiver Operating Characteristics (ROC) curves assessing different classifiers using DTI metrics.
Abbreviation:AUC: area under the curve. FA: fractional anisotropy. MD: mean diffusivities. AD: axial diffusivities. RD: radial diffusivities. SVM: support vector machine. DTC: decision tree classifier.
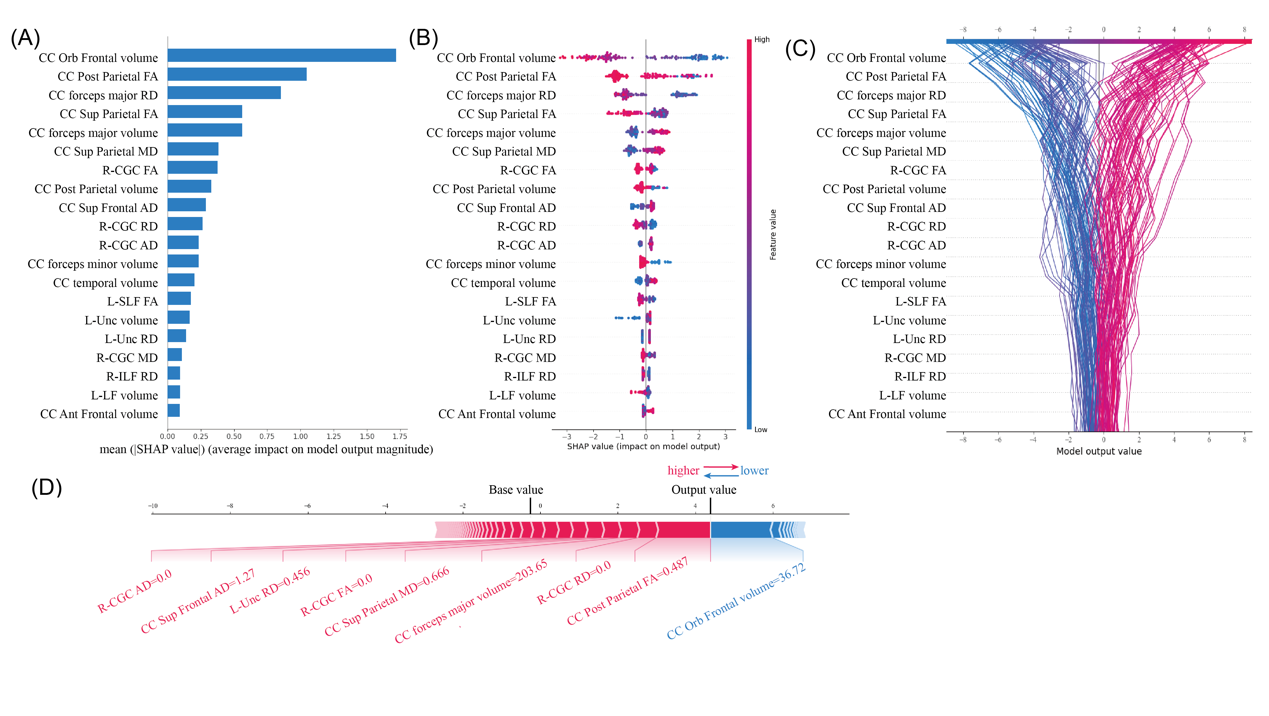
Figure 3. Model interpretability of the XGBoost model for the diagnosis of OCD with SHAP. (A). Variance importance plot listing the most significant variables in descending order. (B). Summary plot of feature impact of the decision of the discrimination model and interaction between input features in the XGBoost model. (C). Decision plot showing how the discrimination model predicts OCD when SHAP values for each feature are added to the model’s base value from the bottom of the plot to the top. (D). Force plot of one single OCD data from the test group showing local interpretability.