2800
Macromolecular proton fraction as a biomarker of early myelination: ultrastructural and immunochemical validation in a rabbit model
Alexander Drobyshevsky1, Daniil Aksenov1, and Vasiliy Yarnykh2
1NorthShore University HealthSystems, Evanston, IL, United States, 2Radiology, University of Washington, Seattle, WA, United States
1NorthShore University HealthSystems, Evanston, IL, United States, 2Radiology, University of Washington, Seattle, WA, United States
Synopsis
Keywords: White Matter, Quantitative Imaging, myelin
Ultrastructural and immunochemical methods of myelin quantification were applied to validate a model-based MRI techniques, macromolecular proton fraction mapping (MPF), during early development in major white matter tracts and cerebral cortex in rabbits. MPF trajectories were in general agreement with levels of myelination by histology and accurately reflected differential rate of development between white matter tracts and cortical regions.Introduction:
While the metrics derived from relaxometry and diffusion
tensor imaging, are sensitive to early myelination in white matter and cortex, they
are not specific and may be affected by other developmental changes in brain tissue.
The advent of advanced model-based microstructural metrics requires
histological validation. The purpose of the study was to validate a novel,
model-based MRI techniques, such as macromolecular proton fraction mapping (MPF)
against histologically derived indexes of myelination and microstructural maturation
at various stages of development.
Methods: New Zealand White rabbit kits underwent serial in-vivo MRI examination on postnatal days 1, 5, 11, 18, and 25, and as adults. Macromolecular proton fraction (MPF) maps were obtained from three sources (MT-, PD-, and T1-weighted) images (1). After MRI sessions, a subset of animals was euthanized and regional samples of gray and white matter were taken for western blot analysis, to determine myelin basic protein (MBP), and electron microscopy, to estimate myelin volume fraction. Developmental changes in MRI and histology were fitted with logarithmic growth curves.
Results: MPF of white matter regions showed a period of fast growth between P5 and P11 in the internal capsule, with a later onset in the corpus callosum. This MPF trajectory was in agreement with levels of myelination in the corresponding brain region, as assessed by western blot and electron microscopy. In the cortex, the greatest increase of MPF occurred between P18 and P26. In contrast, myelin, according to MBP western blot, saw the largest hike between P5 and P11 in the sensorimotor cortex and between P11 and P18 in the frontal cortex, which then seemingly plateaued after P11 and P18 respectively. Developmental trajectories of early myelination by histological methods and MPF faithfully reflected accelerated development in motor vs commissural fibers and somatosensory cortex vs. prefrontal cortex
Conclusion: Developmental trajectories of MPF accurately reflected regional differences in myelination rate in different cortical regions and white matter tracts. The differences in timing between developmental trajectories may reflex different sensitivities of the myelin measurement techniques.
Acknowledgements
This study was funded by NIH grants R01 NS091278-01A1, 1R01NS119251-01A1, R21 NS109838-01. Dr. Yarnykh received partial support from the NIH grant R21NS109727. Software for MPF map reconstruction was distributed under support of the NIH grant R24NS104098.References
1. Yarnykh VL. Time-efficient, high-resolution, whole brain three-dimensional macromolecular proton fraction mapping. Magn Reson Med May 2016;75(5):2100-6. https://doi.org10.1002/mrm.25811.Figures
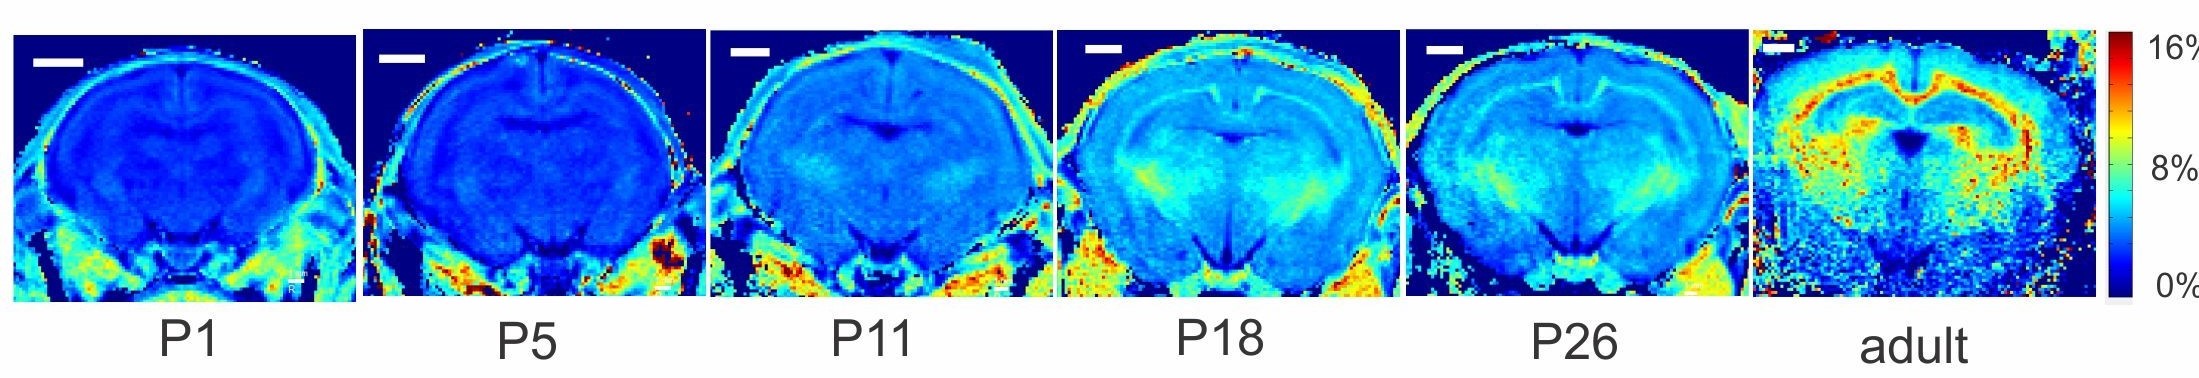
Figure 1. Parametric maps of macromolecular proton fraction (expressed
in %) across postnatal development in rabbits from P1 to adulthood. Scale bar
in bottom row is 3 mm.

Figure 2. Scatter
plots of MPF and MBP western blot values and logistic fit curves in selected
white matter and gray matter regions vs. postnatal age. Whiter matter was
sampled in internal capsule (IC) at the level of anterior thalamus and in
corpus callosum splenium (CC). Gray matter was sampled in sensory-motor cortex
(mCx) and prefrontal cortex (pCx).
DOI: https://doi.org/10.58530/2023/2800