2796
Fast T1 mapping of whole brain using Multiplied Added Subtracted Divided Inversion Recovery (MASDIR)
Letizia Losa1, Denis Peruzzo1, Graeme Bydder2, and Nivedita Agarwal3
1CESNE, IRCCS E. Medea, Bosisio Parini, Italy, 2Department of Radiology, University of California, San Diego, San Diego, CA, United States, 3Neuroradiology, IRCCS E. Medea, Bosisio Parini, Italy
1CESNE, IRCCS E. Medea, Bosisio Parini, Italy, 2Department of Radiology, University of California, San Diego, San Diego, CA, United States, 3Neuroradiology, IRCCS E. Medea, Bosisio Parini, Italy
Synopsis
Keywords: White Matter, Quantitative Imaging, T1 mapping
Whole brain T1 mapping has been performed using several different sequences but remains mostly confined to research applications. A clinically reliable and fast method to evaluate the white matter (WM) is important for accurate diagnosis, evaluating the severity of disease and monitoring disease progression over time. In this study we assessed Multiplied, Added, Subtracted and/or Divided Inversion Recovery (MASDIR) technique in nine healthy subjects and found evidence that such technique greatly improves the visualisation of tissue of interest and allows calculation of T1 values in a reliable, fast and clinically usable manner.Introduction
T1 is a basic tissue property that provides quantitative information about tissue biochemistry and microstructure, able to describe several pathological changes[1]. White matter hyperintensities (WMHs) represent a variety of pathophysiologic processes such as demyelination, axonal loss or increase in interstitial fluid, visualised as areas of increased signal intensity on both T2 weighted (T2w) and Fluid Attenuated Inversion Recovery (T2-FLAIR) images. WMHs are important biomarkers of small vessel disease (SVD) but unfortunately, their heterogeneity and dynamic nature is not easily discernible on conventional MR images. Also, subtle lesions in the so-called Normal Appearing White Matter (NAWM) are not yet readily visible due to lack of sufficient contrast[2]. Hence, a clinically reliable and fast method to evaluate the White Matter (WM) is important to make a more accurate diagnosis, evaluate the true extent of disease and monitor lesions over time. Our aim was to evaluate the feasibility and possibility of implementing Multiplied, Added, Subtracted and/or Divided Inversion Recovery (MASDIR) technique[3] to calculate T1 map and to enhance T1 contrast in the WM of the whole brain by using Fast Spin Echo - Inversion Recovery (IR-FSE) sequences readily available on all scanners.Methods
Data were acquired on 9 healthy subjects (from 26 to 59 yrs, 2M/7F) using a Philips 3T scanner and a 32 channel head coil. In addition to standard clinical acquisitions (3D T1w, 3D T2w, 3D FLAIR), six whole brain IR-FSE sequences (TR/TE=3500/10-200 ms; voxel size= 0.7x0.89 mm, slice thickness 5 mm) were acquired with increasing Inversion Times (TI= 350, 450, 550, 750, 950, 1200 ms). divided Substracted Inversion Recovery (dSIR: one of the MASDIR sequences) images were derived using the following equation: $$dSIR=\frac{IRTI_{short}-IRTI_{long}}{IRTI_{short}+IRTI_{long}}$$ where TIshort and TIlong are the two TIs that define the middle Domain (mD), i.e. the range of T1 values of interest ($$$TI_{short/long}=TI_{min/max}\cdot\ln(2)$$$) (Fig. 1). Since we focused on the WM tissue, we set the TIshort to suppress the WM and the TIlong to suppress the Grey Matter (GM). We also calculated a T1 map using dSIR (T1dSIR) by linearising the relationship between the dSIR signal (SdSIR) and T1 values within the mD: $$T1=\frac{TI_{long}-TI_{short}}{\ln(4)}\cdot S_{dSIR} + \frac{TI_{long}+TI_{short}}{\ln(4)}$$To validate T1 values obtained using dSIR, we compared them with T1 values obtained by signal regression from all IR-FSE images using Bloch equation (T1reg, gold standard). We further compared the T1 estimates in GM and WM regions derived using FreeSurfer and a JHU like atlas, respectively. We also show images of the normal brain and dSIR imaging in a patient with SVD.Results
Table 1 presents average T1 values of GM, WM and cerebrospinal fluid (CSF, divided into ventricular, CSFvent, and subarachnoid space, CSFsas) with respective nulling TI values. Fig. 1 compares conventional MR images with three IR-FSE images (TIs=450, 750, 950 ms). A higher contrast and lesion load is observed on dSIR maps with respect to T2-w and FLAIR images in SVD (Fig.2). T1map obtained from dSIR method correlated very well with T1 values obtained using T1reg (m=1.04;p-value<0.001 two-tailed t test) (Fig. 3). However, some brain regions segmented using FreeSurfer, that lie outside the chosen mD cannot be evaluated using dSIR methodology (mD: 450-750 ms corresponds to T1: 649-1082 ms) (Fig. 4).Discussion
The greatest strength of dSIR is to enhance contrast between structures characterised by small but different T1 values without complex post-processing. In addition, dSIR provided a highly reliable quantitative T1 estimate albeit restricted to brain areas that lie inside the mD. In our patient with SVD, dSIR greatly enhanced the qualitative visualisation of disease and detected more lesions with longer T1 in the NAWM. In addition, T1 quantification obtained is of significant value in monitoring the dynamic nature of such lesions. Such information can be key in characterising WMH. Quantification of T1 values is of added value when compared to several other T1 mapping methods described in literature, many of which are unavailable on most clinical scanners world-wide. The main limitation of this technique is that dSIR cannot evaluate tissues that lie outside the mD. However, the mD can be chosen to study brain areas of interest including the cortex as well as the CSF. Also, the nulling TIs used in adults may be different with respect to the developing brain and depend on the degree of myelin maturation.Conclusion
dSIR is a reliable method for obtaining very high lesion T1 contrast and can be directly applied in routine clinical practice to provide qualitative and quantitative T1 maps. It can also be useful in the study of neurofluids to analyse changes in ISF and protein content. Future studies require improved spatial resolution to allow evaluation of lesions that are of small dimensions.Acknowledgements
We thank John D. Port for interpretation of our images.References
[1] Deoni, Sean CL. "Quantitative relaxometry of the brain." Topics in magnetic resonance imaging 21.2 (2010): 101-113.
[2] Wardlaw, Joanna M., Maria C. Valdés Hernández, and Susana Muñoz‐Maniega. "What are white matter hyperintensities made of? Relevance to vascular cognitive impairment." Journal of the American Heart Association 4.6 (2015): e001140.
[3] Ma, Ya-Jun, et al. "Use of Multiplied, Added, Subtracted and/or FiTted Inversion Recovery (MASTIR) pulse sequences." Quantitative Imaging in Medicine and Surgery 10.6 (2020): 1334.
Figures
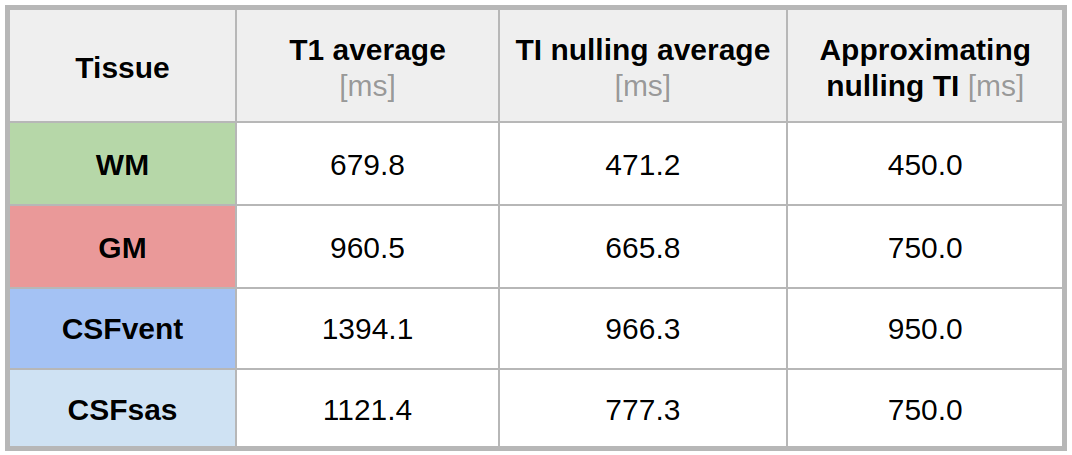
Table 1: Average T1 values of Gray Matter (GM), White Matter (WM) and cerebrospinal fluid (CSF, further divided into Ventricular, CSFvent, and subarachnoid space, CSFsas) and their respective nulling TI values obtained by T1reg method in controls. The third column shows the best approximated nulling TI values employed in our study.
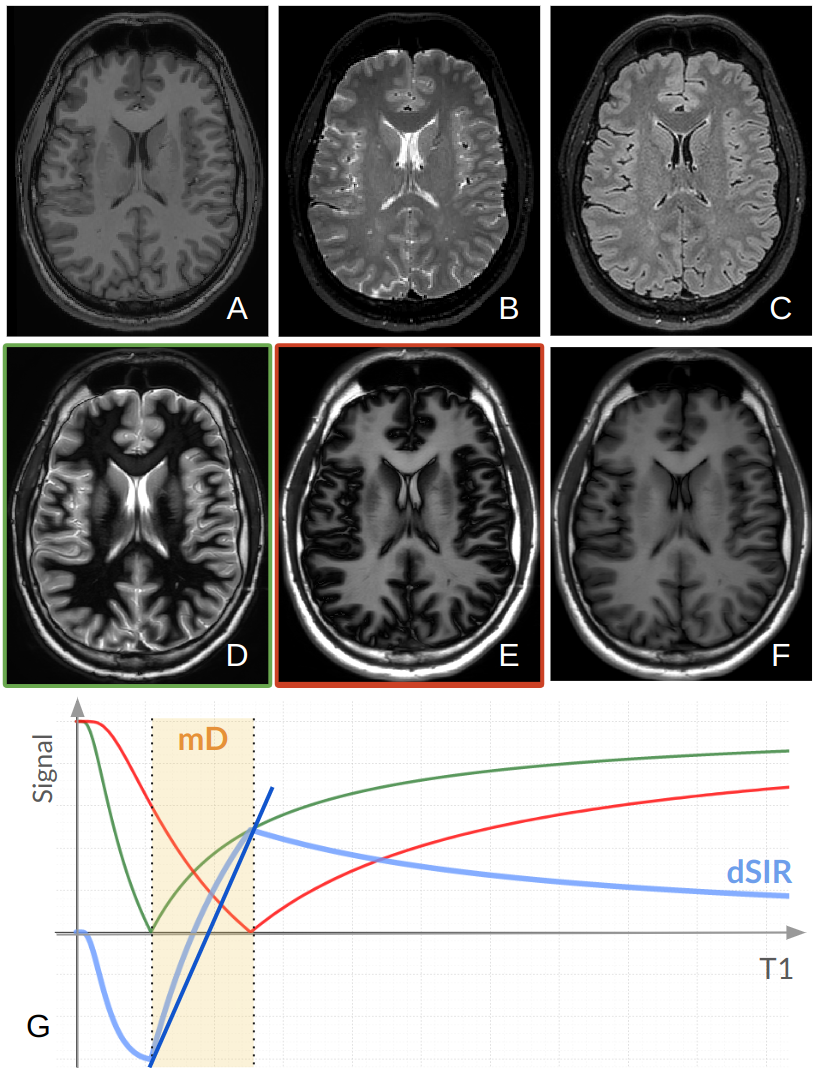
Figure 1: Comparison of conventional MR images with IR-FSE images obtained using different nulling TIs: A) T1w; B) T2w; C) FLAIR; D) TI=450 ms suppressing WM, E) TI=750 ms suppressing GM/CSFsas, F) TI=950 ms suppressing CSFvent with high approximation. G) The steep slope of dSIR (blue line) is obtained by subtracting TSE-IR TIshort (green) and TSE-IR TIlong (red) and then dividing by their sum. Within the mD, a small change of T1 produces a large change in signal contrast.
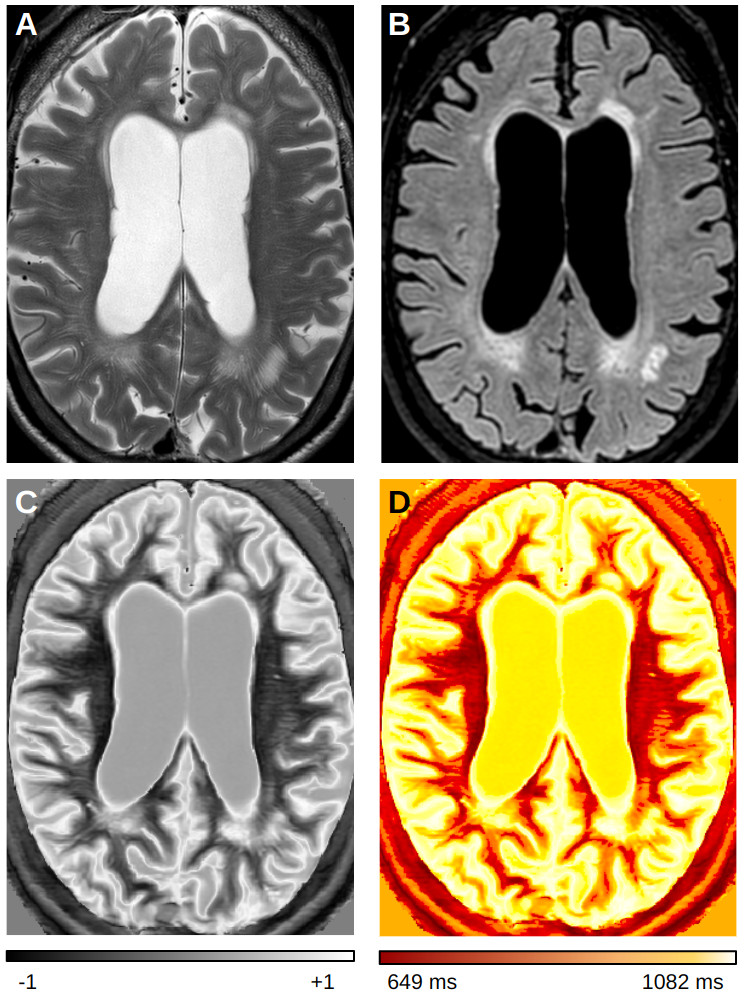
Figure 2: Patient with SVD: A) T2w; B) FLAIR; C) dSIR (mD:450ms-750ms); and D) T1 quantitative map obtained from T1dSIR method. On the dSIR image normal white matter is black (-1), while abnormal white matter is brighter with a higher T1 signal (up to +1). The dSIR image shows more disease than T2w and FLAIR images. Also, high contrast boundaries are observed between normal WM/GM, as well as between WM/CSF.
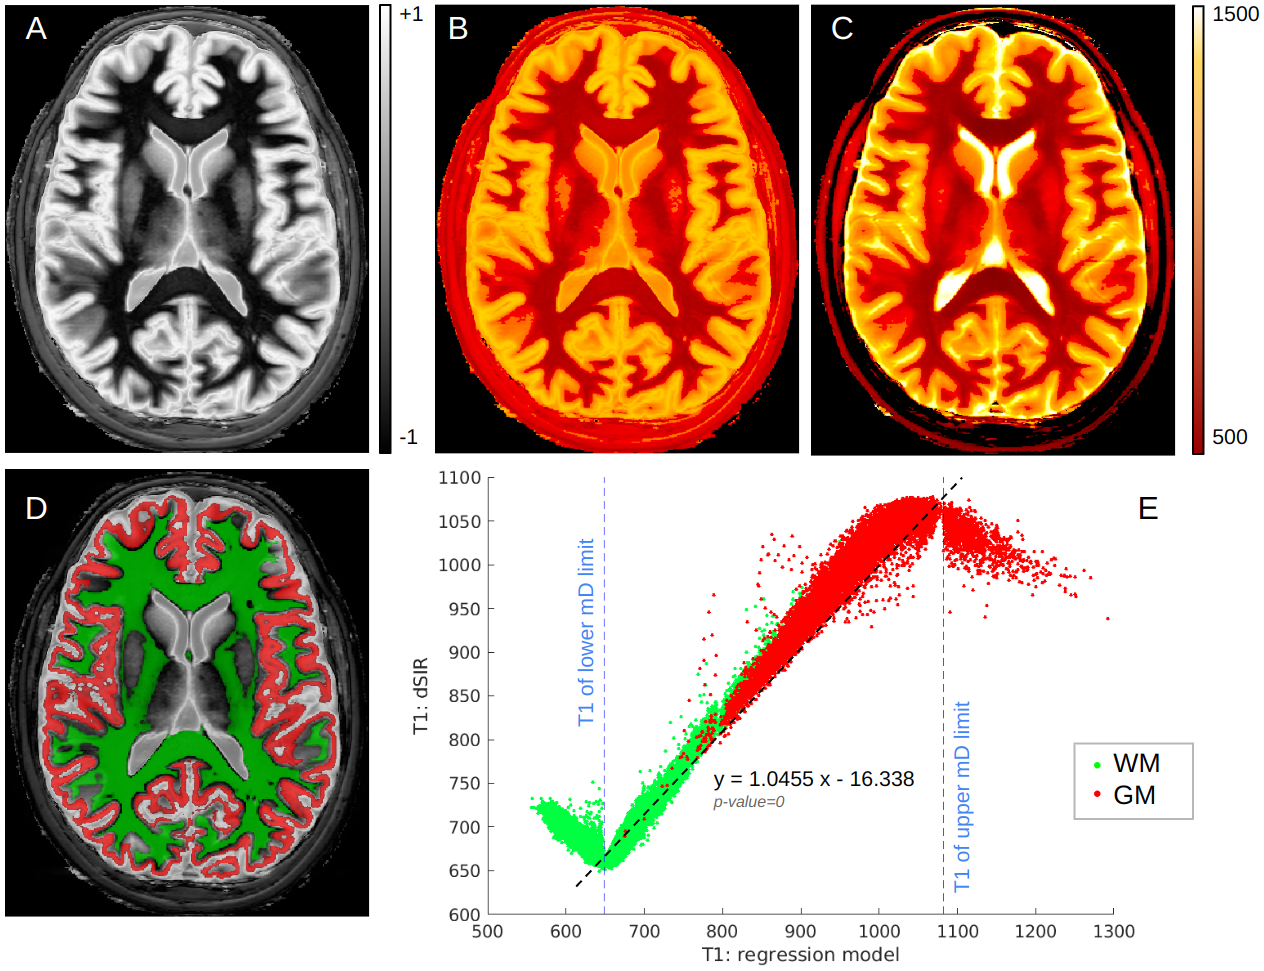
Figure 3: Comparison of T1 maps obtained with gold standard and dSIR methods: A) normal dSIR (mD: 450-750 ms); quantitative T1 maps obtained from B) T1dSIR method and C) T1reg method; D) an example of WM (green) and GM (red) segmentation; E) T1dSIR derived T1 values are plotted against T1reg derived T1 values. Inside the mD (blue dotted lines) the estimated coefficient of the linear regression model is significantly close to 1 (p-value<0.001, two-sided t-test). All brain regions outside the blue dotted lines lack this linear relationship and cannot be evaluated using this specific mD.
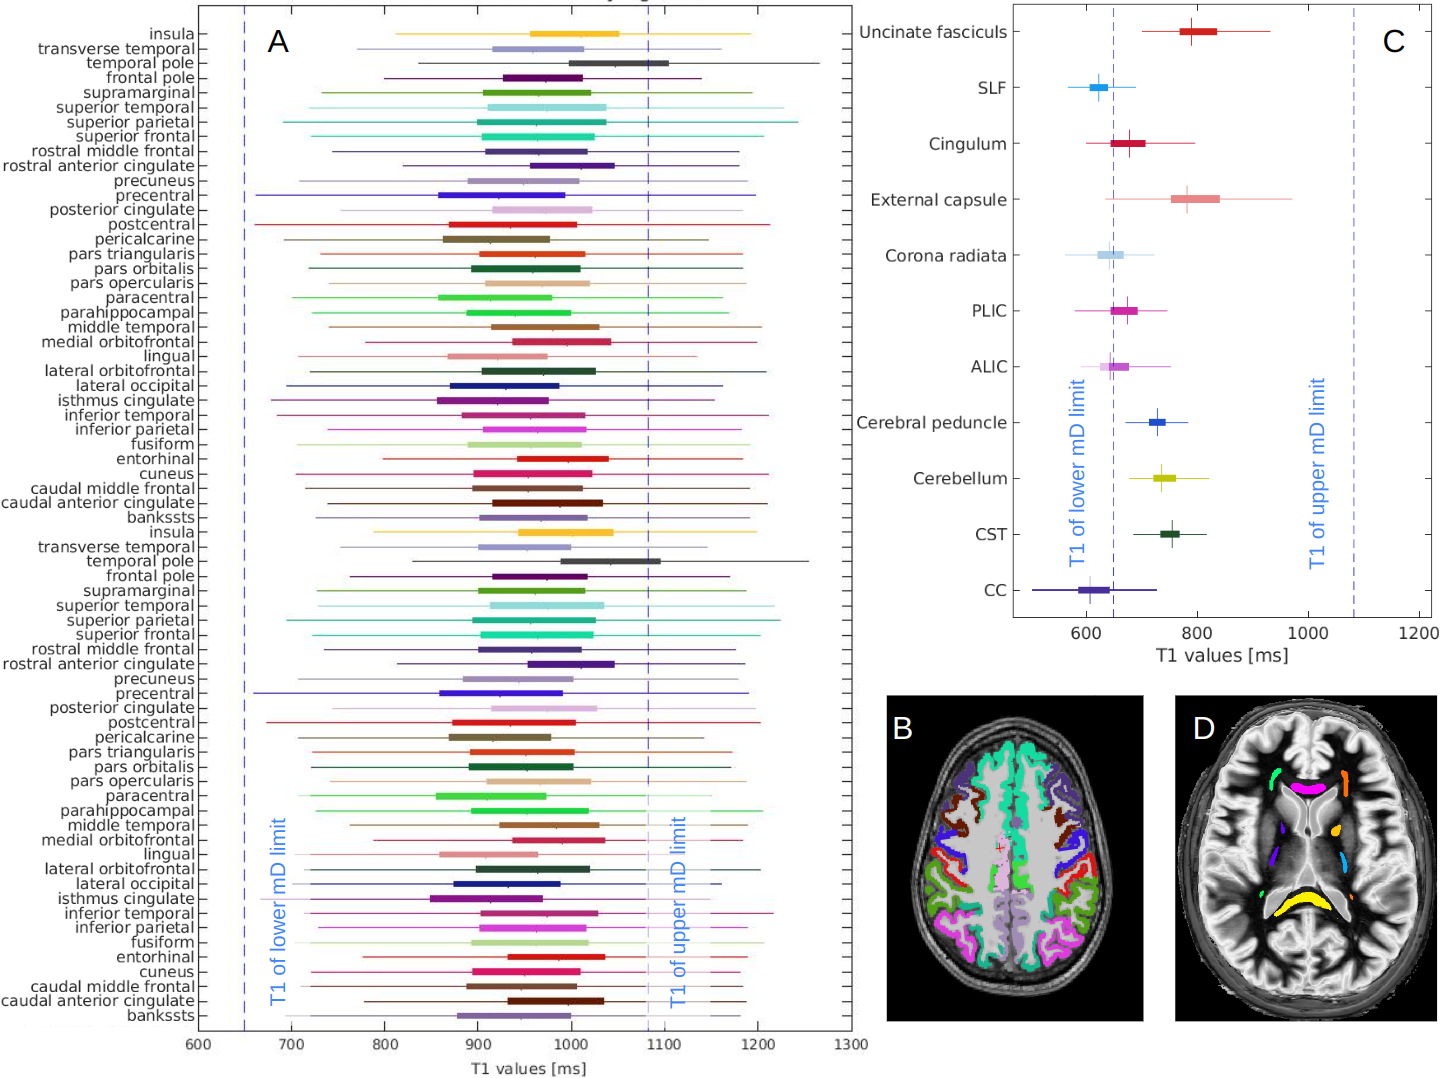
Figure 4: Range of T1 values for different brain areas: A) T1 values of different cortical areas calculated by T1reg method, B) an example of cortical regions segmentation using FreeSurfer, C) T1 values of different WM tracts calculated by T1reg method, D) an example of WM tracts segmentation using JHU like atlas. Blue dotted lines represent the limits of the mD (TI: 450-750 ms correspond to T1: 649-1082 ms in the graph). Some regions fall outside the mD, e.g. the Corpus Callosum (CC in Fig.C), and require the use of appropriate mD.
DOI: https://doi.org/10.58530/2023/2796