2794
Individual-specific TBSS of diffusion and relaxometry measures reveal differences of global white matter in autistic individuals1Medical Physics, University of Wisconsin - Madison, Madison, WI, United States, 2Neuroscience Training Program, Waisman Center, University of Wisconsin - Madison, Madison, WI, United States, 3Waisman Center, University of Wisconsin - Madison, Madison, WI, United States, 4Kinesiology, University of Wisconsin - Madison, Madison, WI, United States
Synopsis
Keywords: White Matter, Diffusion/other diffusion imaging techniques, Autism
For neurological conditions that effect brain regions differently across individuals, quantitative neuroimaging-based metrics of individual deviation may be more informative in characterizing neuroanatomical variation including normal from abnormal variations than commonly used group-wise analyses. This work uses a joint analysis of iTBSS (individual-specific Tract-Based Spatial Statistics) of multiple neuroimaging measures from diffusion and relaxometry to better characterize differences between autistic and non-autistic individuals.Introduction
When studying heterogeneous neurological conditions such as autism spectrum disorder (ASD), it is important to consider individual variability of brain microstructural measures. One approach in discerning meaningful differences in brain structure is to assess deviations of an individual from a normative distribution. Further, in the case of multidimensional data, it may be appropriate to consider multivariate measures like the Mahalanobis distance1 (MaD), previously shown useful for detecting atypical measurements in multidimensional datasets from studies of multifaceted conditions2–6. Here we implement univariate and multivariate versions of individual-specific Tract-Based Spatial Statistics (iTBSS) based on standard z-cores and MaD for anomaly detection in white matter microstructure. Results show that multivariate-iTBSS leads to observable deviations in global white matter microstructure of autistic individuals compared to a normative group of typically developing controls.Methods
Data from 133 participants (ages 6.0-10.97, 37 female) were included in this study, 56 ASD (6.14-10.84 years, 12 female) and 77 TD (6.02-10.97 years, 25 female). dMRI data (9 directions at b=350smm-2, 18 directions at 800smm-2, 36 directions 2000smm-2, 6 non-diffusion-weighted) were acquired at 3T. Whole-brain T1-weighted imaging was done with Magnetization Prepared n-contrast Rapid Gradient Echo (MPnRAGE)7scanning (1mm isotropic). MPnRAGE is a novel imaging method that combines magnetization preparation using inversion recovery with rapid 3D radial k-space readouts. The MPnRAGE reconstruction enables retrospective head-motion correction, tissue-specific segmentation, and reliable quantitative R1 mapping8 for myelin content quantification (R1=1/qT1, longitudinal relaxation rate). dMRI data were processed to minimize noise9,10 Gibbs ringing11, and artifacts from motion, eddy current12–14 and EPI distortions. Subsequently, dMRI scans were spatially aligned and upsampled to the MPnRAGE images and processed according to the Ti-Di fusing approach15. Diffusion tensors were estimated using a non-linear least squares fitting algorithm in the DIPY software package16. Neurite orientation dispersion and density imaging (NODDI)17 maps were estimated using the Dmipy Toolbox18. DTI (FA, MD, RD, AD), NODDI (ICVF,ODI), and MPnRAGE (R1) measures were used for estimating MaD and z-scores between individuals and the TD group.The iTBSS workflow
An FA template was first built from all participants followed by estimation of a white matter skeleton and distance map19. dMRI and R1 maps were mapped to the template. For the TD group, the maps were projected onto the skeleton using the distance map and concatenated into a 4-D reference group file. Each ASD subject’s parameter map was also projected onto the skeleton and stored separately. Two matrices were positioned at each voxel on the skeleton: a TD group nxp matrix for n participants and p number of parameters, and a 1xp matrix for the individual to be compared to the group. For each skeleton voxel, MaD between individual i and reference group S was estimated as MaD(C,V)=√((xi-C)TV-1(xi-C)), where C and V are the mean vector and covariance matrix estimated from the nxp matrix of S, and xi is the 1xp parameter vector of the individual being compared. For the same skeleton voxels, the z-score for parameter p between individual i and reference group S was estimated as z=(pi-P)/s, where P and s are the sample mean and standard deviation and pi is the individual parameter estimate. MaD and standard z-scores were also computed for each of the TD individuals in a leave-one-out approach.
Results
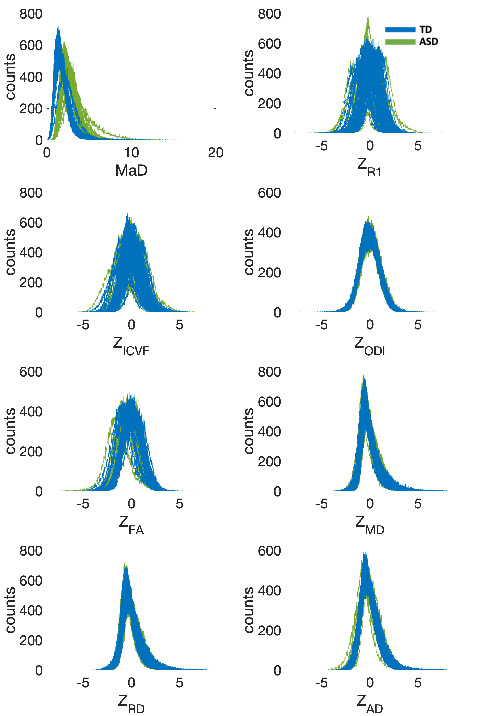
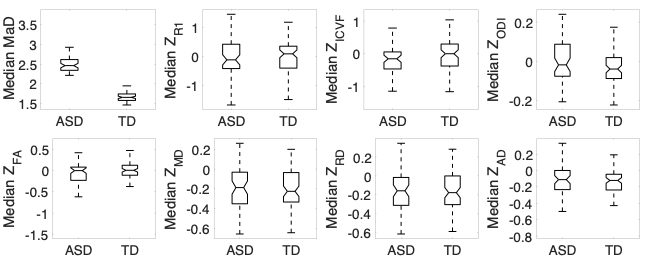
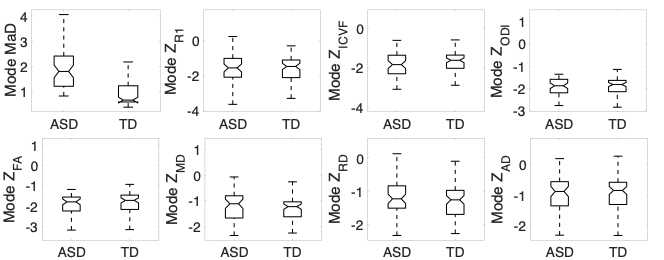
The histograms of deviation scores over the white matter skeleton were plotted for all participants. These are shown in Figure 1. It is evident from these plots that the univariate z-score distributions between the two groups largely overlap, but when considering the multivariate measure there is a clear shift between distributions of the two groups. For each subject’s histogram, the median and mode (most frequent value) were computed. These results are summarized by group in the boxplots shown in Figures 2 & 3. The boxplots for the multivariate case are statistically significantly different (median: p<10e-15, t-stat=22.3128; mode: p<10e-12, t-stat= 7.9428) between the two groups. However, no differences were observed for the univariate z-scores.Discussion
The non-overlapping box-and-whisker plots of the iTBSS MaD of ASD versus TD suggest that MaD may be a more useful measure for individual-level analysis of persons with or suspected to be autistic compared to the individual measures utilized in the computation of the MaDs. Nevertheless, it is the interplay between the univariate measures that leads to this improved characterization in the composite measure represented by MaD. Therefore, the individual metrics should not be disregarded and should still provide key insights into specific brain regions and biological mechanisms implicated in ASD. Current and future work includes thresholding strategies for more spatially specific localization of atypical microstructure. Additionally, ways for correcting MaD and z-score estimates for sample-size-related biases, multiple comparisons, and age effects in the microstructural measures are being developed. Specifically, age effects will impact the characteristics of the normative group distribution by adding to the variance and modelling out those effects may improve the sensitivity of the method. Finally, the relations that may exist between the deviation scores and non-imaging base measures in ASD needs to be investigated.Acknowledgements
This work was supported by the Hartwell Foundation’s Individual Biomedical Award (to BT) and the NationalInstitutes of Health [P30 HD003352, U54 HD090256, andP50 HD105353 to the Waisman Center, R01 HD094715 to BT and AA, and T32 CA009206 to the University of Wisconsin Radiological Sciences Training Program]. NA was partiallysupported by NIH grants R01 NS111022, R01 NS117568,P01 AI132132, R01 AI138647, and R01 AG037639. DD waspartially supported by NIH grant R00 MH11056. The content issolely the responsibility of the authors and does not necessarilyrepresent the official views of the National Institutes of Health.References
1. Mahalanobis, P. C. On the generalized distance in statistics. Natl. Inst. Sci. India II, (1936).
2. Dean, D. C. et al. Multivariate characterization of white matter heterogeneity in autism spectrum disorder. NeuroImage Clin. 14, 54–66 (2017).
3. Guerrero, J. M., Adluru, N., Dean, D. C. & Alexander, A. L. Voxel-wise Mahalanobis Distance (MaD-Vox): a multivariate approach to single subject analysis. in Proc. Int. Soc. Magn. Reson. Med. (2018).
4. Guerrero, J. M., Ferrazzano, P. & Alexander, A. L. Mahalanobis Distance Tractometry (MaD-Tract) for Multivariate Analyses. in Proc. Int. Soc. Magn. Reson. Med. -Accepted (2020).
5. Guerrero-Gonzalez, J. et al. Mahalanobis distance tractometry (MaD-Tract) – a framework for personalized white matter anomaly detection applied to TBI. NeuroImage 260, 119475 (2022).
6. Gyebnár, G. et al. Personalized microstructural evaluation using a Mahalanobis-distance based outlier detection strategy on epilepsy patients’ DTI data – Theory, simulations and example cases. PLOS ONE 14, e0222720 (2019).
7. Kecskemeti, S. et al. MPnRAGE: A technique to simultaneously acquire hundreds of differently contrasted MPRAGE images with applications to quantitative T 1 mapping. Magn. Reson. Med. 75, 1040–1053 (2016).
8. Kecskemeti, S. & Alexander, A. L. Three-dimensional motion-corrected T1 relaxometry with MPnRAGE. Magn. Reson. Med. 84, 2400–2411 (2020).
9. Veraart, J. et al. Denoising of diffusion MRI using random matrix theory. NeuroImage 142, 394–406 (2016).
10. Veraart, J., Fieremans, E. & Novikov, D. S. Diffusion MRI noise mapping using random matrix theory: Diffusion MRI Noise Mapping. Magn. Reson. Med. 76, 1582–1593 (2016).
11. Kellner, E., Dhital, B., Kiselev, V. G. & Reisert, M. Gibbs-ringing artifact removal based on local subvoxel-shifts: Gibbs-Ringing Artifact Removal. Magn. Reson. Med. 76, 1574–1581 (2016).
12. Andersson, J. L. R. & Sotiropoulos, S. N. An integrated approach to correction for off-resonance effects and subject movement in diffusion MR imaging. NeuroImage 125, 1063–1078 (2016).
13. Andersson, J. L. R. et al. Towards a comprehensive framework for movement and distortion correction of diffusion MR images: Within volume movement. NeuroImage 152, 450–466 (2017).
14. Andersson, J. L. R., Graham, M. S., Zsoldos, E. & Sotiropoulos, S. N. Incorporating outlier detection and replacement into a non-parametric framework for movement and distortion correction of diffusion MR images. NeuroImage 141, 556–572 (2016).
15. Guerrero-Gonzalez, J. et al. Improving Imaging of the Brainstem and Cerebellum in Autistic Children: Transformation-Based High-Resolution Diffusion MRI (TiDi-Fused) in the Human Brainstem. Front. Integr. Neurosci. 16, 804743 (2022).
16. Garyfallidis, E. et al. Dipy, a library for the analysis of diffusion MRI data. Front. Neuroinformatics 8, (2014).
17. Zhang, H., Schneider, T., Wheeler-Kingshott, C. A. & Alexander, D. C. NODDI: Practical in vivo neurite orientation dispersion and density imaging of the human brain. NeuroImage 61, 1000–1016 (2012).
18. Fick, R., Deriche, R. & Demian Wassermann. The Dmipy Toolbox: Diffusion MRI Multi-Compartment Modeling and Microstructure Recovery Made Easy. (2019) doi:10.5281/ZENODO.3490325.
19. Smith, S. M. et al. Tract-based spatial statistics: Voxelwise analysis of multi-subject diffusion data. NeuroImage 31, 1487–1505 (2006).
Figures