2788
Association between arterial stiffness and white matter integrity in older adults1Department of Radiology, Juntendo University Graduate School of Medicine, Bunkyo-ku, Japan, 2Department of Metabolism and Endocrinology, Juntendo University Graduate School of Medicine, Bunkyo-ku, Japan, 3Sportology Center, Juntendo University Graduate School of Medicine, Bunkyo-ku, Japan
Synopsis
Keywords: White Matter, Brain
This study aimed to use advanced MRI techniques to investigate the effect of arterial stiffness on the white matter (WM) microstructure among older adults. Arterial stiffness was examined using the cardio-ankle vascular elasticity index (CAVI). The high-CAVI group (mean CAVI ≥ 9 points) and the low-CAVI group (mean CAVI < 9 points) were used. The neuronal fiber integrity of the WM was assessed by neurite orientation dispersion, density imaging, and magnetization transfer-saturation imaging. Our results suggest that arterial stiffness may be related to demyelination rather than axonal degeneration.
Background and Purpose
Arterial stiffness is reported to be able to cause axonal demyelination or degeneration (1,2). This study aimed to investigate the relationships between the cardio-ankle vascular elasticity index (CAVI)-measured arterial stiffness and white matter (WM)-sensitive MRI measures of the brain in older adults.Material and Methods
Study participantsThis study included 110 participants. Arteriosclerosis was estimated by CAVI determined using an automatic waveform analyzer (Vascular Screening System VaSera VS-1500, Fukuda Denshi, Tokyo, Japan) (3). High-CAVI (≥9.0) suggests a progression of carotid and coronary arteriosclerosis (4). As a result, CAVI nine was set as the cutoff value. The eligible participants were divided into high- and low-CAVI groups. Figure 1 illustrates the demographic characteristics.
Image acquisition
All subjects were scanned using a 3-T MRI unit (Magnetom Prisma, Siemens Healthcare, Erlangen, Germany). Diffusion-weighted imaging (DWI) was conducted at b values of 1000 and 2000 s/mm² in 64 directions using a simultaneous multi-slice echo-planar imaging sequence. MT-sat indices were discovered using three-dimensional multi-echo fast low-angle shot sequences with predominant T1-, proton density-, and MT-weighting (5). Additionally, FLAIR images were obtained.
Diffusion MRI processing
The EDDY and TOPUP toolboxes, which are part of the FMRIB Software Library 5.0.9 (FSL, Oxford Centre for Functional MRI of the Brain, UK; www.fmrib.ox.ac.uk/fsl) were used (6). The resulting images were fitted to the NODDI model (7) by utilizing the NODDI MATLAB Toolbox 5 (http://www.nitrc.org/projects/noddi_toolbox). The maps of orientation dispersion index, isotropic volume fraction (ISOVF), and intracellular volume fraction were produced using Accelerated Microstructure Imaging via Convex Optimization (8). Fractional anisotropy and mean diffusivity were then calculated from the DWI data based on b values of 0 and 1000 s/mm.
Myelin-sensitive imaging processing
MT-sat data was analyzed by using MATLAB script (9).
Tract‑based spatial statistical (TBSS) analysis and tracts of interest (TOI) analysis
Voxel-wise statistical analysis was performed using TBSS applied in FSL (10). TOI were examined using the ICBM DTI-81 Atlas (11). Based on the TBSS results (Figure 2) and previous studies (12,13) demonstrating arterial stiffness-associated WM regions, six WM tracts (the corpus callosum [CC], internal capsule [IC], corona radiata [CR], inferior fronto-occipital fasciculus [IFOF], forceps minor [FMi], and anterior thalamic radiation [ATR]) were identified as TOI of radial diffusivity (RD) and ISOVF. Furthermore, seven WM tracts (the CC, IC, CR, IFOF, FMi, ATR, and superior longitudinal fasciculus [SLF]) were chosen as TOI of myelin volume fraction (MVF).
Statistical analysis
Using the Randomize tool, the groups with high and low-CAVI were contrasted for TBSS.
We conducted univariate linear regression analyzes on all participants using the mean CAVI as the independent variable and each WM metric as the dependent variable. Subsequently, multivariate linear regression analyzes were performed using backward linear regression to find independent factors related to mean CAVI. The variable p < 0.2 in the univariate model was included in the back-removal method with p-removal = 0.1. To distinguish from the strength of the relationship between the mean CAVI and WM integrity, age, sex, antihypertensive therapy, systolic blood pressure, and intracranial volume were deemed confounding covariates. Moreover, the partial correlation analyzes between each WM metric and the cognitive performance scores were analyzed separately for all participants, the high-CAVI group, and the low-CAVI group, adjusting for age, sex, and education level. For each WM metric and region, multiple comparisons were fixed using the false discovery rate (FDR) method. FDR-corrected p < 0.05 was considered significant.
Results
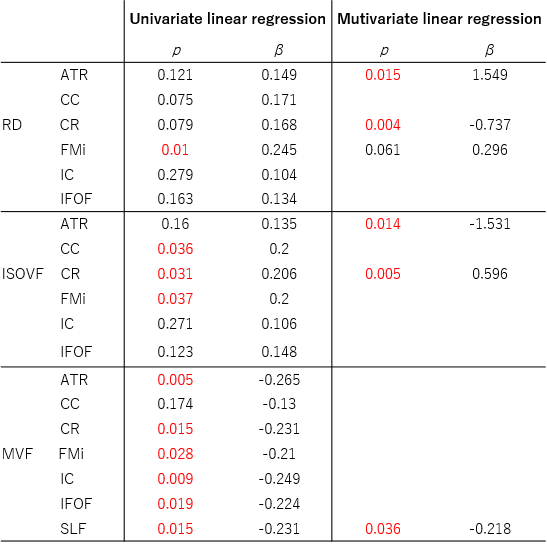
According to TBSS results, the MVF in the large WM area was significantly lower in the high-CAVI group than in the low-CAVI group (Figure 2). TBSS results also revealed significantly higher RD and ISOVF in the high-CAVI group than in the low-CAVI group in the CC, FMi, IFOF, IC, CR, and ATR (Figure 2).In the multivariate linear regression analyzes, the mean CAVI was significantly correlated with RD and ISOVF in the ATR and CR; and MVF in the SLF (Figure 3).
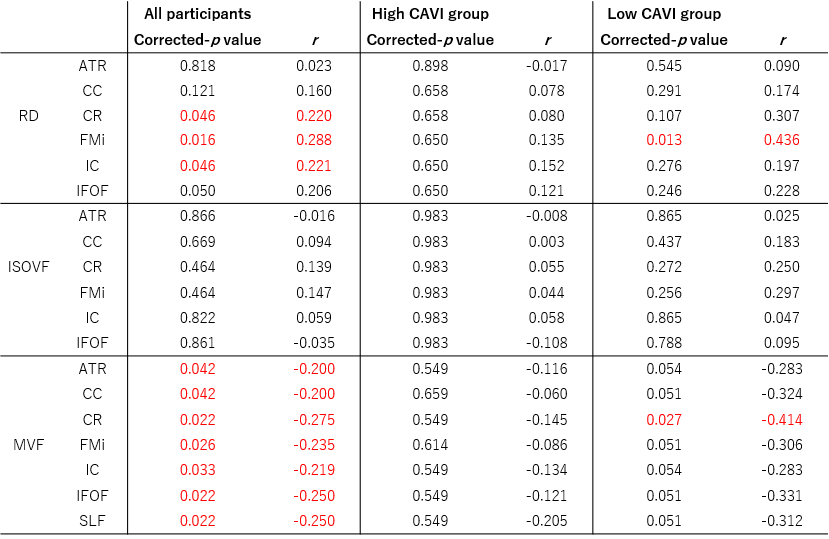
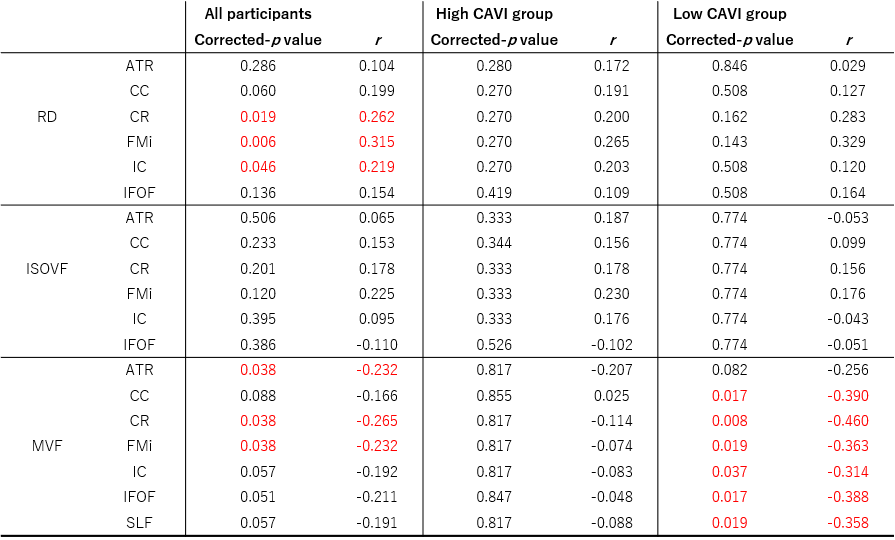
Finally, partial correlation coefficients were observed for the significant associations of the trail making test scores, which are measures of executive function with the RD and MVF (Figure 4.5).
Discussion
The high-CAVI group had a significantly lower MVF than the low-CAVI group in the broad WM regions, according to the TBSS results. RD and ISOVF changes were relatively overlapped, mainly observed in the anterior area. These findings suggest that the high-CAVI group's WM may involve more demyelination than the low-CAVI group's WM.The multivariate linear analysis noted the significant associations of the mean CAVI with RD, ISOVF, and MVF. These results might indicate a connection between demyelination and arteriosclerosis. The present study also demonstrated the existence of partial correlation coefficients for the significant correlations between executive function and WM metrics. Notably, in all participants and the low-CAVI group, the MVF in several WM areas was negatively associated with executive function. These results imply that demyelination and executive dysfunction may be related.
Conclusion
Arterial stiffness may be related to demyelination rather than axonal degeneration.Acknowledgements
This work was supported in part by a Grant-in-Aid for Special Research in Subsidies for ordinary expenses of private schools from The Promotion and Mutual Aid Corporation for Private Schools of Japan (S1411006) and KAKENHI (18H03184, 18H02772, and 20K16737) from the Ministry of Education, Culture, Sports, Science and Technology of Japan.References
1. Maillard P, Mitchell GF, Himali JJ, et al. Aortic Stiffness, Increased White Matter Free Water, and Altered Microstructural Integrity: A Continuum of Injury. Stroke 2017; 48(6): 1567-73.
2. Tarumi T, de Jong DL, Zhu DC, et al. Central artery stiffness, baroreflex sensitivity, and brain white matter neuronal fiber integrity in older adults. Neuroimage 2015; 110: 162-70.
3. Shirai K, Utino J, Otsuka K, Takata M. A Novel Blood Pressure-independent Arterial Wall Stiffness Parameter; Cardio-Ankle Vascular Index (CAVI). Journal of atherosclerosis and thrombosis 2006; 13: 101-7.
4. Izuhara M, Shioji K, Kadota S, et al. Relationship of Cardio-Ankle Vascular Index (CAVI) to Carotid and Coronary Arteriosclerosis. Circulation Journal 2008; advpub: 0809160082-.
5. Kamagata K, Zalesky A, Yokoyama K, et al. MR g-ratio-weighted connectome analysis in patients with multiple sclerosis. Scientific Reports 2019; 9: 1-13.
6. Yamada H, Abe O, Shizukuishi T, et al. Efficacy of Distortion Correction on Diffusion Imaging: Comparison of FSL Eddy and Eddy_Correct Using 30 and 60 Directions Diffusion Encoding. PLoS ONE 2014; 9(11): e112411.
7. Zhang H, Schneider T, Wheeler-Kingshott CA, Alexander DC. NODDI: practical in vivo neurite orientation dispersion and density imaging of the human brain. Neuroimage 2012; 61(4): 1000-16.
8. Daducci A, Canales-Rodríguez EJ, Zhang H, Dyrby TB, Alexander DC, Thiran JP. Accelerated Microstructure Imaging via Convex Optimization (AMICO) from diffusion MRI data. Neuroimage 2015; 105: 32-44.
9. Helms G, Dathe H, Kallenberg K, Dechent P. High-resolution maps of magnetization transfer with inherent correction for RF inhomogeneity and T1 relaxation obtained from 3D FLASH MRI. Magnetic Resonance in Medicine 2008; 60(6): 1396-407.
10. Smith SM, Jenkinson M, Johansen-Berg H, et al. Tract-based spatial statistics: voxelwise analysis of multi-subject diffusion data. Neuroimage 2006; 31(4): 1487-505.
11. Mori S, Oishi K, Jiang H, et al. Stereotaxic white matter atlas based on diffusion tensor imaging in an ICBM template. Neuroimage 2008; 40(2): 570-82.
12. Tamura Y, Shimoji K, Ishikawa J, et al. Subclinical Atherosclerosis, Vascular Risk Factors, and White Matter Alterations in Diffusion Tensor Imaging Findings of Older Adults With Cardiometabolic Diseases. Front Aging Neurosci 2021; 13: 712385.
13. Badji A, Noriega de la Colina A, Karakuzu A, et al. Arterial stiffness and white matter integrity in the elderly: A diffusion tensor and magnetization transfer imaging study. NeuroImage 2019; 186: 577-85.
Figures

Figure 1. Demographic characteristics of the participants.
Demographic and clinical data were analyzed using Chi-squared test or Mann–Whitney U test. A p-values (two-tailed) < 0.05 was considered statistically significant. MoCA-J : The Japanese version of Montreal Cognitive Assessment, PVH : Periventricular hyperintensity, DSWMH : Deep and subcortical white matter hyperintensity
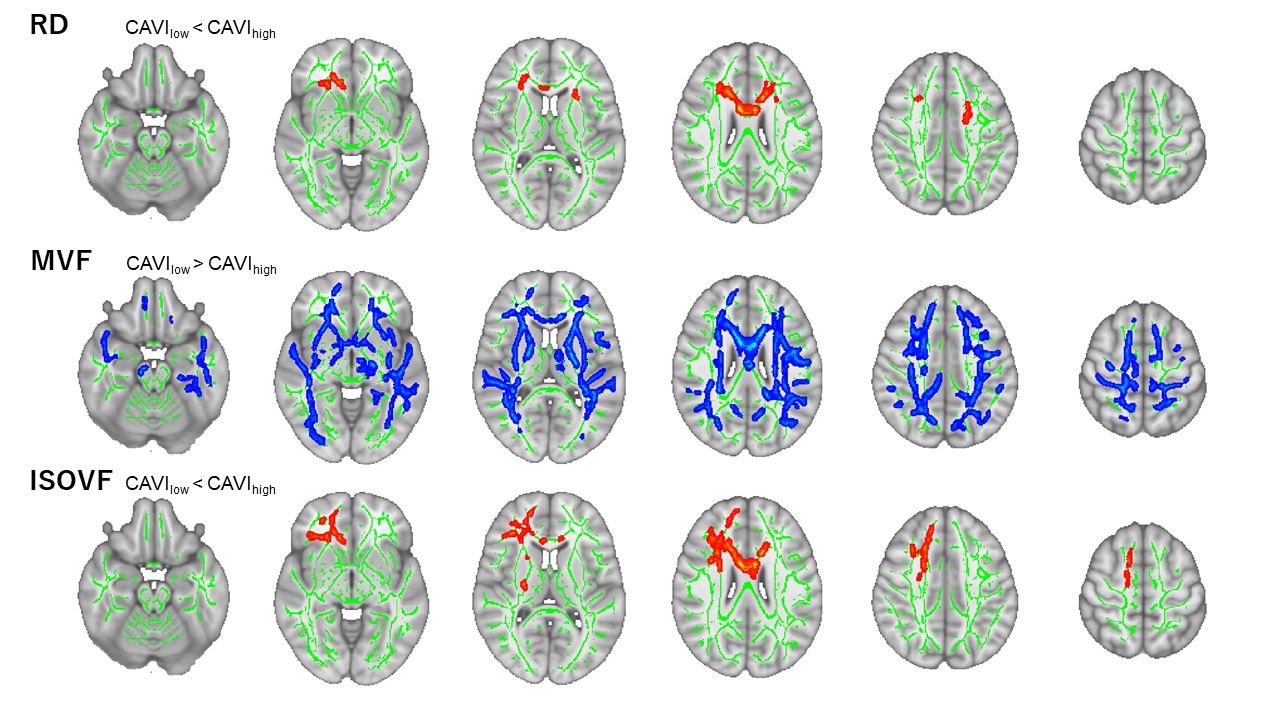
Figure 2. Comparison between the high- and low CAVI groups.
Red–yellow voxels demonstrate significantly higher RD and ISOVF values in the high CAVI group than in the low CAVI group. Blue–light blue voxels illustrate a significantly lower MVF value in the high CAVI group than in the low CAVI group (family-wise error [FWE]-corrected p < 0.05, adjusting for age, sex, antihypertensive therapy use, systolic blood pressure, and intracranial volume).