2785
Longitudinal change of white matter-specific brain age is associated with Alzheimer's disease-related regional atrophy1Department of Bioengineering, University of Pittsburgh, Pittsburgh, PA, United States, 2Department of Psychiatry, University of Pittsburgh, Pittsburgh, PA, United States, 3Department of Biostatistics, University of Pittsburgh, Pittsburgh, PA, United States
Synopsis
Keywords: White Matter, Aging, brain age
The white matter (WM) network integrity is assumed to associate with Alzheimer's disease (AD)-related gray matter (GM) atrophy. To investigate this hypothesis, we estimated WM-specific brain age to quantify WM integrity and calculated twelve AD-related GM signatures in a longitudinal cognitively normal cohort. We identified that the change rate of WM brain age was significantly correlated with the left hippocampal and amygdala volumetric changes; that is, the accelerated aging in WM was associated with the more atrophic GM volumes. This result suggested that changes of structural network characterized by brain age metrics can reflect the alteration of AD-related GM signatures.Introduction
In Alzheimer's disease (AD), network activities that support cognitive abilities would be altered decades before clinical disease onset, and the affected network can predict pathology and brain atrophy in the future1. We hypothesized that the structural network underlying functional activities can also reflect the association with AD-related brain atrophy. Thus, in this study, we applied the brain age paradigm2 to white matter (WM) features to estimate WM-specific brain age that characterized structural network integrity and investigated its association with gray matter (GM) signatures that relate to AD pathological changes.Materials & Methods
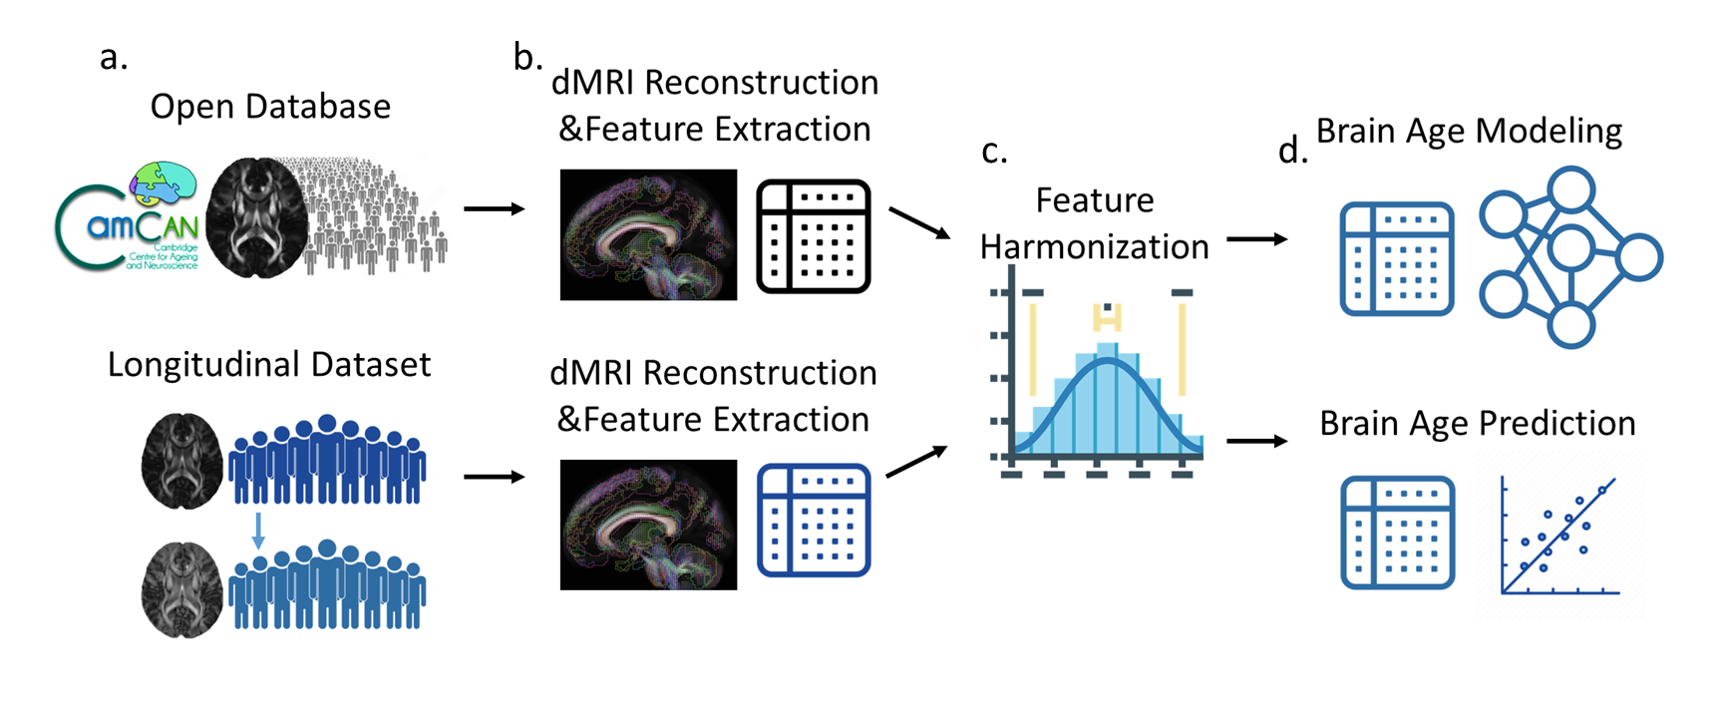
We collected two datasets to perform the experiment. For brain age modeling of WM, we used an open-access dataset called CamCAN3 to train and validate the brain age model (Figure 1a). To model the aging pattern in the elderly population, the subjects whose age was greater than 50 years were included (precisely, 50-88 years). These cognitively normal subjects were further divided into training (n=305, age=67.6 [10.1], sex=50.1% males) and validation (n=34, age=66.9 [11.0], sex=47.1% males) sets. Each subject in the CamCAN dataset had two-shell diffusion-weighted images with 30 unique diffusion-encoding directions at b-values 1000 and 2000 s/mm^2 and 3 b0 images, which were acquired at a 3T Siemens Tim Trio scanner. These diffusion-weighted images first underwent quality assurance and eddy current correction, and then were reconstructed using the diffusion tensor model to obtain diffusion metrics including fractional anisotropy, axial, radial, and mean diffusivities through the DSI-studio package (https://dsi-studio.labsolver.org/). After that, the diffusion metrics were sampled based on 41 pre-defined tract regions including major association, projection, and commissural pathways4. Eventually, there were 164 WM features extracted from each individual’s diffusion MRI dataset (Figure 1b). Besides, to perform WM brain age prediction, we used two cognitively normal cohorts from the local database including test and target sets. The former (n=82, age=75.6 [5.8], sex=40.2% males) was used to confirm the model performance in the local domain, and the latter (n=19, age=73.7 [5.4], sex=52.6% males) was used to perform the experiment. The target set had two longitudinal measures of which the interval was 2.1 [1.0] years. The datasets included single-shell diffusion-weighted images (12 unique diffusion directions with b-value 1000 s/mm^2) and T1-weighted images (1mm isotropic resolution) acquired on a 3T Siemens Trio scanner. The diffusion-weighted images from the local database went through the same analytic process, and then the features from all sets were harmonized using the ComBat method5 to reduce inter-scanner variability (Figure 1c). To establish a WM brain age model, we used the training set’s features to regress their chronological age by a seven-layer cascade neural network with mean square error as the loss function6. The established model was further applied to validation, test, and target sets to evaluate performance and perform inference (Figure 1d). The metric, predicted age difference (PAD), calculated in the target set was used to associate with GM signatures. The GM signatures were estimated based on T1-weighted images by using voxel-based morphometry through Freesurfer with cortical and subcortical atlas7. According to the previous literature8,9, we investigated 12 GM bilateral regional volumes such as the hippocampus, amygdala, and parahippocampus that were considered to associate with AD-related brain atrophy. We used exploratory canonical correlation analysis to explore the potential maximal correlation between WM brain age and GM signatures and employed multiple linear regression analysis to confirm the statistical association between them.Results
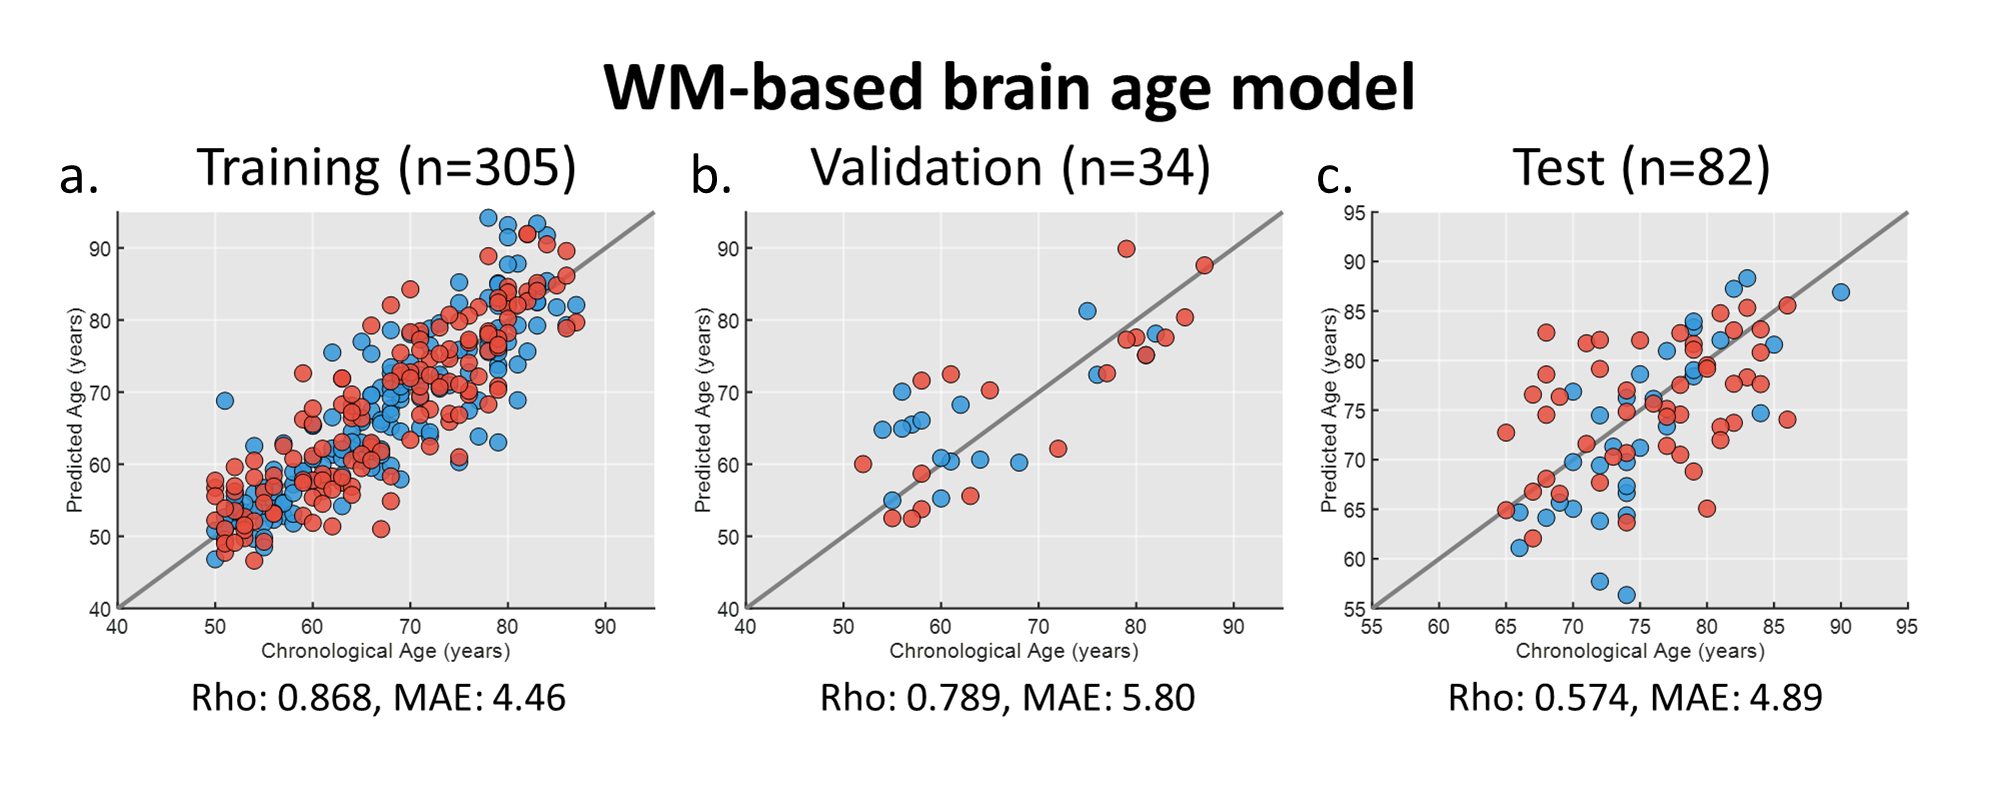
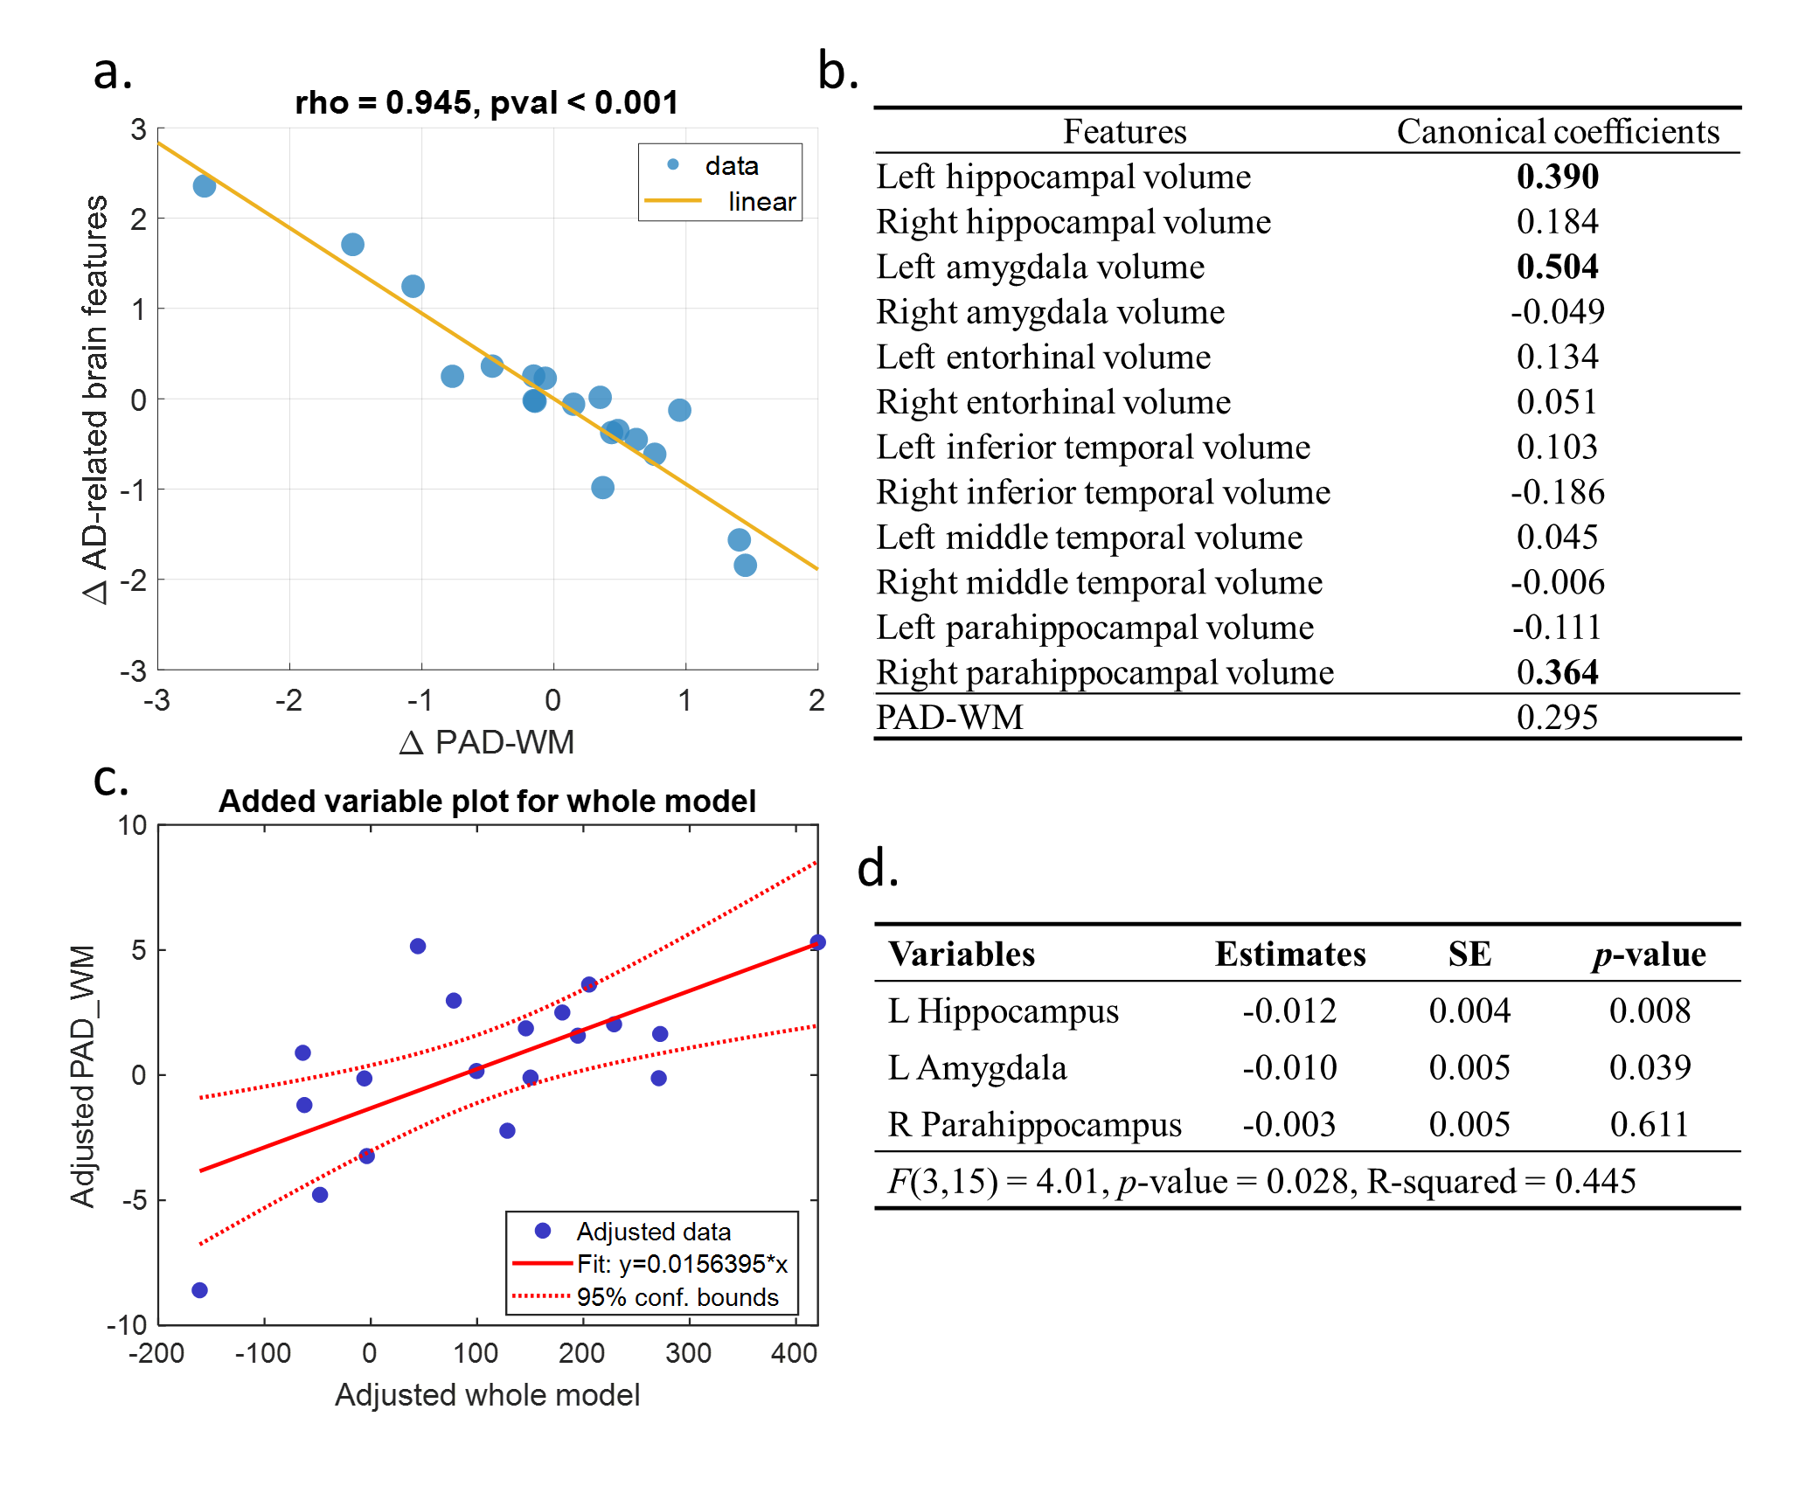
For brain age modeling of WM, the performance was comparable between training, validation, and test sets, suggesting that the model can yield fair prediction across two sites (Figure 2). In the cross-sectional association analysis, the canonical correlation was only 0.411 between WM brain age and GM signatures, and the post-hoc regression analysis did not identify any significant univariate correlation between them. We further used the change rate of WM brain age and the change rate of GM signatures as multivariates to perform longitudinal association analysis. We found that there existed a strong canonical correlation (0.945) between the change rate of WM brain age and that of GM signatures (Figure 3a). we further investigated the coefficient contribution in the GM signature component (Figure 3b) and found that the left hippocampus, left amygdala, and right parahippocampus may be the key features. We used linear regression to confirm their association with WM brain age; the change rates of the left hippocampal and amygdala were significantly correlated with the change in WM brain age (Figure 3c&3d).Discussion & Conclusion
We found that there was no significant association between WM brain age measures and AD-related GM signatures in the cross-sectional observation. However, the change rate of WM brain age was significantly correlated with the left hippocampal and left amygdala volumetric changes; more increases in WM brain age (i.e. being older) were associated with more decreases in GM volumetric measures (i.e. being atrophic). The result suggested that changes in structural networks characterized by brain age metrics can reflect the alteration of AD-related GM signatures. This paradigm can further be applied to clinical cohorts to confirm and detect the recognized pattern. Additionally, further research is warranted to study its association with changes in functional activities and WM lesions.Acknowledgements
This work was supported by National Institute of Aging, National Institutes of Health (NIH): R01 AG067018 to Dr. Wu and RF1 AG025516 to Dr. Aizenstein.References
[1] Palop, J. J., & Mucke, L. (2016). Network abnormalities and interneuron dysfunction in Alzheimer disease. Nature Reviews Neuroscience, 17(12), 777-792.
[2] Cole, J. H., & Franke, K. (2017). Predicting age using neuroimaging: innovative brain ageing biomarkers. Trends in neurosciences, 40(12), 681-690.
[3] Taylor, J. R., Williams, N., Cusack, R., Auer, T., Shafto, M. A., Dixon, M., ... & Henson, R. N. (2017). The Cambridge Centre for Ageing and Neuroscience (Cam-CAN) data repository: Structural and functional MRI, MEG, and cognitive data from a cross-sectional adult lifespan sample. neuroimage, 144, 262-269.
[4] Yeh, F. C. (2022). Population-based tract-to-region connectome of the human brain and its hierarchical topology. Nature communications, 13(1), 1-13.
[5] Fortin, J. P., Parker, D., Tunç, B., Watanabe, T., Elliott, M. A., Ruparel, K., ... & Shinohara, R. T. (2017). Harmonization of multi-site diffusion tensor imaging data. Neuroimage, 161, 149-170.
[6] Chen, C. L., Hsu, Y. C., Yang, L. Y., Tung, Y. H., Luo, W. B., Liu, C. M., ... & Tseng, W. Y. I. (2020). Generalization of diffusion magnetic resonance imaging-based brain age prediction model through transfer learning. NeuroImage, 217, 116831.
[7] Fischl, B., Salat, D. H., Busa, E., Albert, M., Dieterich, M., Haselgrove, C., ... & Dale, A. M. (2002). Whole brain segmentation: automated labeling of neuroanatomical structures in the human brain. Neuron, 33(3), 341-355.
[8] Pini, L., Pievani, M., Bocchetta, M., Altomare, D., Bosco, P., Cavedo, E., ... & Frisoni, G. B. (2016). Brain atrophy in Alzheimer’s disease and aging. Ageing research reviews, 30, 25-48.
[9] Misra, C., Fan, Y., & Davatzikos, C. (2009). Baseline and longitudinal patterns of brain atrophy in MCI patients, and their use in prediction of short-term conversion to AD: results from ADNI. Neuroimage, 44(4), 1415-1422.
Figures