2784
High Heterogeneity of White Matter Observed with Short TE Magnetic Resonance Elastography1Radiology, Brigham and Women's Hospital, Boston, MA, United States, 2Harvard Medical School, Boston, MA, United States, 3SigProc Expert Solutions, Westwood, MA, United States, 4Imaginostics, Inc., Cambridge, MA, United States, 5Radiology, Massachusetts General Hospital, Charlestown, MA, United States, 6Neurosurgery, Brigham and Women's Hospital, Boston, MA, United States, 7Psychology, Northeastern University, Boston, MA, United States, 8INSERM, Paris, France
Synopsis
Keywords: White Matter, Elastography, superficial white matter heterogeneity, myelin water
Prior MRE work in the brain has utilized long TE pulse sequences (spiral and EPI) and therefore has necessarily not observed the signal from short T2 components. In particular, the signal from water compartmentalized in myelin membranes and that is a sensitive measure of white matter structural integrity, has been missed. Here we demonstrate high heterogeneity of the shear stiffness within the superficial white matter when utilizing MRE sequences with a short (10ms) TE.INTRODUCTION
Recent high resolution Magnetic Resonance Elastography (MRE) studies of the brain have all been performed with long TE sequences, either spiral1,2 or EPI3,4. These studies have analyzed the white matter (WM) as a single T2 component tissue with higher shear stiffness compared to gray matter2. These long TE sequences, however, essentially miss the short T2 component (T2~10-55ms)5 associated with “myelin water”, defined as water compartmentalized in myelin membranes. Using a short TE MRE sequence, we have observed remarkable heterogeneity of the shear stiffness in superficial WM and high concordance of the MRE maps with underlying anatomical structure.METHODS
MRE data was acquired with a GRE Ristretto sequence6, 27 slices, 1.5mm isotropic resolution, acq. matrix 128x128, FA=25 deg, TR/TE=375/9.84 ms. To date, we have completed scanning and analysis on two healthy adult subjects. Hadamard MEG encoding with amplitude//frequency=32mT/m//160Hz, vibration frequency=50Hz, 8 wave-phases acquired, with acq. time 13:34 min. Three repeats of this MRE sequence were performed. Additional MRI scans acquired included T1w MPRAGE, T2 FLAIR, and DTI. We used a rotating eccentric mass vibration transducer for shear wave production7. As described earlier8, the 3D Helmholtz wave-equation for the curl of the displacement was solved for an isotropic wavelength via minimum χ2. To ensure the data was high quality, various quality metrics were calculated and required to be above or below minimally acceptable thresholds. This included requiring the curl/div ratio of the displacement field to be >5 and the nonlinearity of the Fourier component of the displacement field at 50Hz to be < 20%. We also checked that there was good penetration of the shear waves throughout the brain and minimal motion (less than one pixel and less than one degree of rotation) between sequential MRE scans. The DTI protocol included 102 directions and followed the Adolescent Brain Cognitive Development (ABCD) protocol9. The DTI data was processed to produce axonal fiber tractography maps where the curvature of these tracts was compared to areas of high shear stiffness identified by the MRE maps.RESULTS
Figure 1 shows examples of MRE wavelength maps overlaid on an MPRAGE anatomical background where the top and bottom sub-figures show different levels of opacity for the overlay. Note the high degree of concordance of the MRE maps with the background anatomical structure. Figure 2 shows wavelength maps for three sequential MRE scans for a single subject and demonstrates high quality reproducibility of our results over a short time period of ~40 minutes. An extremely novel feature of this data is the large degree of heterogeneity of the shear stiffness in the WM. One readily observes that stiffer regions are in the superficial white matter and located near areas of high curvature of the WM near the gyri. This observation led to the hypothesis that perhaps the curvature of the axons was an important feature of the microstructure that determined the level of shear stress when subjected to mechanical vibrations. To test this, axonal tractography maps, Figure 3, were produced and compared to the shear wavelength maps. Figure 3, however, shows that there is not excellent agreement between areas of high axonal curvature and areas of high shear stiffness.DISCUSSION
The density of axons is highest in the corpus callosum and corona radiata and thus these regions have a high fraction of myelin water. These regions, however, have a low and relatively homogeneous shear stiffness. They do not show the strong stiffness heterogeneity seen in the superficial WM. This leads to the hypothesis that the underlying structure of the superficial WM must have a strong influence on the shear stresses developed when applying an external vibration. The DTI tractography maps in Figure 3 are a first attempt at elucidating such structural components. One can readily observe that while areas of high axon curvature at the base of “U” fibers are in reasonable proximity to areas of high shear stiffness, there is not excellent agreement. Hence, while the axonal geometry may contribute to how shear stress is developed, it is clearly not the only component that determines the rheological properties of brain tissue.CONCLUSIONS
In conclusion, we have shown there is an important short T2 component in WM that is highly heterogeneous but only in the peripheral superficial WM. We have also demonstrated high reproducibility of our shear wavelength maps between different scans in a single scan session leading to the conclusion that the results reported here are robust. The signal from myelin water is directly related to intact myelin and may therefore be highly sensitive to demyelination and pathologic processes leading to dementia. Hence, short TE MRE measurements of WM may lead to a sensitive biomarker to detect changes in the structural integrity of WMAcknowledgements
This project is supported by NIH grants R01EB028664, K01EB027726, R21NS114917 and R01MH125860.References
1. Hiscox LV, Johnson CL, McGarry MDJ, Perrins M, Littlejohn A, van Beek EJR, Roberts N, Starr JM. High-resolution magnetic resonance elastography reveals differences in subcortical gray matter viscoelasticity between young and healthy older adults. Neurobiology of Aging 65 (2018) 158-167.
2. Hiscox LV, McGarry MDJ, Schwarb H, Van Houten EEW, Pohlig RT, Roberts N, Huesmann GR, Burzynska AZ, Sutton BP, Hillman CH, Kramer AF, Cohen NJ, Barbey AK, Paulsen KD, Johnson CL. Standard-space atlas of the viscoelastic properties of the human brain. Human Brain Mapping 2020;41:5282-5300. Doi: 10:1002/hbm.25192.
3. Takamura T, Motosugi U, Sasaki Y, Kakegawa T, Sata K, Glaser KJ, Ehman RL, Onishi H. Influence of Age on Global and Regional Brain Stiffness in Young and Middle-Aged Adults. J. Magn Reson Imag 2020:51:727-733.
4. Sack I, Streitberger K-J, Krefting D, Friedemann P, Braun J. The Influence of Physiological Aging and Atrophy on Brain Viscoelastic Properties in Humans. PLoS ONE 6(9): e23451. Doi: 10.1371/journal.pone.0023451.
5. MacKay A, Whittall K, Adler J, Li D, Paty D, Graeb D. In Vivo Visualization of Myelin Water in Brain by Magnetic Resonance. MRM 31:673-677 (1994).
6. Guenthner C, Sethi S, Troelstra M, Dokumaci AS, Sinkus R, Kozerke S. Ristretto MRE: A generalized multi-shot GRE-MRE sequence. NMR Biomed 2019;32:e4049.
7. Runge JH, Hoelzl SH, Sudakova J, et al. A novel magnetic resonance elastography transducer concept based on a rotational eccentric mass: preliminaryexperiences with the gravitational transducer. Phys Med Biol 2019;64:45007.
8. Mishra S, Deng B, Hoge WS, Tie Y, Annio G, Sinkus R, Patz S. Imaging Neuronal Activity at Fast Timescales in Humans using MR Elastography. ISMRM 2022, London.
9. Casey BJ, Cannonier T, Conley MI et al. The Adolescent Cognitive Development (ABCD) study: Imaging acquisition across 21 sites. Developmental Cognitive Neuroscience 32 (2018) 43-54.
Figures
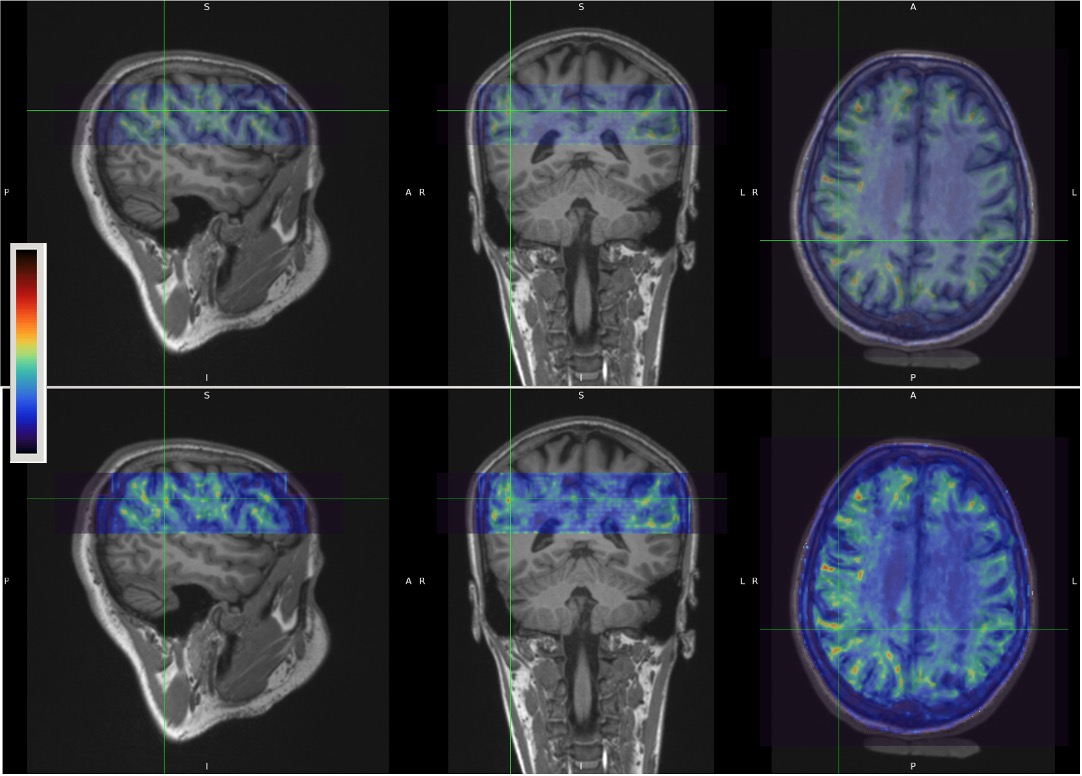
Figure 1. Example of MRE wavelength (lambda) maps overlaid on MPRAGE anatomical scan for Subject #1. Top and bottom rows are identical except the opacity of the top layer is increased in the bottom row to show more of the highly heterogeneous stiffness in the superficial white matter. The colormap shows high areas of shear stiffness (high wavelength) in reddish-brown.
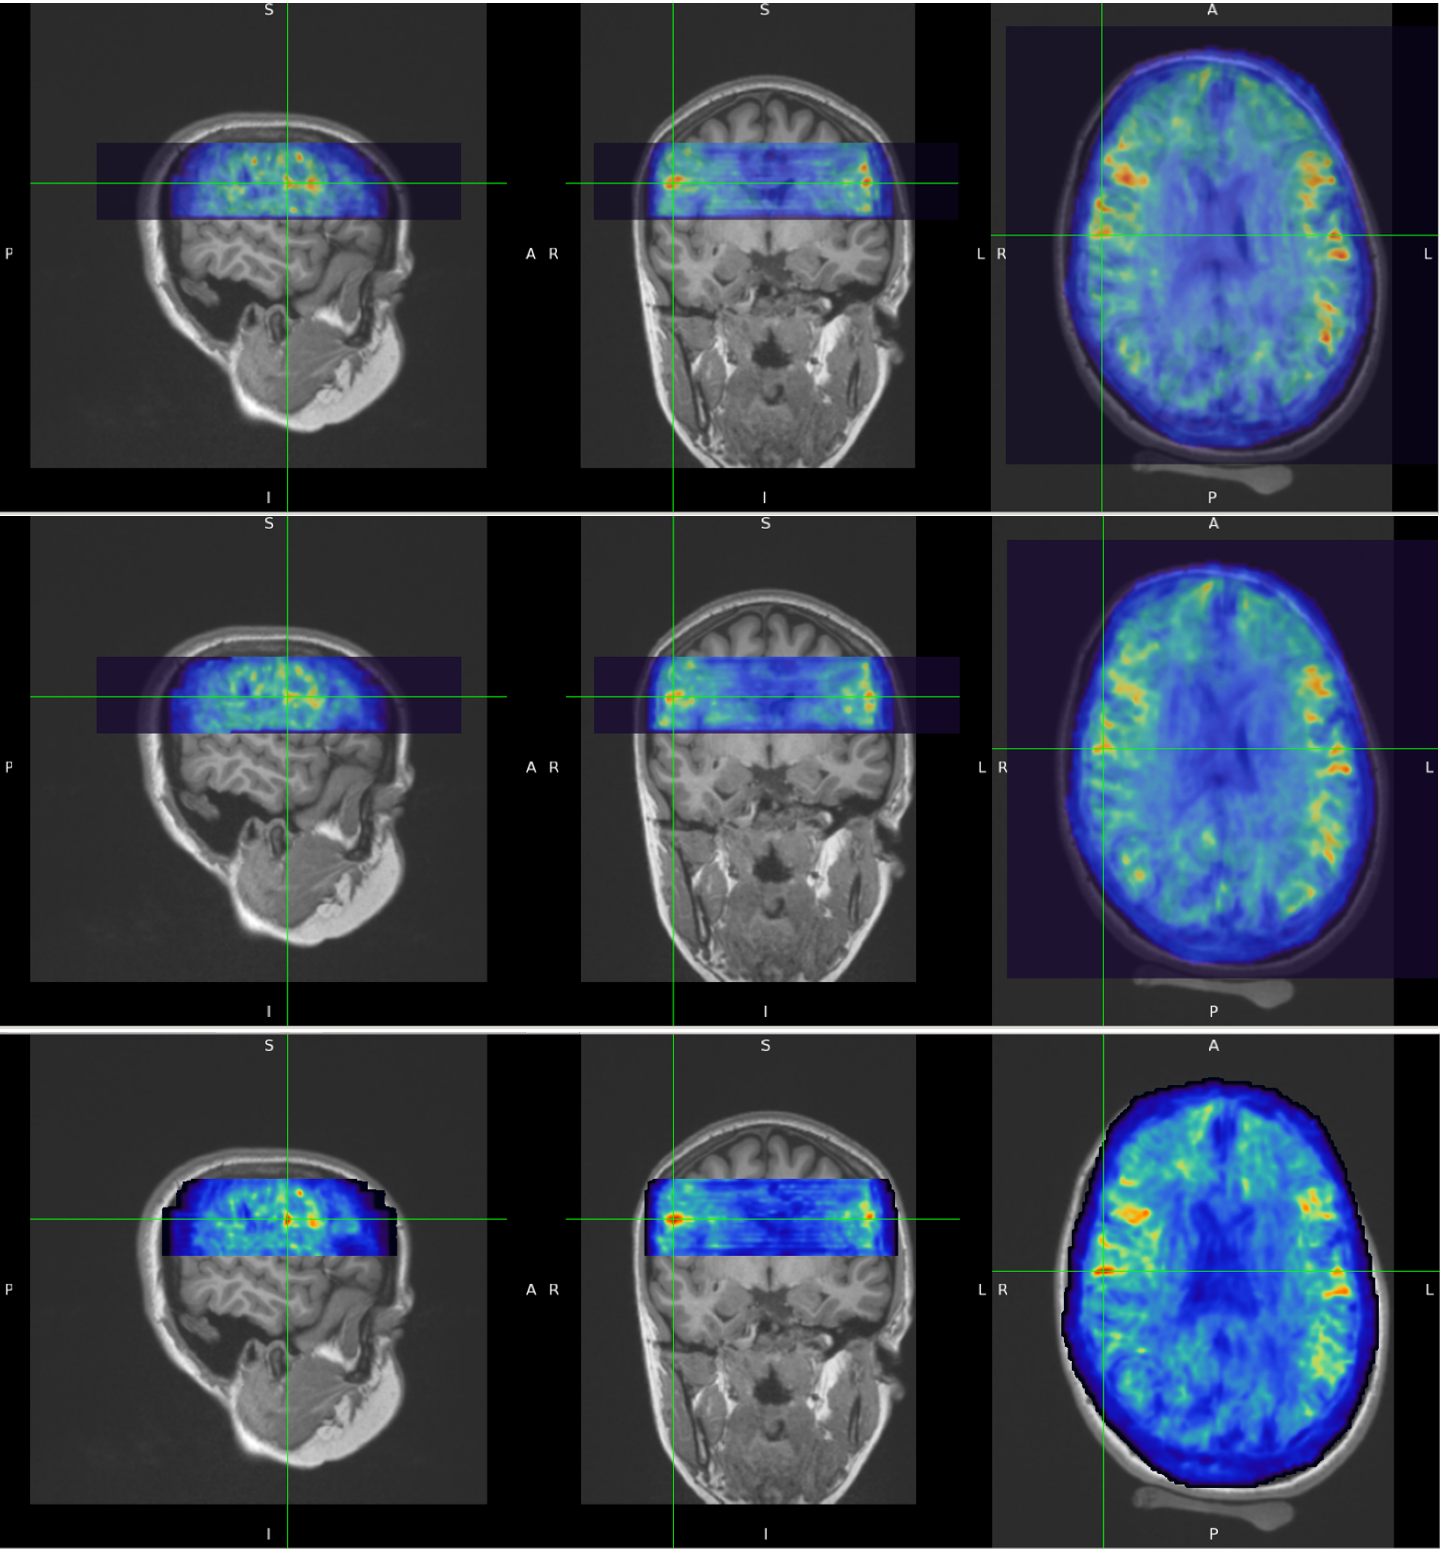
Figure 2. Short term repeatability of MRE results. MRE wavelength maps overlaid on MPRAGE anatomical scan for Subject #2. Three sequential MRE scans were acquired over a period of ~40 minutes. The temporal sequence is top row is first scan, middle row is second scan and bottom row is third scan. Notice how well the white matter heterogeneity patterns are reproduced in all three scans.
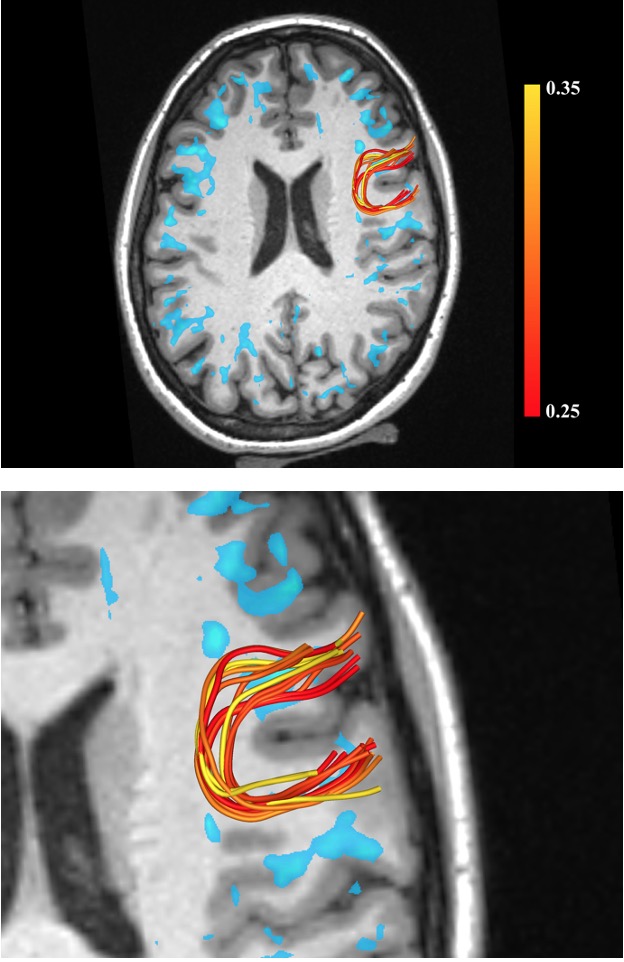
Figure 3. Tractography of U fibers. Top row shows a single slice with areas of high stiffness (wavelength > 25mm) shown in blue. U-shaped fiber tracts in a specific region are shown overlaid on the anatomical scan and with a zoomed-in view on the bottom row. The fiber color mapping is a relative measure of curvature and given by the ratio of Euclidean distance between the start and end points of a U-fiber relative to the total length along its path (higher curvature lower value of ratio).