2782
Repeatability of Cones UTE-T2* Mapping of Cartilage1Orthopaedic Surgery, Stanford University, Stanford, CA, United States
Synopsis
Keywords: Cartilage, Relaxometry, Repeatability, UTE-T2*
This work examines the combined acquisition and segmentation repeatability of Cones UTE-T2* measures in tread mark cartilage regions and in small 2-D cartilage and meniscus ROIs in the knees of uninjured participants. Both intra- and inter-day repeatability assessments showed excellent average CVs of less than 10% in all tread mark ROIs and in all but 2 small 2-D ROIs segmented from only a single slice. ICC estimates were good to excellent (0.79–0.98) in all tread mark ROIs and ranged from moderate to excellent (0.54-0.98) in small 2-D ROIs corresponding to absolute precision errors of less than 1ms in most cases.PURPOSE
Compositional ultrashort echo-time T2* (UTE-T2*) mapping can be used to detect pre-osteoarthritis (pre-OA)1 because it is sensitive to the collagen matrix integrity and organization of deep articular cartilage2 and meniscus.3 Pre-OA is the state in which patients exhibit potentially reversible biological, mechanical or structural biomarkers associated with heightened OA risk, but do not yet have clinical or radiographic disease.4; 5 Cartilage and meniscus UTE-T2* values in pre-OA patients with anterior cruciate ligament reconstructions (ACLR) have been shown to be higher than comparable UTE-T2* values in uninjured controls,3; 6 and were related to increased knee loading7; 8 and worse PROs.8 These prior findings were based on UTE-T2* assessments of small 2-D cartilage regions of interest (ROIs) drawn from a single slice. More recently, tibiofemoral strips of cartilage (which we term “tread mark” ROIs which are largely consistent with known regions of cartilage contact during common daily activities9) have detected high incidences of deep cartilage matrix changes 2 years after ACLR, particularly in medial tibial cartilage.10 While the repeatability of cartilage and meniscus UTE-T2* values measured with an acquisition-weighted stack-of-spirals (AWSOS)11 sequence in small 2-D ROIs have previously been reported,3; 12 the repeatability of UTE-T2* measured from a Cones sequence13 in tread mark ROIs has not been investigated. The goal of this work is to examine the combined acquisition and segmentation repeatability of Cones UTE-T2* measures in tread mark cartilage regions and in small 2-D cartilage and meniscus ROIs.METHODS
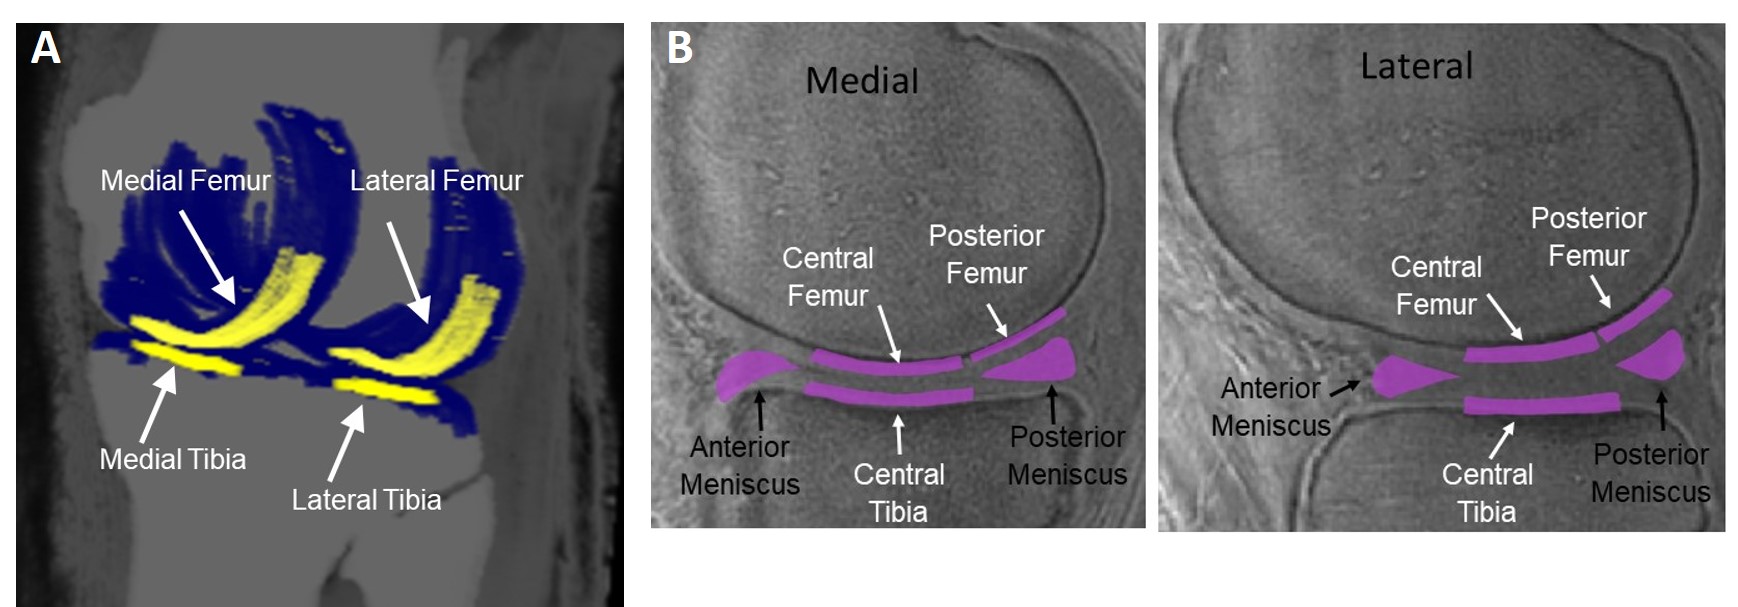
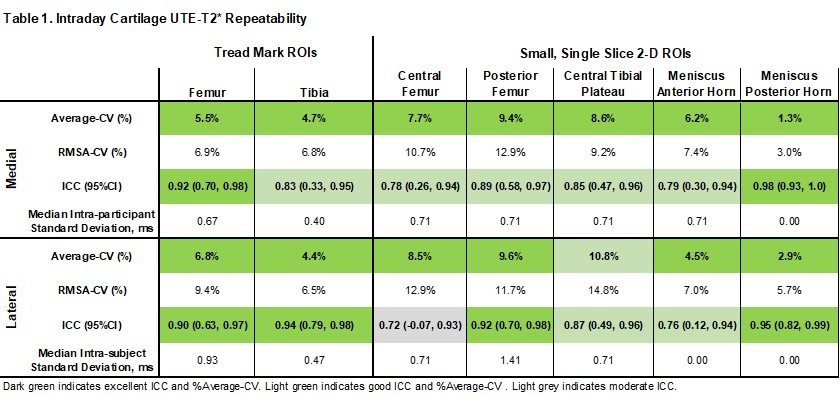
Thirteen uninjured volunteers (9 females; mean age: 28 (SD: 3) years) consented to participate in these IRB-approved studies. Participants underwent 2-3 separate 3T MRI examinations (MR 750, GE Healthcare) with an 18-channel knee coil. UTE-T2* maps were calculated via pixel-by-pixel mono-exponential fitting of a series of T2*-weighted images acquired at eight TEs (32μs -16ms, non-uniform echo spacing) using a radial out 3-D cones acquisition.7; 13 The selection of echo times was optimized to specifically assess deep articular cartilage, the portion of cartilage extending from the bone-cartilage interface through half of the articular thickness.12 Average UTE-T2* values from deep tibiofemoral cartilage was segmented 2 ways. Tread mark ROIs were assessed from 3 contiguous sagittal slices (9mm wide right to left)10 on each of 4 surfaces including the medial and lateral femoral and tibial cartilage, Figure 1a. Tread mark UTE-T2* calculation and segmentation was performed with Olea Sphere (Olea Medical, FR). 2-D ROIs were assessed from a single central-medial or central-lateral sagittal slice in 10 small regions including weight-bearing cartilage to the central and posterior femoral condyles and central tibial plateaus,12 and the anterior and posterior horns of the medial and lateral menisci,3 Figure 1b. Small 2-D ROI UTE-T2* calculation and segmentation was performed with MRIMapper software (©MIT 2006). Inter-scan reproducibility was calculated as the average coefficient of variation (Average-CV%) and also as the root-mean-square average coefficients of variation (RMSA-CV%)14 for each ROI: √((∑CV2)/n)*100, where intra-participant CV was calculated as SD/average of test and retest UTE-T2* values for each ROI, and n is number of participants. Reliability of UTE-T2* measures was assessed with intraclass correlation coefficient (ICC) estimates and their 95% confidence intervals based on an absolute agreement, 2-way random-effects model. ICC values < 0.5 were considered poor; 0.5-0.75 moderate; ≥ 0.75–0.9 good; ≥ 0.9 excellent.15 Inter-scan precision was determined from the median of intra-participant SDs for each ROI. Statistical analyses were performed with SPSS (v25, IBM) and Excel (Microsoft).RESULTS
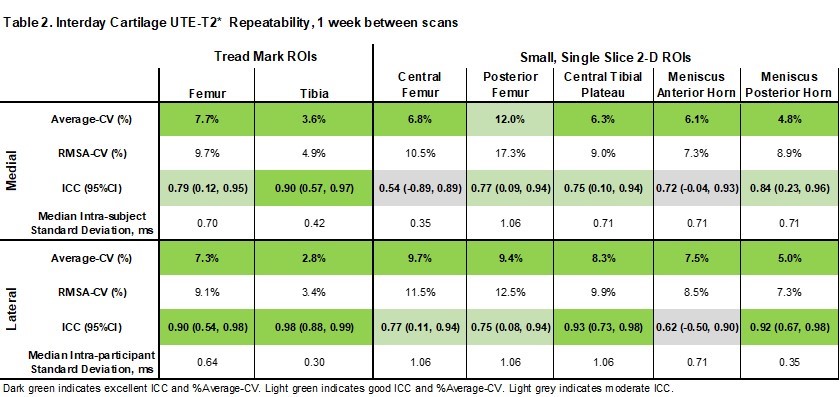
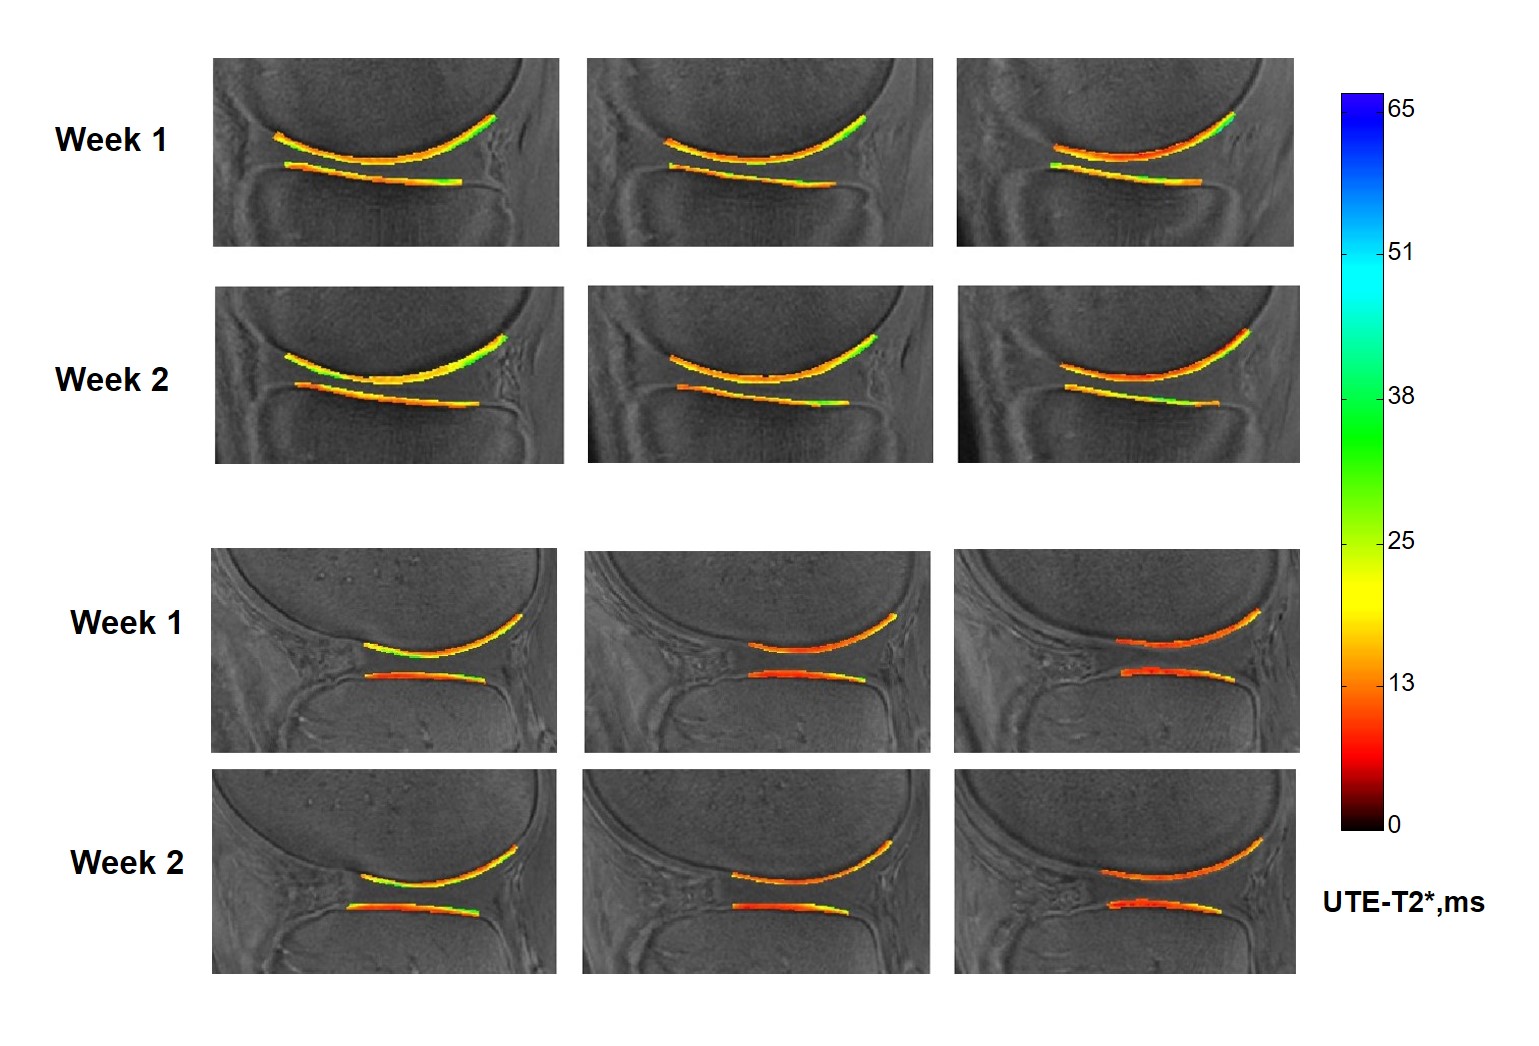
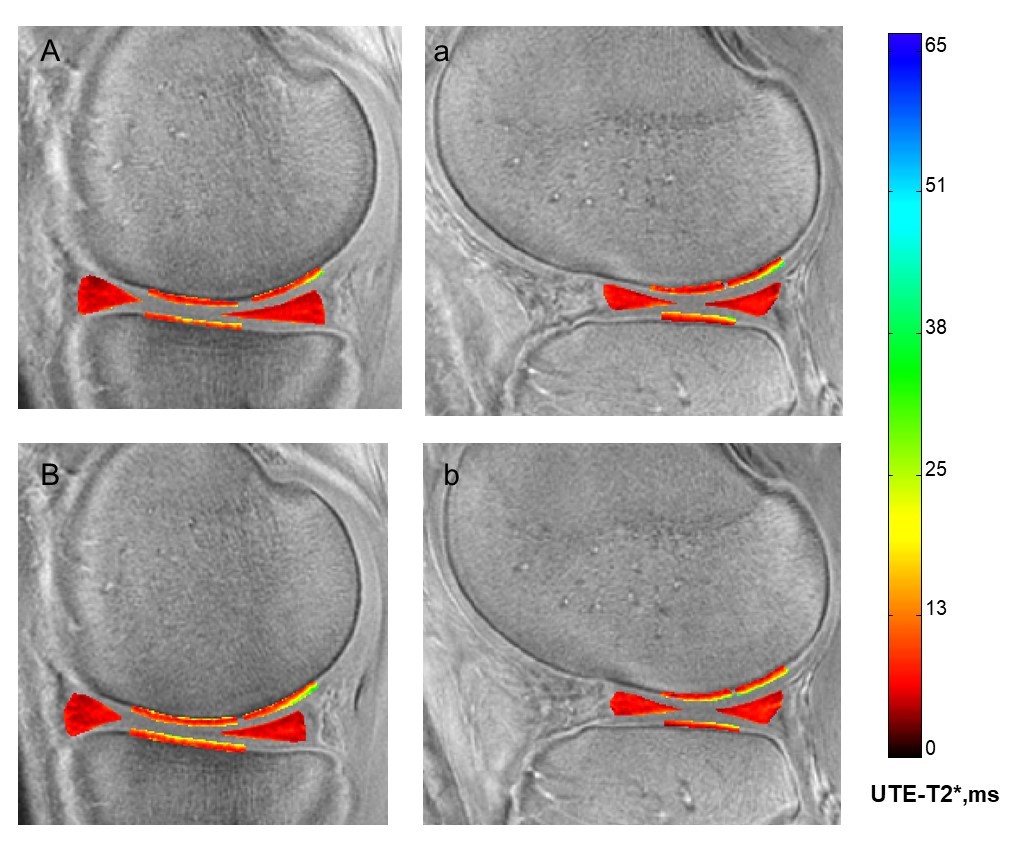
Table 1 lists intraday results from 11/13 controls who were scanned twice in one day with a brief pause out of the scanner for coil repositioning. Table 2 lists interday results from 10/13 controls who were scanned twice with a 1-week interval between scans (mean interval 7.7 (SD 2.6) days). Figure 2 shows sample tread mark UTE-T2* maps measured in the same participant with one week between scans. Figure 3 shows the corresponding small 2-D ROI UTE-T2* maps in the same participant.DISCUSSION
Both intra-and interday Cones UTE-T2* repeatability assessments showed excellent16 average-CVs of less than 10% in all tread mark ROIs and in all but 2 small 2-D ROI segmented from only a single slice. RMSA-CV, a more accurate measure of reliability because it accounts for possible UTE-T2* variation within the participant cohort,14 also demonstrated excellent values of less than 10% in all tread marks, and was less than 15% in all but 1 small 2-D ROI (posterior medial femur). ICC estimates were good to excellent (0.79 – 0.98) in all tread mark ROIs and ranged from moderate to excellent (0.54-0.98) in small 2-D ROIs corresponding to absolute precision errors of less than 1ms in most cases. These Cones UTE-T2* repeatability results are in-line with previously published AWSOS UTE-T2* values from similarly segmented small ROIs where the RMSA-CV% in deep cartilage ranged 13-16% and was 9% in posterormedial menisci.3 Intraday repeatability values were slightly better than interday values.CONCLUSION
The combined acquisition and segmentation repeatability of Cones UTE-T2* measures in tread mark cartilage ROIs are good to excellent, exceeding that of the moderate to good repeatability observed for this sequence in small 2-D cartilage and meniscus ROIs.Acknowledgements
NIH RO1 AR052784 (PI-Chu) and DOD W81XWH-18-1-0590 (PI-Chu).References
1. Chu CR, Williams AA, Erhart-Hledik JC, et al. 2021. Visualizing pre-osteoarthritis: Integrating MRI UTE-T2* with mechanics and biology to combat osteoarthritis-The 2019 Elizabeth Winston Lanier Kappa Delta Award. J Orthop Res 39(8):1585-1595.
2. Williams A, Qian Y, Bear D, et al. 2010. Assessing degeneration of human articular cartilage with ultra-short echo time (UTE) T2* mapping. Osteoarthritis Cartilage 18(4):539-546.
3. Williams A, Qian Y, Golla S, et al. 2012. UTE-T2 * mapping detects sub-clinical meniscus injury after anterior cruciate ligament tear. Osteoarthritis Cartilage 20(6):486-494.
4. Chu CR, Andriacchi TP. 2015. Dance between biology, mechanics, and structure: A systems-based approach to developing osteoarthritis prevention strategies. J Orthop Res 33(7):939-947.
5. Chu CR, Williams AA, Coyle CH, et al. 2012. Early diagnosis to enable early treatment of pre-osteoarthritis. Arthritis Res Ther 14(3):212.
6. Chu CR, Williams AA, West RV, et al. 2014. Quantitative Magnetic Resonance Imaging UTE-T2* Mapping of Cartilage and Meniscus Healing After Anatomic Anterior Cruciate Ligament Reconstruction. Am J Sports Med 42(8):1847-1856.
7. Titchenal MR, Williams AA, Chehab EF, et al. 2018. Cartilage Subsurface Changes to Magnetic Resonance Imaging UTE-T2* 2 Years After Anterior Cruciate Ligament Reconstruction Correlate With Walking Mechanics Associated With Knee Osteoarthritis. Am J Sports Med 46(3):565-572.
8. Williams AA, Titchenal MR, Andriacchi TP, et al. 2018. MRI UTE-T2* profile characteristics correlate to walking mechanics and patient reported outcomes 2 years after ACL reconstruction. Osteoarthritis Cartilage 26(4):569-579.
9. Thomeer LT, Guan S, Gray HA, et al. 2022. Articular contact motion at the knee during daily activities. J Orthop Res 40(8):1756-1769.
10. Williams AA, Titchenal MR, Guha A, et al. 2018. MRI UTE-T2* Shows High Incidence of Cartilage Subsurface Matrix Changes 2 Years After ACL Reconstruction. Orthopaedic Research Society, New Orleans, LA, USA:Paper #0173. Notified of high review score and eligible for an award to be determined at the 2018 ORS Annual Meeting.
11. Qian Y, Boada FE. 2008. Acquisition-weighted stack of spirals for fast high-resolution three-dimensional ultra-short echo time MR imaging. Magn Reson Med 60(1):135-145.
12. Williams A, Qian Y, Chu CR. 2011. UTE-T2 * mapping of human articular cartilage in vivo: a repeatability assessment. Osteoarthritis Cartilage 19(1):84-88.
13. Gurney PT, Hargreaves BA, Nishimura DG. 2006. Design and analysis of a practical 3D cones trajectory. Magn Reson Med 55(3):575-582.
14. Gluer CC, Blake G, Lu Y, et al. 1995. Accurate assessment of precision errors: how to measure the reproducibility of bone densitometry techniques. Osteoporos Int 5(4):262-270.
15. Koo TK, Li MY. 2016. A Guideline of Selecting and Reporting Intraclass Correlation Coefficients for Reliability Research. J Chiropr Med 15(2):155-163.
16. MacKay JW, Low SBL, Smith TO, et al. 2018. Systematic review and meta-analysis of the reliability and discriminative validity of cartilage compositional MRI in knee osteoarthritis. Osteoarthritis Cartilage 26(9):1140-1152.
Figures