2781
A preliminary analysis for vertebral marrow fat and disc herniation or annular tear by simultaneous multi-relaxation-time Imaging (TXI) method1Department of Radiology, Zigong First People's Hospital, Zigong, China, 2North Sichuan Medical College, Nanchong, China, 3MR Scientific Marketing, SIEMENS Healthineers Ltd., Shanghai, China
Synopsis
Keywords: Screening, Degenerative, lumbar disc herniation, annular tear, bone marrow fat
Recently T1 mapping, T2* mapping and bone marrow fat fraction (BMFF) has been separately applied to spine. But it hasn't studied the value of those mappings together with intervertebral discs (IVD) degeneration. In this study, we obtained three values (T1, T2* and BMFF value) by simultaneous multi-relaxation-time imaging technique, called TXI. We found that T1 values in abnormal (herniation or annular tear) disc were significantly lower than those in the normal. This study demonstrates that T1 mapping can be helpful in detecting IVD with herniation or annular tear.Introduction
Quantitative magnetic resonance techniques have shown potential for assessing the biochemical composition of the spine. However, few studies have simultaneously used T1 mapping, T2* mapping, and bone marrow fat fraction (BMFF) to assess their value in the intervertebral discs with herniation or annular tear. A simultaneous multi-relaxation-time Imaging technique (TXI) was introduced to calculate T1 mapping, T2* mapping and BMFF of the intervertebral disc (IVD) degeneration with herniation or annular tear, which is useful to further analyze the correlation between IVD degeneration and vertebral bone marrow fat1.Methods
Thirty patients (11 males and 19 females; age: 36-78 years; mean age: 54.233; standard deviation (SD): 10.226) participated in this study and underwent MR imaging on a 3.0T MR scanner (MAGNETOM VIDA, Siemens Healthcare, Erlangen, Germany). The acquisition contains two multi-point quantitative Dixon (qDixon) scans with two different flip angles (4˚, 9˚) and B1 mapping scan. The imaging parameters for qDixon were as follows: TR=12.4ms, TE1/TE6/ΔTE=1.07/10.12/1.81ms, matrix size = 224 × 177, FOV = 380 ×336 mm2, slice thickness = 3.5mm, slice number = 24, total time 50 seconds for each scan. The B1 mapping was acquired with the following parameters: TR = 4350ms, TE = 1.97ms, FOV = 380 × 309mm2, slice thickness = 5mm, matrix size = 64 × 64, flip angle =8˚, total acquisition time 9 seconds.Reconstruction: For simultaneous multi-parameter mapping by TXI, follow 3 steps: first, water, fat signal and T2* map were calculated by at 4˚ FA qDixon; second, BMFF was calculated by dividing fat signal by total signal (fat+water); third, the additional B1 map and the first one echo from qDixon was used for T1 mapping processing with B1 correction. The algorithm was implemented in Matlab 2018b and Python 3.5. The region of interest (ROI) was outlined based on 3D-slicer software. The vertebral body L1-L5 were delineated and the average values of BMFF for each vertebral body were obtained. The IVDs were divided equally into 5 areas to draw the ROI: the anterior 1/5 area represented the anterior annulus fibrosus (AAF) region, the 3/5 areas represented NP, and the posterior 1/5 area represents the posterior annulus fibrosus (PAF) region. Meanwhile, the entire IVDs were also mapped as ROI. Finally, the mean values of T1 mapping and T2* mapping of each ROI were calculated.
Statistical analysis: One-way ANOVA analysis was used to analyze the differences in BMFF of the vertebral body and the differences in T1 mapping and T2* mapping of IVDs among different groups. Pearson correlation was used to analyze the correlation between BMFF of the vertebral body and IVD features.
Result
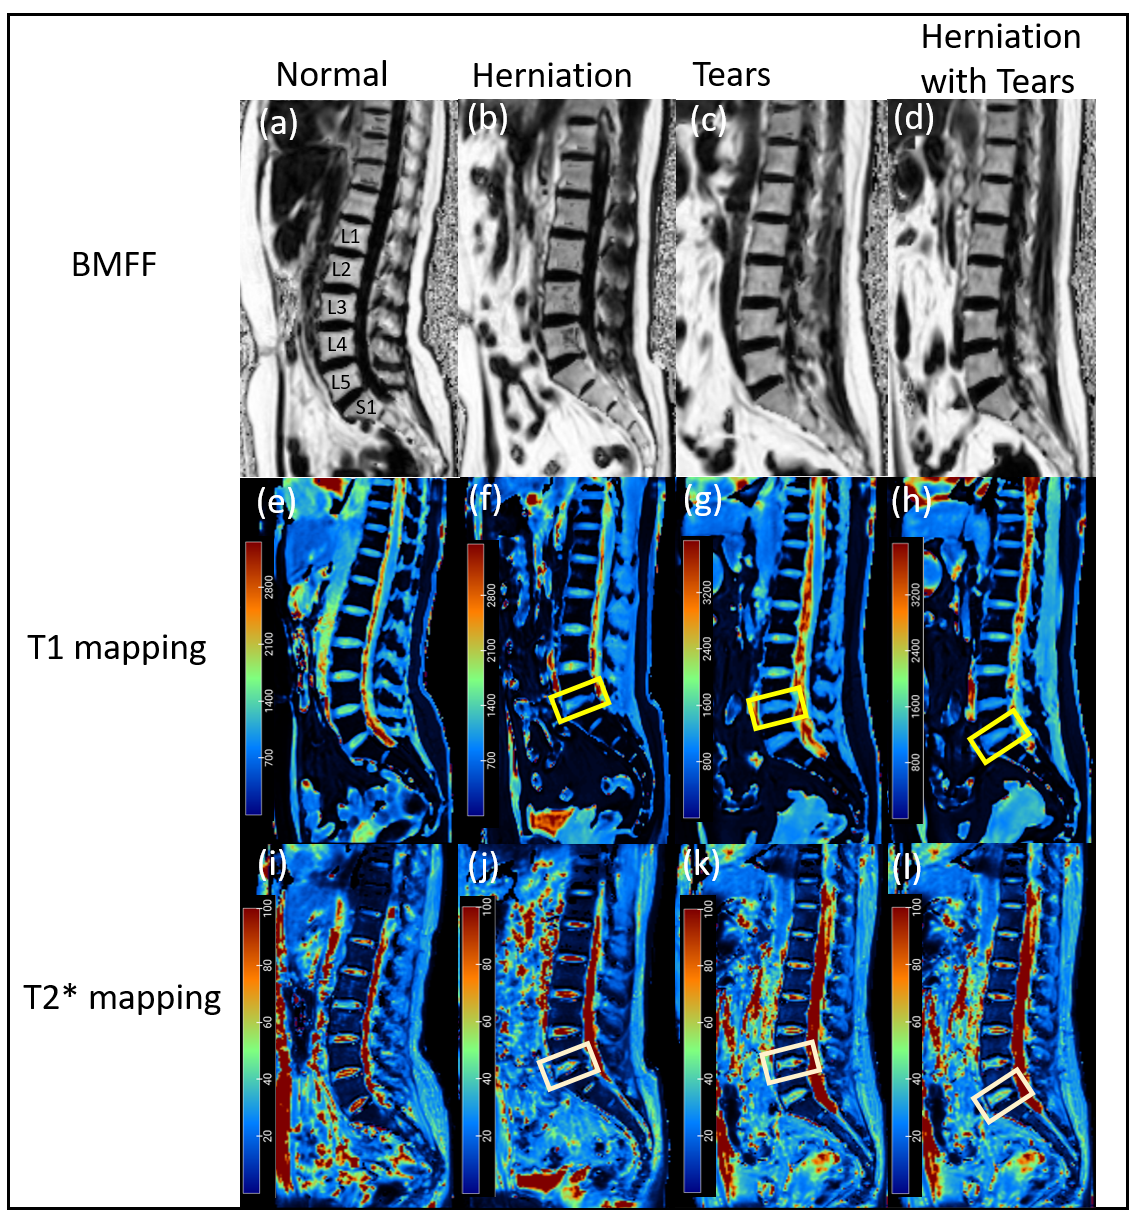
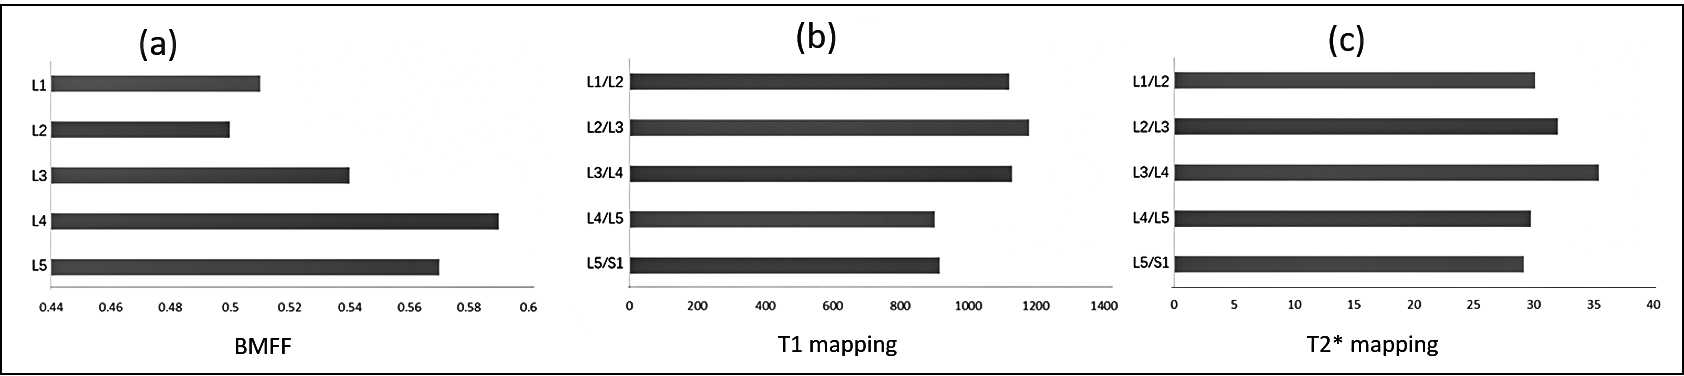
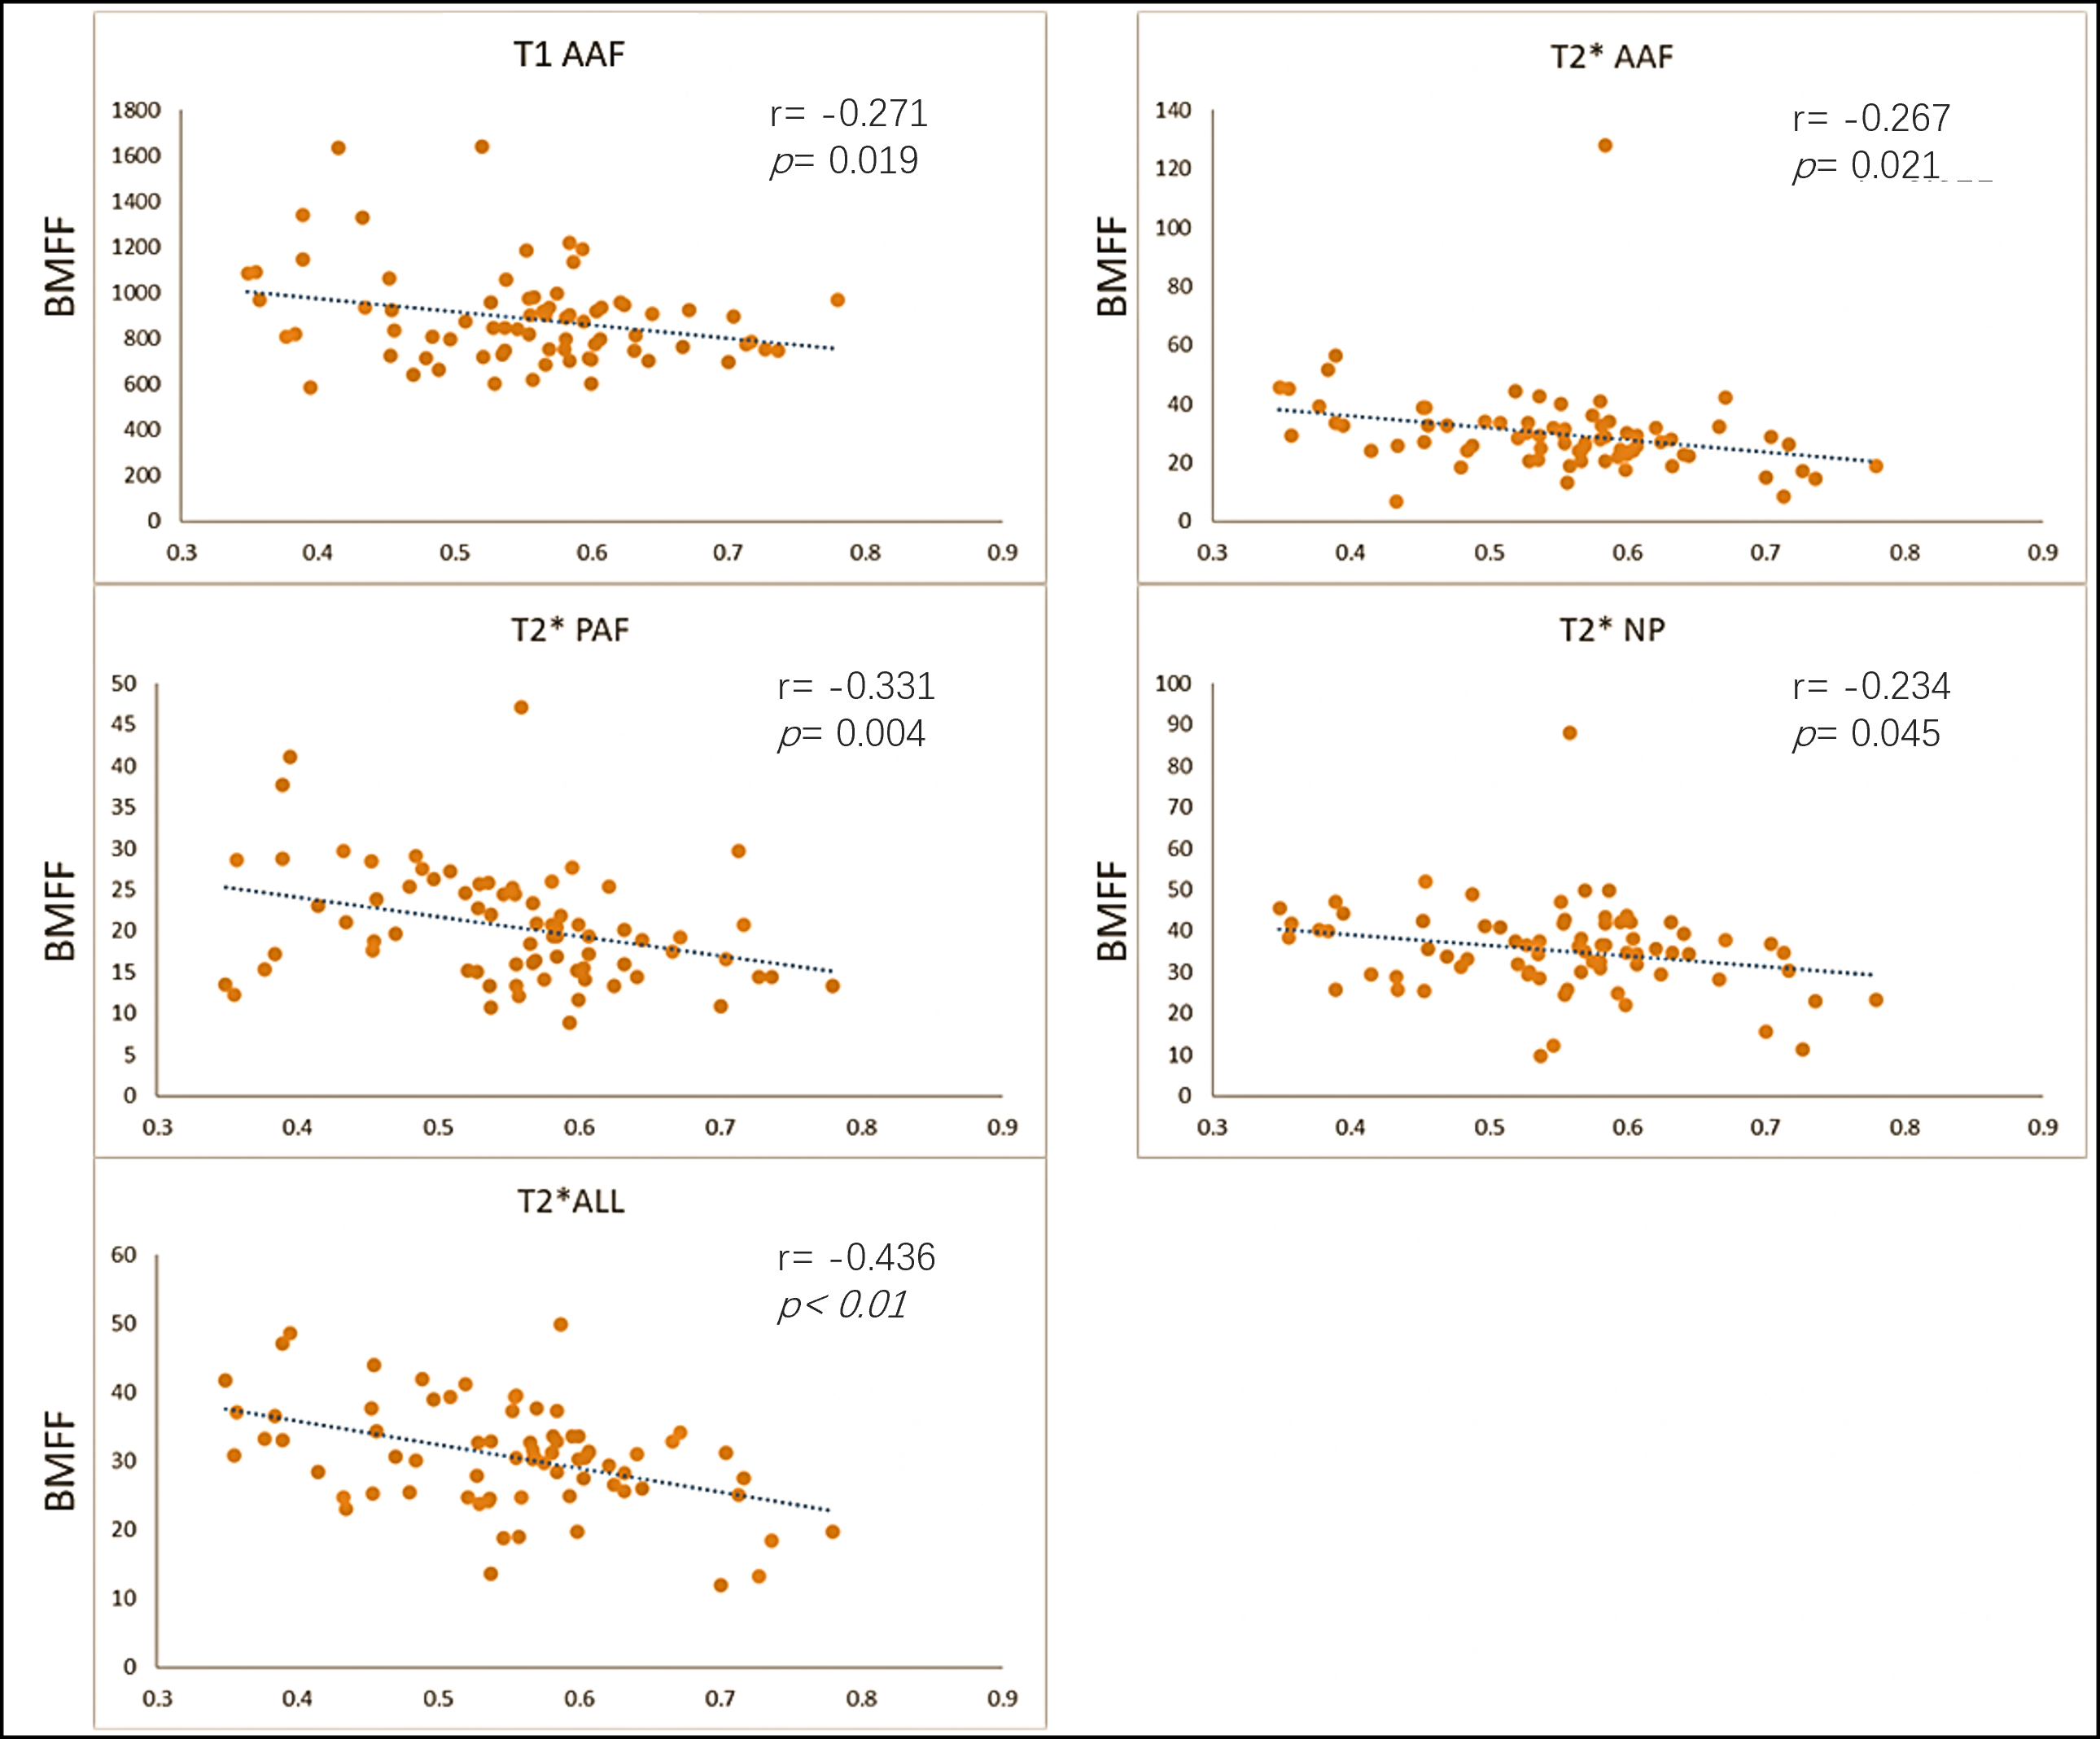
A total of 74 IVDs were analyzed in 30 volunteers (normal: 28 IVDs; herniation: 22 IVDs; annular tear: 17 IVDs; herniation with tear: 7 IVDs), representative mapping was shown in Figure 1.In this study, the bulging discs were excluded as inclusion criteria. The mean BMFF values of lower two lumbar segments (L4-L5) significantly higher than the upper three lumbar segments (L1-L3) in all subjects(p= 0.03). The mean T1 and T2* values showed a decreasing trend from upper three to lower two IVDs (p< 0.01, p= 0.04) (Figure 2). In terms of the mean T1 values, the entire IVDs ROI in the normal group were significantly higher than those in the herniation group (p< 0.01) and the annular tear group (p< 0.01), but not from the herniation with tear group(p> 0.05.) (Table 1). Furthermore, the mean T1 values of NP in normal group were respectively different from those in herniation group (p< 0.01), annular tear group (p< 0.01) and herniation with tear group (p= 0.01). However, in terms of the mean T2* and BMFF values, there was no significant difference among the four groups. Besides, we founded that BMFF was significantly correlated with adjacent IVDs, and was inversely correlated with T1 value (r= -0.271, p= 0.019) and T2* value (r= -0.436, p< 0.01) (Figure 3).Discussion
The trend of BMFF values by TXI from L1 to L5 were similar to other literatures2,3. Our study, to the best of our knowledge, is the first to report the trend of T2* and T1 value in IVDs, and both of them showed a gradually decreasing trend from L1/L5 to L5/S1 IVDs . The T1 values of IVDs in the normal group were significantly different from those in the herniation groups and annular tear groups, especially those in NP, which might be related to the decreased water content in the NP caused by proteoglycan loss of IVD degeneration4. In addition, there were significant inverse relationships between the vertebral BMFF value and adjacent IVDs T1 value, which may be because hematopoietic marrow to fat cells in bone marrow conversion damaged the IVD available nutrition supply5, thereby affecting water content in IVDs.Conclusion
We used TXI technique to achieve rapid and accurate quantitative analysis of the intervertebral disc and vertebrae, expecially showing significant differences in IVDs with herniation or annular tear compared with discs without these abnormalities from T1 mapping.Acknowledgements
The authors thanks for all the people who helped us this time.References
[1] Bydder M, Yokoo T, Hamilton G, et al. Relaxation effects in the quantification of fat using gradient echo imaging. Magn Reson Imaging. 2008;26(3):347-359.
[2] Krug R, Joseph GB, Han M, et al. Associations between vertebral body fat fraction and intervertebral disc biochemical composition as assessed by quantitative MRI. J Magn Reson Imaging. 2019;50(4):1219-1226.
[3] Li X, Xie Y, Lu R, et al. Q-Dixon and GRAPPATINI T2 Mapping Parameters: A Whole Spinal Assessment of the Relationship Between Osteoporosis and Intervertebral Disc Degeneration. J Magn Reson Imaging. 2022;55(5):1536-1546.
[4] Trattnig S, Stelzeneder D, Goed S, et al. Lumbar intervertebral disc abnormalities: comparison of quantitative T2 mapping with conventional MR at 3.0 T. Eur Radiol. 2010;20(11):2715-2722.
[5] Krug R, Joseph GB, Han M, et al. Associations between vertebral body fat fraction and intervertebral disc biochemical composition as assessed by quantitative MRI. J Magn Reson Imaging. 2019;50(4):1219-1226.
Figures