2777
Fast dual-echo ultrashort echo time (UTE) MRI to estimate long T2 fraction in tendons and detect age-and osteoporosis-related differences1Department of Radiology, University of California, San Diego, La Jolla, CA, USA, San Diego, CA, United States, 2Radiology Service, Veterans Affairs San Diego Healthcare System, San Diego, La Jolla, CA, USA, San Diego, CA, United States, 3Department of Orthopedic Surgery, University of California, San Diego, La Jolla, CA, USA, San Diego, CA, United States, 4Department of Medicine, University of California, San Diego, La Jolla, CA, USA, San Diego, CA, United States
Synopsis
Keywords: Tendon/Ligament, Tendon/Ligament
Tendon and bone comprise a special interacting unit. Bone loss in osteoporosis (OPo) may associate with a reduction in tendon quality that needs to be investigated. We investigated the tendon quality differences between OPo patients, osteopenia (OPe) patients, and healthy volunteers with normal bone (Normal) using the Frac-LongT2 index, a rapid measure performed by dual-echo ultrashort echo time (UTE) MRI. The estimated Frac-LongT2 in the anterior and posterior tibialis tendon (ATT and PTT) were significantly higher in the OPo group compared with the Normal group. This study highlights the potential of this rapid UTE-based technique for in vivo tendon assessment.INTRODUCTION
Tendon and bone are complementary tissues that comprise a special interacting unit that are essential for locomotion and individual autonomy (1). The internal mechanical forces applied to these tissues are generated by muscle contractions which affect the strength and microarchitecture of both bone (1,2) and tendon (3). For example, Chen et al., have shown that the tendon’s mechanical strength is significantly correlated with the bone mineral density in an osteoporotic rabbit model (4). Bone loss in osteoporosis (OPo) and in its earlier stage disease, osteopenia (OPe), may be coupled with a reduction in tendon quality. Quantitative and noninvasive imaging evaluation can help to enhance our understanding of the OPo-related changes in tendons and eventually help to improve the diagnosis and treatment OPo. Tendons possess very short T2 relaxation times due to a high concentration of an organized collagenous matrix (5) that results in a low signal-to-noise ratio when imaged using conventional MR sequences. However, the ultrashort echo time (UTE) MRI technique is capable of detecting considerable signal from both the short-T2 and long-T2 components in tendons and can provide quantitative evaluations (6). The long T2 fraction (Frac-LongT2) that can be calculated by the signal ratio in dual-echo UTE imaging (7) (TE≈0 and 2.2 ms) is an example of a rapid UTE-based technique which can be performed in less than 5 mins. This study aims to investigate the differences in Frac-LongT2 of the anterior tibialis tendon (ATT) and posterior tibialis tendon (PTT), between female OPe, OPo, and Normal subjects.METHODS
Institutional review board approval and written informed consent were obtained for all recruited subjects. The lower legs of 14 OPe (72±6 years) and 31 OPo (73±6 years) female patients, as well as 30 participants with normal bone (Normal, 36±19 years), were imaged on a 3T clinical scanner (MR750, GE) using an eight-channel knee coil. The imaging slab was centered in the middle of the tibia. A dual-echo 3D Cones UTE sequence (TR=100 ms, TE=0.032 and 2.2 ms, FA=10°) was performed to estimate the long T2 signal fraction (Frac-LongT2) of tendons as the ratio between the signal at the second echo time (TE=2.2 ms) to the UTE signal. Field-of-view, matrix dimension, nominal voxel size, number of slices, slice thickness, and scan time were 14cm, 160×160×0.87mm, 24, 5mm, and 5 minutes, respectively. The average Frac-LongT2 was calculated for ATT and PTT. The Kruskal–Wallis test by ranks was used to examine the differences in Frac-LongT2 of the tendons between the groups.RESULTS
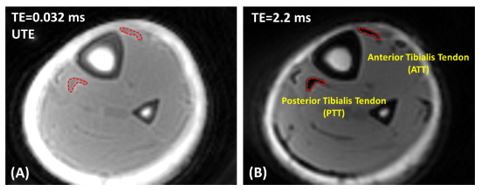
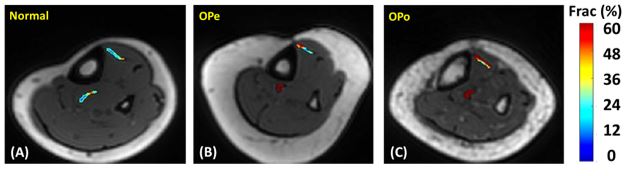
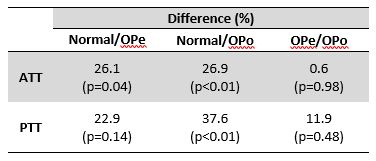
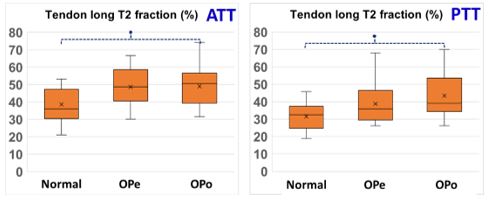
UTE (TE=0.032ms) and second echo (TE=2.2 ms) axial images of the lower leg of a healthy subject are presented in Figure 1. While UTE imaging detects a high signal in tendons it lacks a high-contrast appearance, limiting ROI selection. The second echo image (Fig.1B) was used by the readers to select ROIs covering ATT and PTT. Figure 2 shows Frac-LongT2 maps generated for the tendons of three exemplary participants from the Normal, OPe, and OPo groups. For these examples, Frac-LongT2 was obviously higher for OPe and OPo patients compared with Normal participants. Figure 3 (Table 1) presents the estimated average and standard deviation (SD) values of Frac-LongT2 in ATT and PTT of participants from Normal, OPe, and OPo groups. The percentage differences and statistical significances of Frac-LongT2 between the Normal, OPe, and OPo groups are presented in Figure 4 (Table 2). Frac-LongT2 in ATT and PTT was significantly higher for OPo compared with the Normal group. The Normal/OPo difference was larger in the ATT than PTT (26.9 and 37.6% in ATT and PTT, respectively). However, the Frac-T2 differences between Normal vs OPe groups and OPe vs OPo groups were not significant. Figure 5 depicts the average, median, SD, and the first and third quartiles Frac-LongT2 for each studied group using box and whisker plots. Significant differences are indicated with dashed lines between groups and highlighted with an asterisk.DISCUSSION
This study investigated the differences in Frac-LongT2 in lower leg tendons between OPo, OPe, and Normal subjects. The rapid UTE-MRI-based technique for quantitative tendon evaluation can be considered for translational applications due to its simplicity and time efficiency. Significantly different Frac-LongT2 was found between the tendons of Normal and OPo groups, demonstrating the potential of the simple dual-echo UTE technique in tendon quality assessment over a spectrum of bone diseases. The potential magic-angle sensitivity of this technique may be a confounding factor that requires future investigationsCONCLUSION
The Frac-LongT2 index, as a rapid UTE-MRI-based technique, can be considered as a useful tool to detect and monitor tendon quality changes in individuals affected by bone-related diseases. Frac-LongT2 was significantly higher in patients with OPo compared with normal participants.Acknowledgements
The authors acknowledge grant support from the National Institutes of Health (R01AR068987, R01AR062581, R01AR075825, K01AR080257, R01AR079484, and 5P30AR073761), Veterans Affairs Clinical Science R&D (I01CX001388 and I01CX000625), and GE Healthcare.References
1. Edwards MH, Dennison EM, Aihie Sayer A, Fielding R, Cooper C. Osteoporosis and sarcopenia in older age. Bone 2015;80:126–130 doi: 10.1016/j.bone.2015.04.016.
2. Cederholm T, Cruz-Jentoft AJ, Maggi S. Sarcopenia and fragility fractures. Eur J Phys Rehabil Med 2013;49:111–117.
3. Boesen AP, Dideriksen K, Couppé C, et al. Effect of growth hormone on aging connective tissue in muscle and tendon: Gene expression, morphology, and function following immobilization and rehabilitation. J Appl Physiol 2014;116:192–203 doi: 10.1152/japplphysiol.01077.2013.
4. Chen X, Giambini H, Ben-Abraham E, An KN, Nassr A, Zhao C. Effect of bone mineral density on rotator cuff tear: An osteoporotic rabbit model. PLoS ONE 2015;10:1–12 doi: 10.1371/journal.pone.0139384.
5. Chang EY, Du J, Chung CB. UTE imaging in the musculoskeletal system. Journal of Magnetic Resonance Imaging 2015;41:870–883 doi: 10.1002/jmri.24713.
6. Afsahi AM, Ma Y, Jang H, et al. Ultrashort Echo Time Magnetic Resonance Imaging Techniques: Met and Unmet Needs in Musculoskeletal Imaging. Journal of Magnetic Resonance Imaging 2022;55:1597–1612 doi: 10.1002/jmri.28032.
7. Rajapakse CS, Bashoor-Zadeh M, Li C, Sun W, Wright AC, Wehrli FW. Volumetric Cortical Bone Porosity Assessment with MR Imaging: Validation and Clinical Feasibility. Radiology 2015;276:526–35 doi: 10.1148/radiol.15141850.
Figures