2774
Initial evaluation of PETRA UTE imaging at 7T in a phantom and musculoskeletal tissue specimen1Stephens Family Clinical Research Institute, Carle Clinical Imaging Research Program, Carle Health, Urbana, IL, United States, 2Carle Illinois Advanced Imaging Center, Urbana, IL, United States
Synopsis
Keywords: MSK, High-Field MRI, zero echo time; ultrashort echo time; UTE; ZTE
Ultrashort echo-time MRI allow signal acquisition from tissues with ultrashort (<1 ms) T2*. We evaluated repeatability, SNR, acquisition time, and potential for T2* mapping using a modified PETRA sequence at 7T. Signal values were repeatable, and subtraction imaging was both feasible and consistent with those previously reported. T2* mapping had lower repeatability and may require improved modeling of TE-dependent k-space filling strategy effects. Short- and long-TE PETRA imaging was feasible at 7T in a phantom and ex vivo specimen. These initial results will serve as guidance for further optimization/potential applications.Introduction
Ultrashort echo-time (UTE)/zero echo-time (ZTE) MRI allow signal acquisition from tissues with ultrashort (<1 ms) T2*. This allows qualitative and quantitative evaluation of structures such as bone, tendon, calcified cartilage, meniscus, and others1,8,14.Pointwise Encoding Time Reduction with Radial Acquisition (PETRA) allows 3D isotropic imaging with echo times (TE) <0.1 ms by applying the readout gradients prior to the radiofrequency pulse and combining radial half-projection filling of the outer portions of k-space with single pointwise Cartesian filling of the central portions of k-space that are missed during the transmit/receive switching delay2,6. PETRA has been applied to imaging of bone, meniscus, frozen tissue etc. at 1.5-7T with a single UTE-range TE1,7–10,13, subtraction imaging for improved visualization of ultrashort-T2 structures or pathology3 (dual-TE implementations), and UTE quantitative mapping11,12 (dual-/multi-TE) at 1.5 and 3T.
Creation of long-T2 tissue suppression subtraction imaging or quantitative T2* mapping require at least one TE that is long enough for signal in the tissue of interest to have decreased by more than that of surrounding long-T2 tissue or to be approaching noise level. In this work we performed initial evaluation of a modified PETRA sequence, with an extended maximum TE, at 7T in a phantom and an elbow joint specimen over a range of TE values to assess signal change with changing TE in a range of ultrashort-to-long T2 substances and tissues.
Methods
Pulse sequence modification: We modified the single-TE PETRA sequence by extending the maximum TE from 0.10 ms to 1.10 ms. This TE extension increased the size of the inner k-space portion filled with the single pointwise Cartesian approach and reduced the amount of outer k-space filling using radial sampling. As a consequence, the signal acquisition time, and consequently the echo time, are increased.Phantom experiment: A phantom containing various mixtures of deionized water, agarose, and MnCl2 tetrahydrate (Figure 1) was created, stored under refrigeration, and then allowed to come to room temperature before imaging with a 7T MRI scanner (Magnetom Terra 7T, Siemens) and a 28-channel knee coil (Quality Electrodynamics). Repeated acquisitions with the modified PETRA were used, with all parameters (TR=8.28ms; matrix=96; pixel size=1.56mm3; flip angle=6°; FOV=150mm3; 1500 spokes; pixel bandwidth=370Hz; fat suppressed) held constant and TE values of 0.07-0.25 in 0.03 ms increments, 0.30, 0.35, 0.40, 0.50, 0.65, and 0.70 ms. Data were exported with and without 2D distortion correction. Repeat scans within one scan session at TE = 0.07 ms and two separate scan sessions with all TEs were acquired to test repeatability.
Ex vivo porcine elbow experiment: A cut of pork containing the elbow joint and surrounding soft tissues was imaged using the same parameters as above, but with different TEs (TE = 0.07, 0.10, 0.13, 0.19, 0.25, 0.45, and 0.50 ms) and increased resolution in order to improve the visualization of the anatomic details. Therefore, the TR was set to 8.20ms; matrix=208; pixel size=0.82mm3; FOV=170 mm3; 60,000 spokes; pixel bandwidth=170Hz.
Results
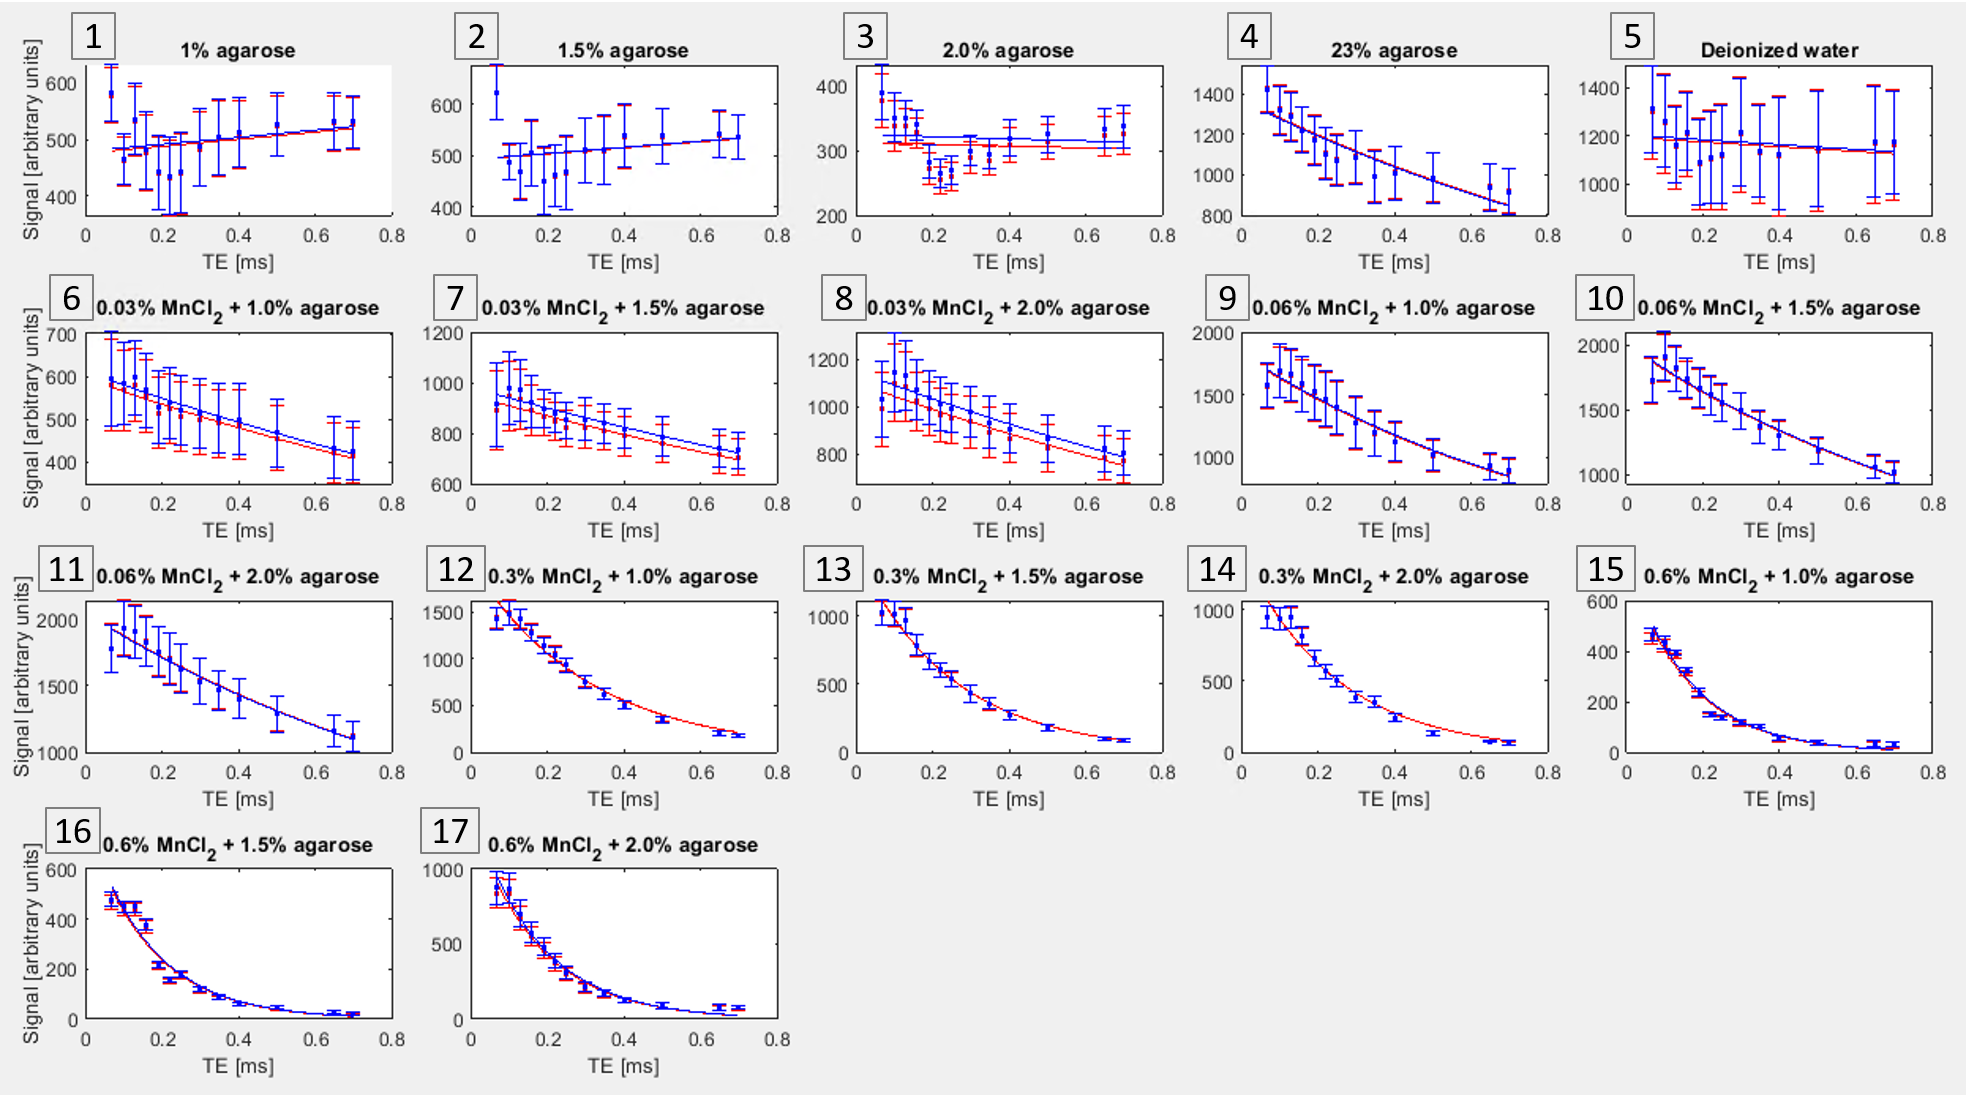
Figure 2 shows comparisons between high-resolution PETRA images (0.72mm isotropic, TE = 0.07ms, acquisition time (TA) 7:33 (min:sec)) and short-TE conventional imaging to illustrate differences in signal in UTE-range phantom solutions and specimen tissues (bone, expected T2* ~0.4-0.7ms4,5; tendon expected T2* ~1.5ms4). At the phantom scan parameter settings (1.56mm3 voxels, etc.) TA per scan was 2:14-3:57 for TE = 0.07-0.40ms, and 5:53-12:00 for TE = 0.50-0.70ms.Signal to noise ratio (SNR) in the phantom was 3-176 (lowest-highest signal solutions) at TE=0.70ms and 31-150 at TE = 0.07ms. Figure 3 shows T2* fitting results. For samples expected to have long T2* values, signal decreased and then increased over the shorter TEs, prior a monotonic signal decrease. Distortion correction had a small impact on the measured signal (average 1% difference). Distortion correction had a minimal effect on the calculated T2* values (average 1% difference).
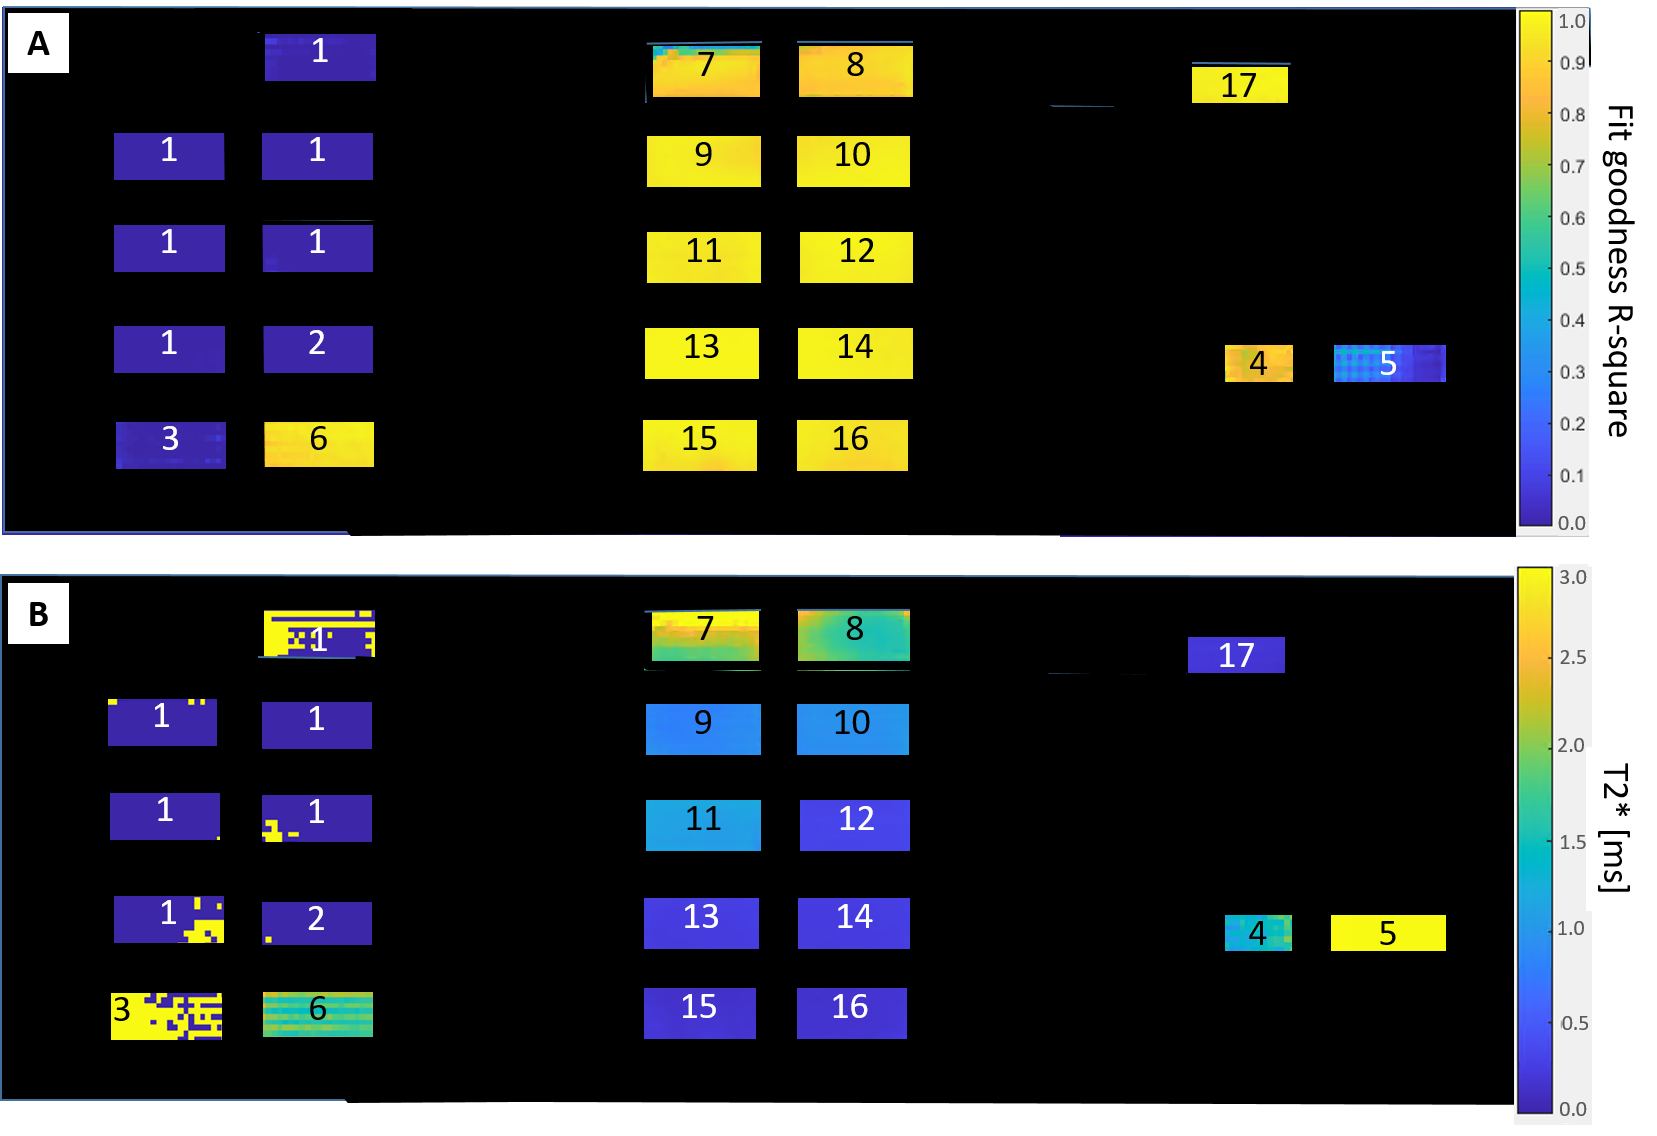
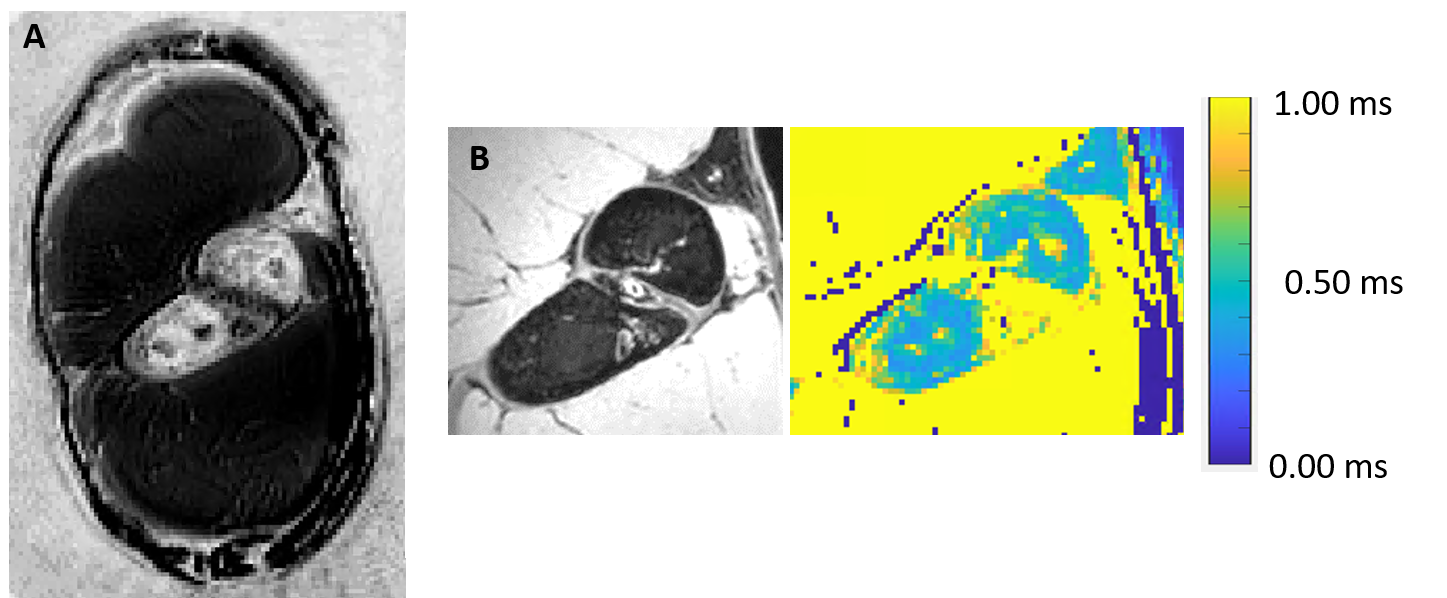
Repeat phantom scans within a single scan session (using TE=0.07ms) showed 2% mean signal variation between scans (range 0 – 5%). T2* values for separate scan sessions differed by 14% on average over the range of phantom solutions (solutions 1-3 and 5 excluded due to poor fit of the exponential decay curve for long T2* substances). Figure 4 shows T2* maps and fit goodness maps for the phantom and Figure 5 shows an example subtraction image and T2* map image for the elbow specimen. Cortical bone T2* was similar to that reported in the literature for 7T5.
Discussion
We evaluated repeatability, SNR, acquisition time, and potential for T2* mapping and subtraction image creation from multiple acquisitions at various TEs. Scan time increase markedly at longer TEs, limiting resolution and maximum TE, but were practically feasible. SNR was generally good but limited for very short T2* substances (<0.20 ms) at longer TEs. Signal values were repeatable, and subtraction imaging was feasible and consistent with those previously reported. T2* mapping had lower repeatability and is currently limited by the absence of a model incorporating TE-dependent k-space filling strategies into the signal equation.Conclusions
Short- and long-TE PETRA imaging was feasible at 7T in a phantom and ex vivo specimen. These initial results will serve as guidance for further optimization/potential applications.Acknowledgements
This work was supported by the following funding sources: NIH/NIAMS 1 R01 AR073831; Carle Illinois Advanced Imaging Center developmental awardReferences
1. Froidevaux R, Weiger M, Brunner DO, Dietrich BE, Wilm BJ, Pruessmann KP. Filling the dead‐time gap in zero echo time MRI: Principles compared. Magn Reson Med. 2018;79(4):2036-2045. doi:10.1002/mrm.26875
2. Grodzki DM, Jakob PM, Heismann B. Ultrashort echo time imaging using pointwise encoding time reduction with radial acquisition (PETRA). Magn Reson Med. 2012;67(2):510-518. doi:10.1002/mrm.23017
3. Ibrahim ESH, Cernigliaro JG, Pooley RA, et al. Detection of different kidney stone types: an ex vivo comparison of ultrashort echo time MRI to reference standard CT. Clin Imaging. 2016;40(1):90-95. doi:10.1016/j.clinimag.2015.09.005
4. Juras V, et al. 1H Relaxation Properties of Achilles Tendons Measured by 3D-UTE at 3T and 7T: a Feasibility Study. In: Proceedings of the International Society for Magnetic Resonance in Medicine. 2011.
5. Krug R, Larson PEZ, Wang C, et al. Ultrashort echo time MRI of cortical bone at 7 tesla field strength: a feasibility study. J Magn Reson Imaging JMRI. 2011;34(3):691-695. doi:10.1002/jmri.22648
6. Larson PEZ, Han M, Krug R, et al. Ultrashort echo time and zero echo time MRI at 7T. Magn Reson Mater Phys Biol Med. 2016;29(3):359-370. doi:10.1007/s10334-015-0509-0
7. Lee YH, Suh JS, Grodzki D. Ultrashort echo (UTE) versus pointwise encoding time reduction with radial acquisition (PETRA) sequences at 3 Tesla for knee meniscus: A comparative study. Magn Reson Imaging. 2016;34(2):75-80. doi:10.1016/j.mri.2015.09.003
8. Li C, Magland JF, Zhao X, Seifert AC, Wehrli FW. Selective in vivo bone imaging with long- T2 suppressed PETRA MRI. Magn Reson Med. 2017;77(3):989-997. doi:10.1002/mrm.26178
9. Lonzetti L, Zanon M, Pacini GS, et al. Magnetic resonance imaging of interstitial lung diseases: A state-of-the-art review. Respir Med. 2019;155:79-85. doi:10.1016/j.rmed.2019.07.006
10. Seifert AC, Li C, Wilhelm MJ, Wehrli SL, Wehrli FW. Towards quantification of myelin by solid-state MRI of the lipid matrix protons. NeuroImage. 2017;163:358-367. doi:10.1016/j.neuroimage.2017.09.054
11. Sharafi A, Baboli R, Chang G, Regatte RR. 3D‐T1ρ prepared zero echo time‐based PETRA sequence for in vivo biexponential relaxation mapping of semisolid short‐T2 tissues at 3 T. J Magn Reson Imaging. 2019;50(4):1207-1218. doi:10.1002/jmri.26664
12. Tokuda J, Tuncali K, Kok L, et al. Preliminary evaluation of R2*-based temperature mapping for predicting the kill zone in MRI-guided renal cryoablation. In: ; May 07-08.
13. Tokuda J, Wang Q, Tuncali K, Seethamraju RT, Tempany CM, Schmidt EJ. Temperature-Sensitive Frozen-Tissue Imaging for Cryoablation Monitoring Using STIR-UTE MRI: Invest Radiol. 2020;55(5):310-317. doi:10.1097/RLI.0000000000000642
14. Zibetti MVW, Johnson PM, Sharafi A, Hammernik K, Knoll F, Regatte RR. Rapid mono and biexponential 3D-T1ρ mapping of knee cartilage using variational networks. Sci Rep. 2020;10(1):19144. doi:10.1038/s41598-020-76126-xFigures
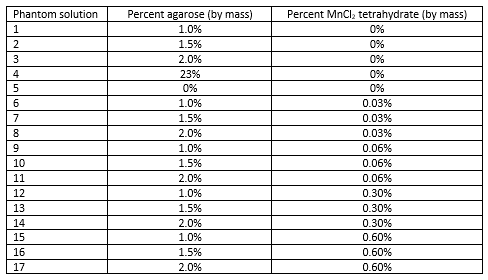
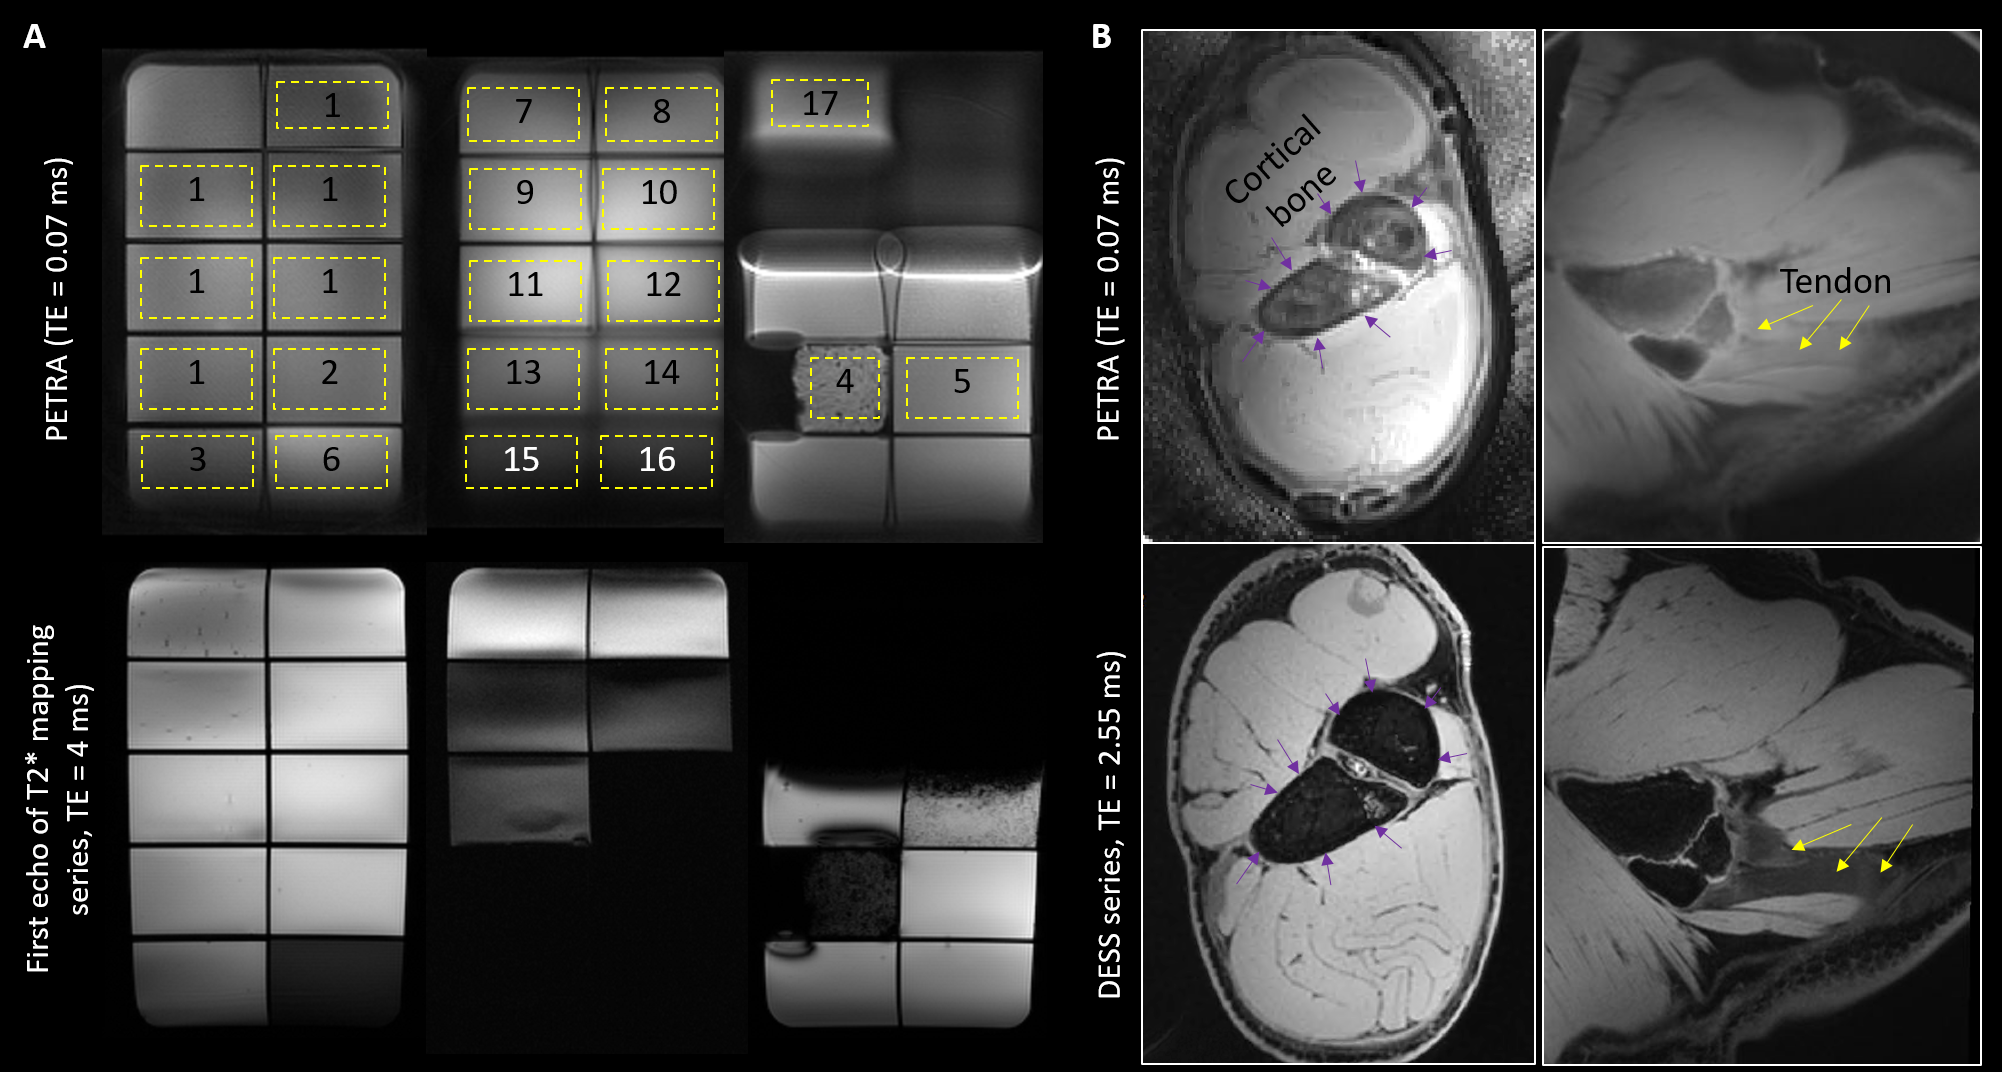
Figure 2: Comparison between PETRA images at TE = 0.07 ms (top row) for the phantom compared to the first echo of a conventional T2* mapping sequence at TE = 4.0 ms (panel A) and for the porcine shoulder compared to a water-excitation dual-echo steady state (DESS) at TE = 2.55 ms. Numbered yellow rectangles correspond to numbering of solutions listed in Figure 1, rectangle borders indicate drawn regions of interest.