2772
Alteration in microcirculation with osteonecrosis of the femoral head: Study on Dynamic Contrast-enhanced MRI1Affiliated Hospital of Nanjing University of Chinese Medicine, Jiangsu Nanjing, China, 2MR Research China, GE Healthcare, Beijing, China
Synopsis
Keywords: Joints, DSC & DCE Perfusion
Osteonecrosis of femoral head (ONFH) occurs due to a defect in the blood supply to the femoral head. In this study, Contrast-Enhanced Magnetic Resonance Imaging (DCE-MRI) was applied to ONFH patients in different stages to explore the perfusion changes in the progression of the severity of ONFH. It was found that perfusion in the necrotic area was persistently reduced, while in the repair reaction areas, perfusion was progressively enhanced. DCE-MRI can sensitively detect the perfusion changes of ONFH and potentially could predict ONFH development.Introduction
Osteonecrosis of femoral head (ONFH) is a common and refractory clinical disease in orthopedics. (1) It is widely considered that the decrease in blood flow to the femoral head is the main cause of ONFH. (2,3) Therefore, early assessment of blood perfusion may be helpful for the early diagnosis and treatment of ONFH. Dynamic Contrast-Enhanced Magnetic Resonance Imaging (DCE-MRI) is a non-invasive method to evaluate tissue perfusion and microvascular status, which has been mainly applied in the studies of tumors. (4) In the field of orthopedics, DCE-MRI has been used to assess fracture prognosis and skeletal microcirculatory perfusion in patients with osteoporosis. (5,6) However, few researches have studied the feasibility of DCE-MRI in the progression of ONFH. Thus, in this study, DCE-MRI was applied to patients with different stages of ONFH to investigate the role of perfusion-related parameters in evaluating the ONFH progression.Methods
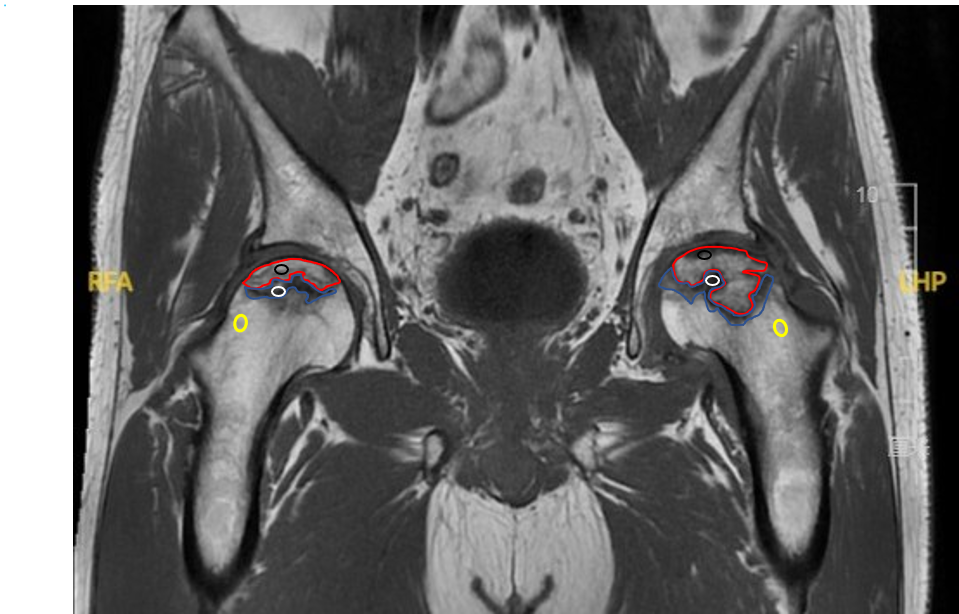
A total of 37 participants were enrolled in this prospective study. All experiments were performed on a 3T MRI (SIGNA Architect) with an Air coil. Differential subsampling with Cartesian ordering (DISCO) sequence was used for DCE scan with the following parameters: TR=4.2ms, TE=1.5ms, slice thickness=1.0mm, matrix size=360×360, FOV=36×36cm. Before DISCO imaging, gadoteric acid meglumine salt (0.4 mL/kg) was injected at a rate of 3 mL/s. DISCO scans were initiated 10 seconds after the onset of contrast agent administration, and a total of 15 arterial phases were acquired, each with a duration of 12.7s. Data post-processing was performed using GenIQ software from GE. Six parameters were obtained, including the contrast enhancement ratio (CER), initial area under the gadolinium curve (IAUGC), maximum slope of increase (MaxSlope), volume transfer constant (Ktrans), rate transfer constant (Kep) and extracellular space volume per unit volume of tissue (Ve). Three regions of interest (ROIs) were drawn in the necrotic, repaired, and trochanteric areas of the patient’s femur by two experienced radiologists. The average values of the two measurements were used for the following analysis. According to the ARCO classification, (7) the ONFH was classified into two stages: ARCO Ⅱ and ARCO Ⅲ. In the 74 femoral heads of 37 patients, there were 33 ARCO Ⅱ ONFH and 34 ARCO Ⅲ ONFH. Trochanteric areas corresponding to these 67 ONFH were delineated for comparison. All statistics were performed in SPSS (version 25.0, Chicago, IL, USA). The Kolmogorov–Smirnov test was used to detect the normality of the distribution for the six parameters, then independent sample t test was adopted to compare the differences between the parameters in different ROIs. P<0.05 was considered statistically significant.Results
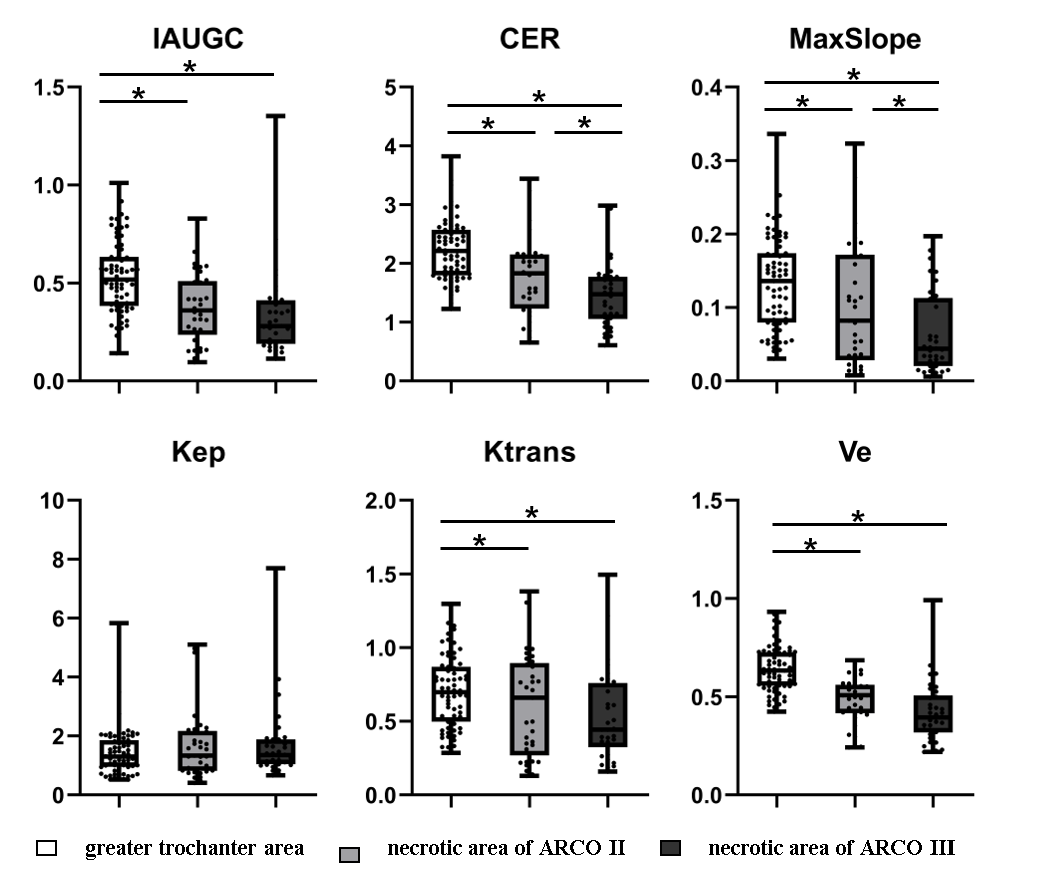
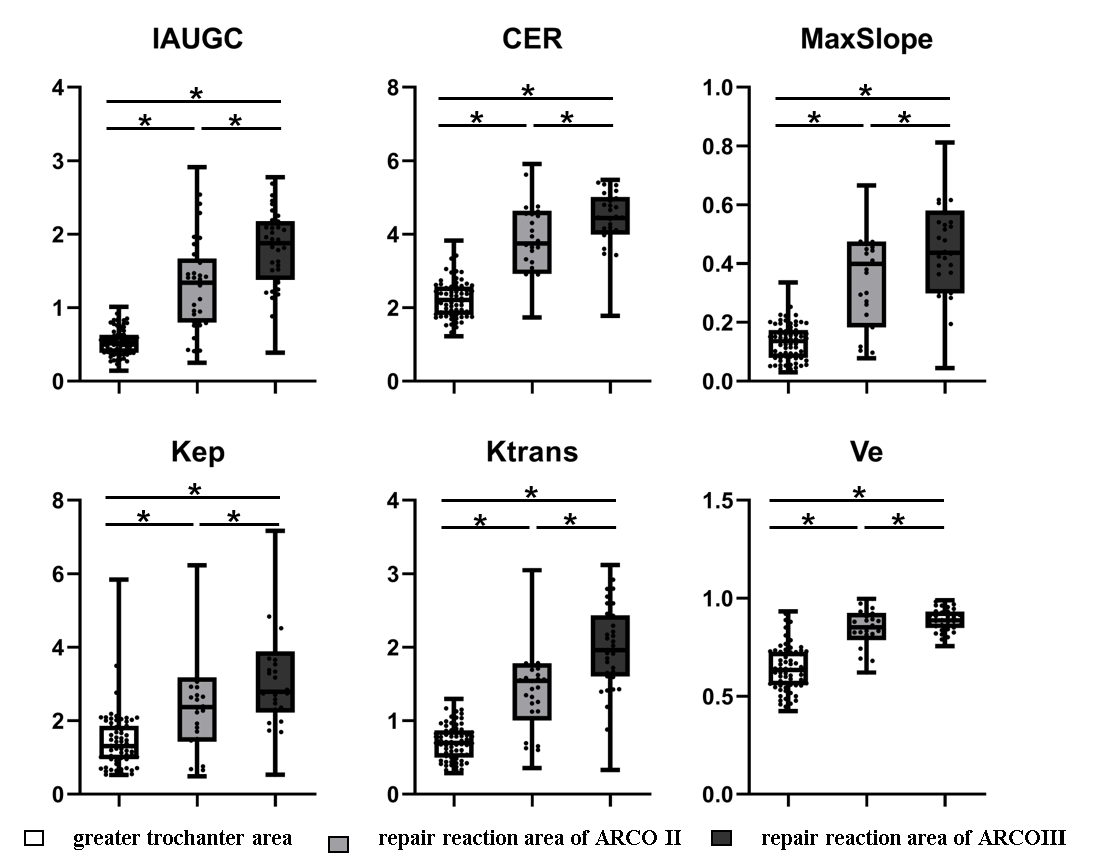
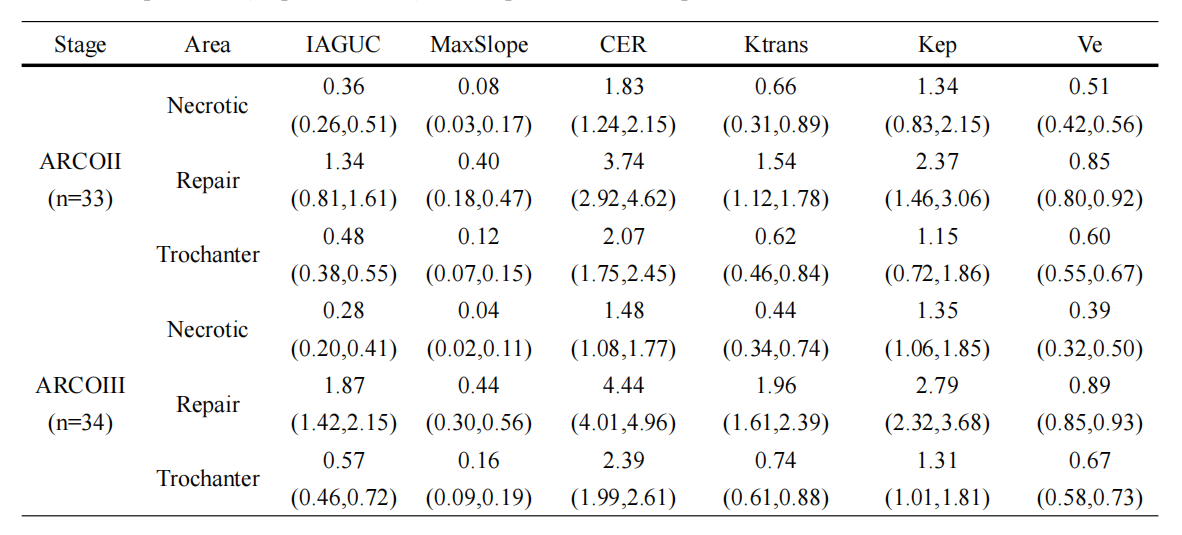
Fig. 1 shows the ROI selection on a representative patient. The parameter value of the greater trochanter area represented the value of normal bone tissue. All the parameter values were shown in Table 1. For the ROI of the necrotic area, CER, IAUGC, MaxSlope, Ktrans and Ve of ARCO Ⅱ and ARCO Ⅲ were significantly lower than those in the greater trochanter area of the same femur head (P<0.05). (Fig. 2) For the comparison of the necrotic area between ARCO Ⅱ and ARCO Ⅲ, CER and MaxSlope in ARCO Ⅲ were significantly lower than those in ARCO Ⅱ, while the differences of IAUGC, Kep, Ktrans, and Ve in the two groups were not statistically significant (P > 0.05). In the repair reaction areas, (Fig. 3) all parameters of ARCO Ⅱ and ARCO Ⅲ were significantly higher than those of the greater trochanter area. Similar t tests comparing the parameters in the repair reaction areas of ARCO Ⅱ and ARCO Ⅲ were also statistically significant, with higher parameter values in ARCO Ⅲ (P<0.05).Discussion
With the progression of the severity of ONFH, the values of CER and MaxSlope in necrotic areas were gradually decreased, while CER, IAUGC, MaxSlope, Ktrans, Kep, and Ve in the repair reaction areas were significantly increased, indicating that DCE-MRI was useful to evaluate the progression of ONFH disease. The enhanced perfusion in the repair reaction areas might be correlated with the increased capillary permeability, (8) while the low perfusion in the necrotic areas may be due to the intravascular thrombus formation and extravascular fat deposition. (9) In the future study, angiographic analyses will be introduced to further verify the hemodynamic changes observed by DCE-MRI in this study.Conclusion
DCE-MRI can detect the perfusion changes in the progression of ONFH disease, showing a potential to identify the extent of necrosis, which might be helpful to guide appropriate treatment.Summary of Main Findings
DCE-MRI is a sensitive tool for ONFH detection and might be helpful in ascertaining ONFH progression and formulating a plan of care.Acknowledgements
No acknowledgement found.References
1. Liang D, Pei J, Zhang L, Ling H, Liu Y, Chen XJJoOS, Research. Treatment of pre-collapse non-traumatic osteonecrosis of the femoral head through Orthopdische Chirurgie München approach combined with autologous bone mixed with β-tricalcium phosphate porous bioceramic bone graft: a retrospective study of mid-term results. 2021;16(1):1-9.
2. Moya-Angeler J, Gianakos AL, Villa JC, Ni A, Lane JMJWjoo. Current concepts on osteonecrosis of the femoral head. 2015;6(8):590.
3. Chen Y, Miao Y, Liu K, Xue F, Zhu B, Zhang C, Li GJJoOT. Evolutionary course of the femoral head osteonecrosis: histopathological-radiologic characteristics and clinical staging systems. 2022;32:28-40.
4. Gordon Y, Partovi S, Müller-Eschner M, Amarteifio E, Bäuerle T, Weber M-A, Kauczor H-U, Rengier FJCd, therapy. Dynamic contrast-enhanced magnetic resonance imaging: fundamentals and application to the evaluation of the peripheral perfusion. 2014;4(2):147.
5. Dyke JP, Lazaro LE, Hettrich CM, Hentel KD, Helfet DL, Lorich DGJJoMRI. Regional analysis of femoral head perfusion following displaced fractures of the femoral neck. 2015;41(2):550-554.
6. Biffar A, Sourbron S, Dietrich O, Schmidt G, Ingrisch M, Reiser MF, Baur-Melnyk AJEjor. Combined diffusion-weighted and dynamic contrast-enhanced imaging of patients with acute osteoporotic vertebral fractures. 2010;76(3):298-303.
7. Zhao D, Zhang F, Wang B, Liu B, Li L, Kim S-Y, Goodman SB, Hernigou P, Cui Q, Lineaweaver WCJJoot. Guidelines for clinical diagnosis and treatment of osteonecrosis of the femoral head in adults (2019 version). 2020;21:100-110.
8. Malizos KN, Zibis AH, Dailiana Z, Hantes M, Karahalios T, Karantanas AHJEjor. MR imaging findings in transient osteoporosis of the hip. 2004;50(3):238-244.
9. Sheng H, Zhang G, Wang YX, Yeung DKW, Griffith JF, Leung KS, Qin LJJoOR. Functional perfusion MRI predicts later occurrence of steroid‐associated osteonecrosis: An experimental study in rabbits. 2009;27(6):742-747.
Figures