2768
Sodium 23Na-MRI reveals elevated sodium content in lower-extremity skin and adipose tissue in peripheral arterial disease1Institute of Imaging Science, Vanderbilt University Medical Center, Nashville, TN, United States, 2Radiology & Radiological Sciences, Vanderbilt University Medical Center, Nashville, TN, United States, 3Cardiovascular Medicine, Vanderbilt University Medical Center, Nashville, TN, United States, 4Biomedical Engineering, Vanderbilt University, Nashville, TN, United States, 5Cardiovascular Medicine, Scripps Memorial Hospital La Jolla, San Diego, CA, United States, 6Neurology, Vanderbilt University Medical Center, Nashville, TN, United States, 7Psychiatry and Behavioral Sciences, Vanderbilt University Medical Center, Nashville, TN, United States, 8Internal Medicine, University of Texas Southwestern Medical Center, Dallas, TX, United States
Synopsis
Keywords: MSK, Atherosclerosis, Multi-Nuclear, Peripheral Disease
Peripheral artery disease (PAD) is an atherosclerotic occlusive disease that reduces lower-limb perfusion, causes ambulatory dysfunction, and leg pain. Sodium imaging (23Na-MRI) may reveal areas of increased tissue sodium deposition related to the mechanisms of PAD dysfunction. We found that patients with PAD showed increased tissue sodium content in skin, subcutaneous adipose tissue (SAT), and inter-muscular adipose tissue (IMAT) compared to controls. Participants with PAD had lower SAT volume and fat content, arguing against a positive relationship between fat as the mediator of increased tissue sodium. 23Na-MRI may inform PAD mechanisms and is being investigated in response to PAD therapies.Introduction
Peripheral Artery Disease (PAD) is a cardinal manifestation of atherosclerosis that affects 8.5 million Americans. This disease causes significant ambulatory impairment, functional decline, loss of mobility, and pain that is resistant to available clinical therapies1. Patients with PAD have decreased lower extremity arterial perfusion caused by atherosclerotic narrowing that restrict blood flow distally, resulting in repetitive ischemia-reperfusion injury, oxidative stress, and abnormal carbohydrate and lipid metabolism2. These induce a metabolic reprogramming that impairs skeletal muscle and microvascular function associated with limb functional impairment. Lower-limb PAD is associated with cardiovascular morbidity and mortality, with significant risk factors including hypertension, smoking, and diabetes3.Recent sodium magnetic resonance imaging (23Na-MRI) techniques have been used to measure extra-vascular tissue sodium storage in patients with hypertension4. Additionally, tissue sodium storage is inflammatory and is associated with aging and pain5. In this multi-nuclear study, we investigated 23Na-MRI methods to measure lower-limb tissue sodium content in patients with PAD compared to healthy controls subjects, as well as 1H-MRI methods to examine adipose tissue content, to test the possible metabolic mechanisms of PAD. We make statistical comparisons of sodium deposition, fat-water ratio, and volumetric measures to test the possible mechanisms of our group differences. Our main hypothesis is that tissue sodium content will be higher in the lower extremities of patients with PAD compared to healthy control subjects.
Methods
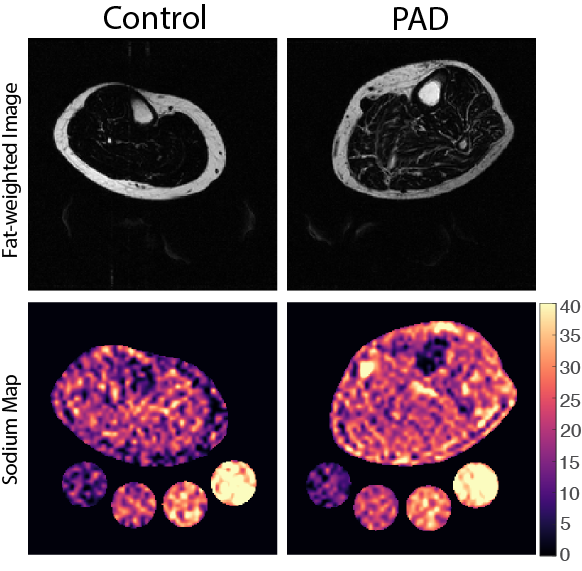
Subjects: Adult volunteers (n=14; 7 PAD, 7 Control) provided written informed consent in accordance with the Vanderbilt University Medical Center Institutional Review Board. Participants underwent screening to determine eligibility based on physical examination and medical history. Exclusion criteria included MRI contraindications, ailment that could limit walking, and recent active severe medical illness (i.e., myocardial infarction, cirrhosis, advance malignancy, severe kidney disease).Data acquisition & processing: Noninvasive 1H/23Na-MRI was performed on a 3.0T Philips Ingenia (Philips Healthcare, Best, The Netherlands) that incorporated the capability for multi-nuclear imaging. The participant’s calf was placed in a quadrature, single-tuned 23Na knee coil (Rapid Biomedical GmbH, Rimpar, Germany), and the offset frequency of 23Na (∆𝜔0=33.8MHz±1150Hz) was measured and set for each scan. Sodium 23Na-MRI was acquired using a 3D gradient-echo sequence: TR/TE=130/0.99 ms; field-of-view (FOV)=192x192mm2, spatial resolution=3x3x30mm3; flip angle=90°; number signal acquisitions=26; scan duration=15 minutes. Four aqueous sodium standards containing 10, 20, 30, and 40 mmol/L NaCl were used for signal calibration. In an identical FOV, proton-weighted 1H-MRI was acquired with the body coil using the multi-point Dixon method: TR/TE1/TE2 =200ms/1.15ms/2.30ms; in-plane spatial resolution=1x1mm2; slice thickness=5mm; flip angle=90°; number signal acquisitions=2; scan duration=4 minutes. Representative images for both groups are detailed (Figure 1).
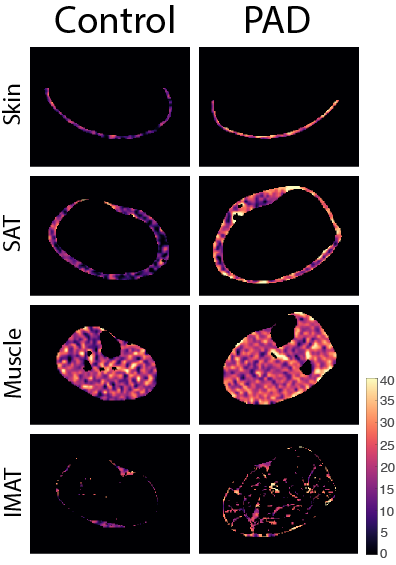
Statistical analysis & hypothesis testing: A tissue sodium content (TSC) map was calculated based on a linear calibration of 23Na-MRI signal in aqueous sodium standards. Regions of interest (ROIs) were manually segmented on the water- and fat-weighted Dixon MRI to separate skin, muscle, subcutaneous adipose tissue (SAT), and a k-means approach was used to automatically segment inter-muscular adipose tissue (IMAT). ROIs were applied to the TSC map to obtain mean TSC in all regions (Figure 2). Leg fat/water ratio was calculated as the total leg fat volume normalized by water-weighted muscle volume. To evaluate whether TSC differs between PAD and control groups, a Wilcoxon rank-sum analysis was applied to TSC in the skin, SAT, muscle, and IMAT. Additional analyses compared leg fat/water ratio, as well as SAT, muscle, and IMAT volume between groups.
Results
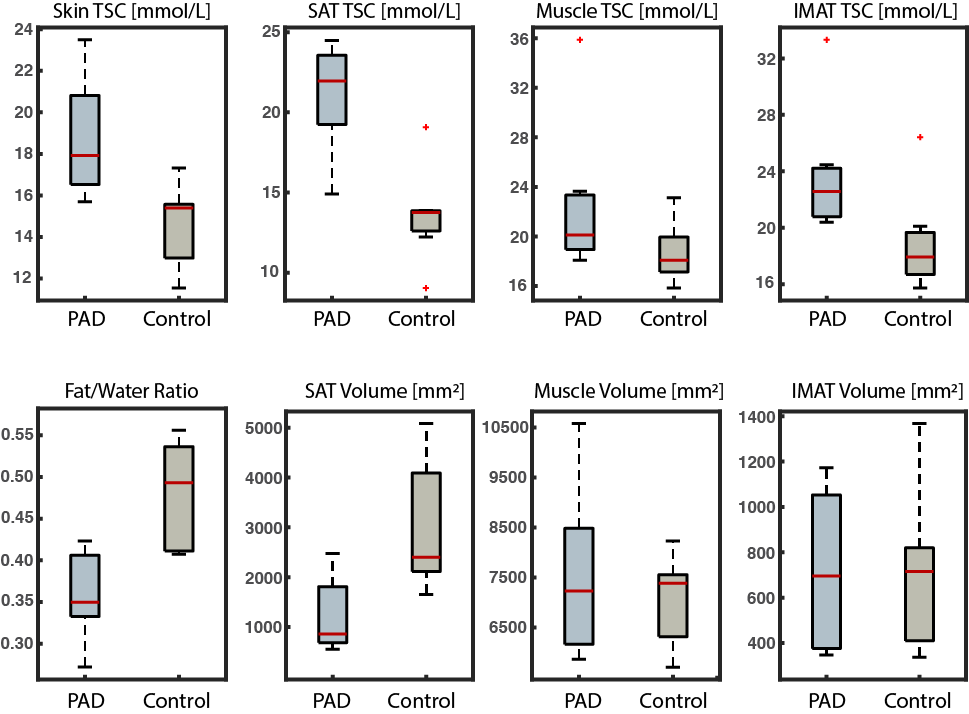
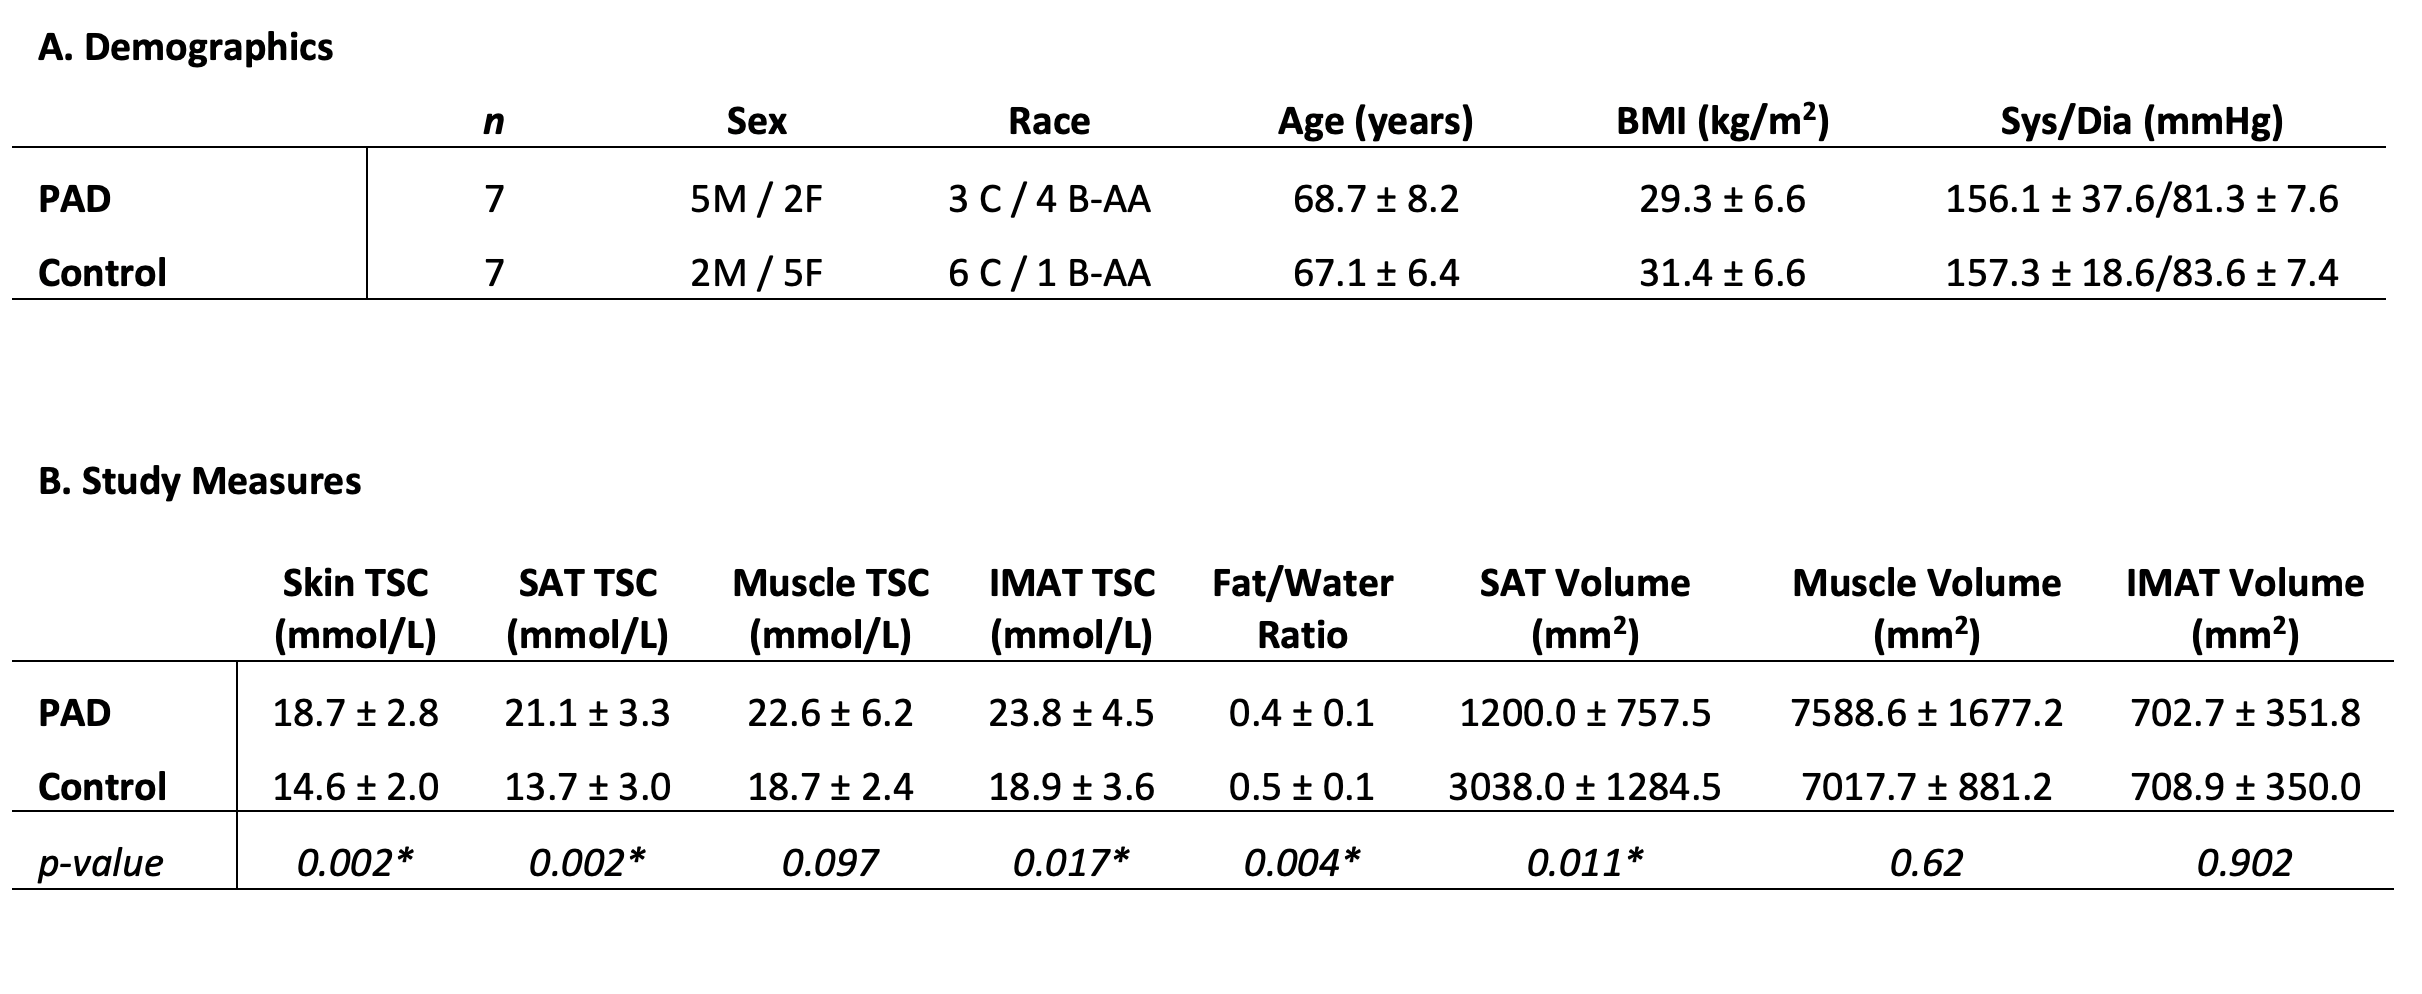
PAD and controls were normalized for age, BMI, blood pressure (Table 1). 23Na-MRI revealed the PAD group showed significantly higher calf sodium in skin (p<0.01), SAT (p<0.01), and IMAT (p=0.02) than control subjects (Figure 3). Additionally, PAD showed lower fat content in the calf compared to controls via the fat/water ratio measure (p<0.01). Volumetric analysis revealed lower SAT in the calf of PAD subjects compared to controls (p=0.01).Discussion
Patients with PAD exhibit altered muscle function as a sequalae of atherosclerotic plaques in the lower extremities. In this multi-nuclear 1H/23Na-MRI study, patients with PAD exhibited increased TSC in the calf skin, SAT, and IMAT. Interestingly, the patients with PAD had lower fat/water ratio compared to control subjects at the group level, thus showing that PAD patients had co-existing lower fat content and elevated tissue sodium content in the leg. SAT volume in control subjects was higher than in patients with PAD, despite tissue sodium content showing the opposite trend. This finding disconnects fat volume from tissue sodium content and may indicate a mechanism of disease in PAD.Skin and muscle sodium deposition are considered hallmarks of hypertension, which we observed in this cohort of PAD. Our observations also showed that adipose tissue appears to play a critical role in PAD disease. Imaging features of TSC and adipose tissue in PAD will be explored further in relationship to inflammatory and functional measures in this study to better understand disease mechanisms.
Conclusion
Sodium magnetic resonance imaging reveals elevated tissue sodium content in the lower limb compartments of patients with peripheral artery disease. Imaging profiles of tissue sodium and fat inform PAD mechanisms and may serve as sensitive imaging biomarker for triaging patients to vascular surgical intervention or exercise as candidate therapies to improve tissue function in PAD, which is the topic of our ongoing investigations.Acknowledgements
Funding provided by AHA Strategically Focused Research Network grant 18SFRN33960373. Imaging experiments were performed at the Vanderbilt Human Imaging Core, using research resources supported by the NIH grant 1S10OD021771-01. We are grateful for Philips support from Charles Nockowski and Ryan Robison, and to Human Imaging Core MRI technologists.References
1. Wu A, Coresh J, Selvin E, Tanaka H, Heiss G, Hirsch AT, Jaar BG and Matsushita K. Lower Extremity Peripheral Artery Disease and Quality of Life Among Older Individuals in the Community. Journal of the American Heart Association. 2017;6:e004519.
2. Zemaitis MR, Boll JM, Dreyer MA. Peripheral Arterial Disease. In: StatPearls. Treasure Island (FL): StatPearls Publishing; July 7, 2022.)
3. Clement DL, De Buyzere ML, Duprez DA. Hypertension in peripheral arterial disease. Curr Pharm Des. 2004;10(29):3615-3620. doi:10.2174/1381612043382819.
4. Kopp C, Linz P, Dahlmann A, et al. 23Na magnetic resonance imaging-determined tissue sodium in healthy subjects and hypertensive patients. Hypertension 2013;61(3):635-640.
5. Borthakur A, Mellon E, Niyogi S, Witschey W, Kneeland JB, Reddy R. Sodium and T1rho MRI for molecular and diagnostic imaging of articular cartilage. NMR Biomed 2006;19(7):781-821.
Figures