2766
MRI and Ultrasound of lower extremity subcutaneous adipose tissue: potential translational screening tools for lipedema1Vanderbilt University School of Medicine, Nashville, TN, United States, 2Radiology and Radiological Sciences, Vanderbilt University Medical Center, Nashville, TN, United States, 3Biomedical Engineering, Vanderbilt University, Nashville, TN, United States, 4Department of Neurology, Vanderbilt University Medical Center, Nashville, TN, United States, 5Department of Biostatistics, Vanderbilt University Medical Center, Nashville, TN, United States, 6Vanderbilt Translational and Clinical Cardiovascular Research Center, Cardiovascular Medicine Division, Vanderbilt University Medical Center, Nashville, TN, United States, 7Department of Physical Medicine and Rehabilitation, Vanderbilt University Medical Center, Nashville, TN, United States, 8Dayani Center for Health and Wellness, Vanderbilt University Medical Center, Nashville, TN, United States, 9Department of Psychiatry, Vanderbilt University Medical Center, Nashville, TN, United States
Synopsis
Keywords: MSK, Screening, Translational Studies
Lipedema is an underdiagnosed connective tissue disorder characterized by disproportionate subcutaneous adipose tissue (SAT) accumulation in the lower extremities. Lipedema is frequently misdiagnosed as obesity and objective diagnostic tools are lacking for lipedema. Patients with lipedema (n=22) and BMI-matched controls (n=7) underwent lower extremity MRI and ultrasound evaluations of SAT as potential diagnostic modalities. MRI and ultrasound measurement of SAT thickness yielded good concordance between modalities (Pearson’s r=0.95, reproducibility coefficient=3.3 mm), and demonstrated similar moderate effect sizes (Cohen’s d>0.5) for discriminating lipedema from controls. MRI and ultrasound are promising screening modalities for lipedema.Introduction
Lipedema is an underdiagnosed disorder characterized by disproportionate accumulation of subcutaneous adipose tissue (SAT) in the lower extremities with symptoms of pain and easy bruising.1,2,3 Lipedema is a clinical diagnosis that is often misdiagnosed as obesity, and patients suffer years of mismanagement and poor response to weight-loss therapy before receiving a definitive diagnosis. Lipedema and obesity are challenging to differentiate based on subjective criteria alone.4Previously, chemical shift encoded (CSE) fat-and-water Dixon MRI revealed significantly higher SAT volume in the lower extremities of patients with lipedema compared to BMI-matched female controls without lipedema, suggesting SAT volume as an imaging biomarker of lipedema.5,6 However, cost-effective and easily-accessible screening tools for lipedema SAT pathology remain an unmet need.
Lower extremity ultrasound (US) demonstrates sensitivity to SAT accumulation in lipedema and may provide an accessible alternative to MRI.7 We are beginning a case-control clinical trial to evaluate US as a potential screening modality compared to high spatial-resolution 3.0T MRI for differentiating lipedema from obesity (NCT05464927). We hypothesize that CSE-MRI and ultrasound measurement of SAT thickness i) yield clinically comparable measurements, and ii) have similar sensitivity to discriminating between participants with lipedema and matched controls. Additional bedside modalities including bioimpedance spectrometry, tissue dielectric probe, and fibrometry were also evaluated given their sensitivity for detecting edema in SAT diseases.8,9
Methods
Adult females (n=29; Lipedema n=22, Healthy control n=7) provided informed, written consent. Participants underwent clinical evaluation for lipedema to determine eligibility based on physical examination and medical history. Exclusion criteria included MRI contraindications and major medical illness (history of heart attack, cancer, kidney disease, uncontrolled diabetes, hypertension).Participants underwent 3.0TMRI using the two-point Dixon method (TR/TE1/TE2=100/1.19/2.37 ms; in-plane resolution=1x1mm2; slice thickness=6mm; flip angle=80°; number signal acquisitions=1; scan duration=2 minutes). SAT thickness (mm) was measured at four locations (anterior, lateral, posterior, medial) on a fat-weighted axial slice of the patient's dominant leg 5 cm inferior to the tibial tuberosity using a Dicom viewing software (HorosTM, https://horosproject.org). Subjects then underwent ultrasonography of the leg at the location of MRI acquisition using a linear 3-11 MHz transducer in B-mode (MyLab™Gamma, Esaote North America, Inc. Fishers, IN). SAT thickness (mm) was measured on US images at approximately the same four locations (anterior, lateral, posterior, medial). The mean SAT thickness across four locations was also calculated for MRI- and US-derived measurements.
Subjects underwent a biophysical exam comprising bioimpedance spectrometry of leg/arm impedance (ratio), tissue dielectric measurement of skin water (%), and fibrometry of skin elasticity (Newtons) conducted at approximately the same location as US on the calf. The imaging and biophysical modalities are demonstrated in Figure 1.
Statistical analyses were performed using MATLAB (version R2022a; The MathWorks Inc., Natick, MA). SAT thickness measurements by MRI and US were compared using descriptive statistics (difference between the group mean), Bland-Altman analysis (reproducibility coefficient), and correlation coefficient. Sensitivity for differentiating lipedema from controls was evaluated by calculating the effect sizes (Cohen’s d) for MRI-derived SAT thickness (mm), US-derived SAT thickness (mm), leg/arm impedance ratio, tissue dielectric skin water percentage (%), and fibrometry (N).
Results
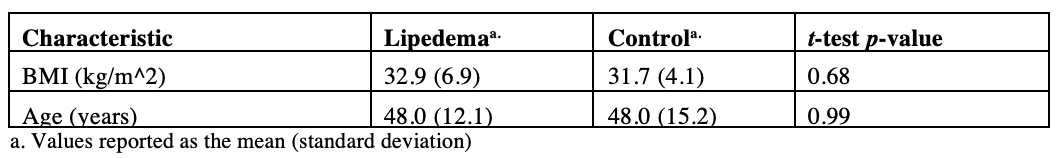
Participants with lipedema (n=22) and healthy controls without lipedema (n=7) were matched for age and BMI in this ongoing clinical trial (Table 1).Agreement of MRI and US SAT Thickness Measurements:
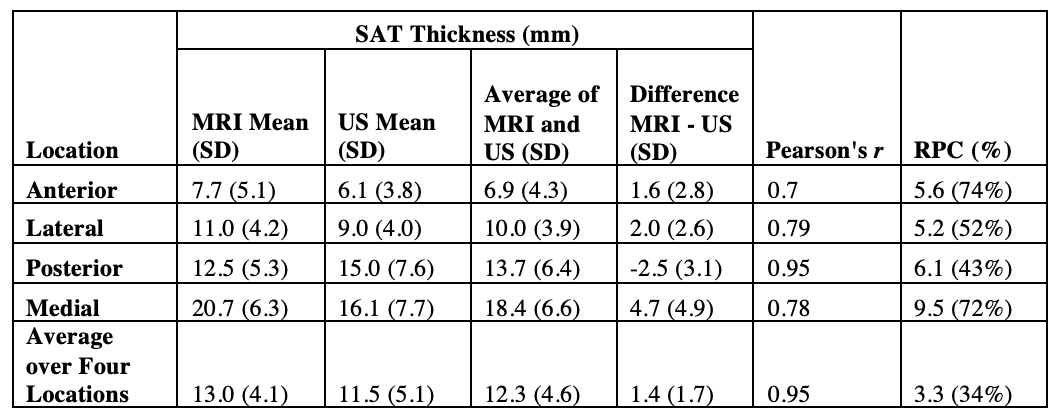
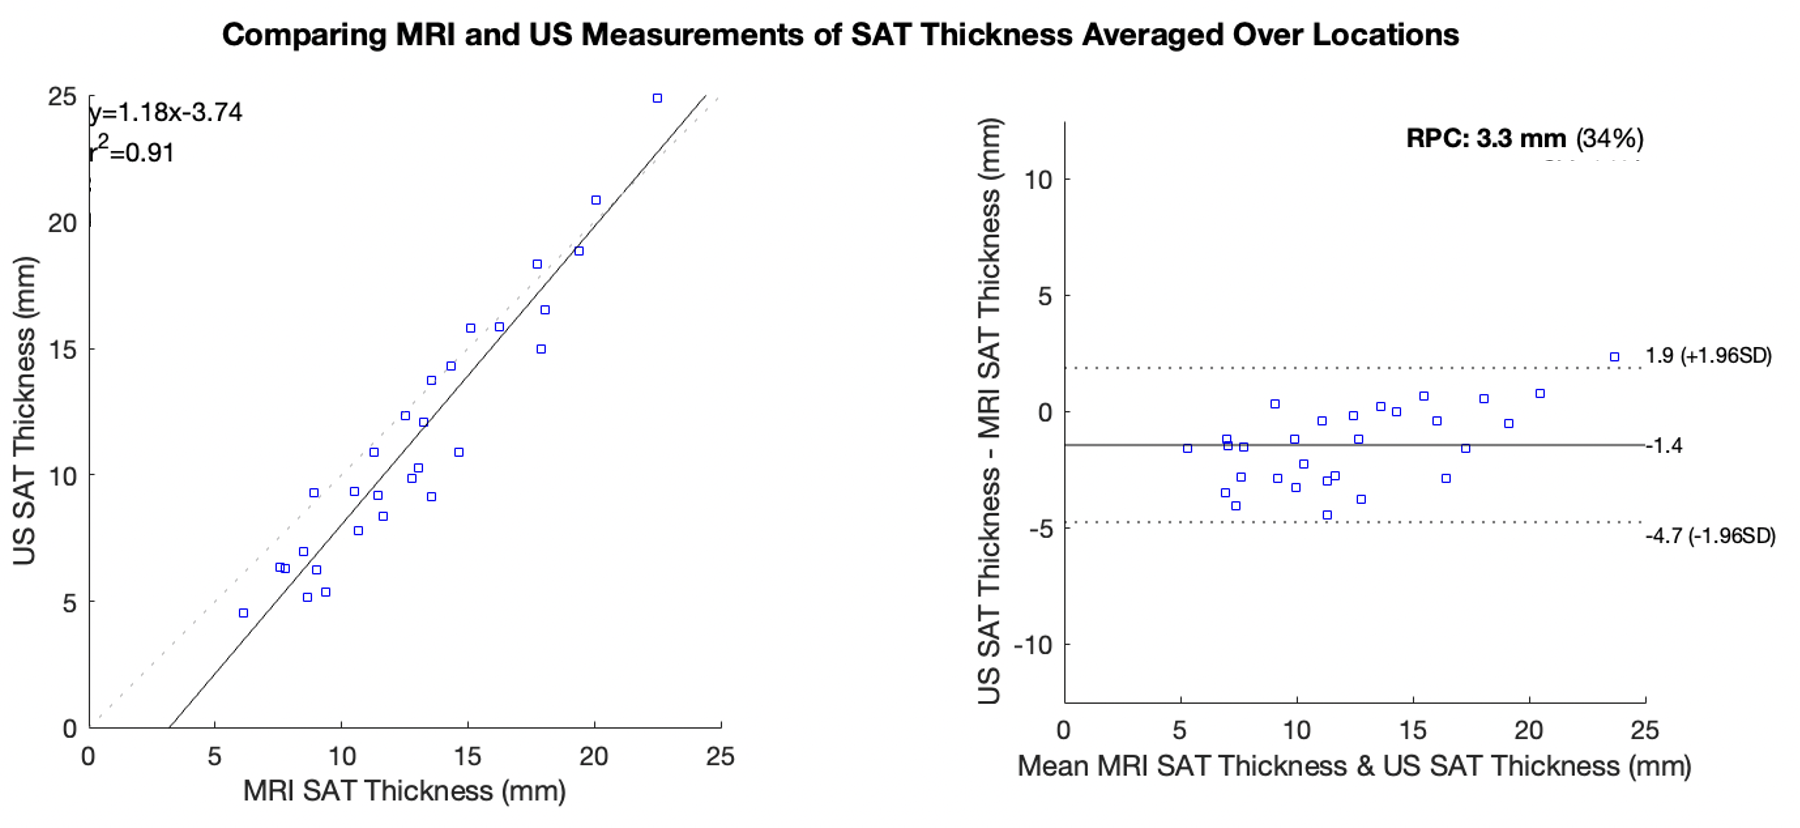
SAT thickness averaged over four locations exhibited the strongest concordance between modalities (r=0.95, RPC=3.3 mm) compared to measurements at each individual location (Table 2). MRI-derived SAT thickness measured 1.4 mm (95% CI [-1.9, 4.7], p<0.001) greater than the US-derived thickness averaged over four locations (Figure 2).
Effect Sizes of Lipedema Biomarkers:
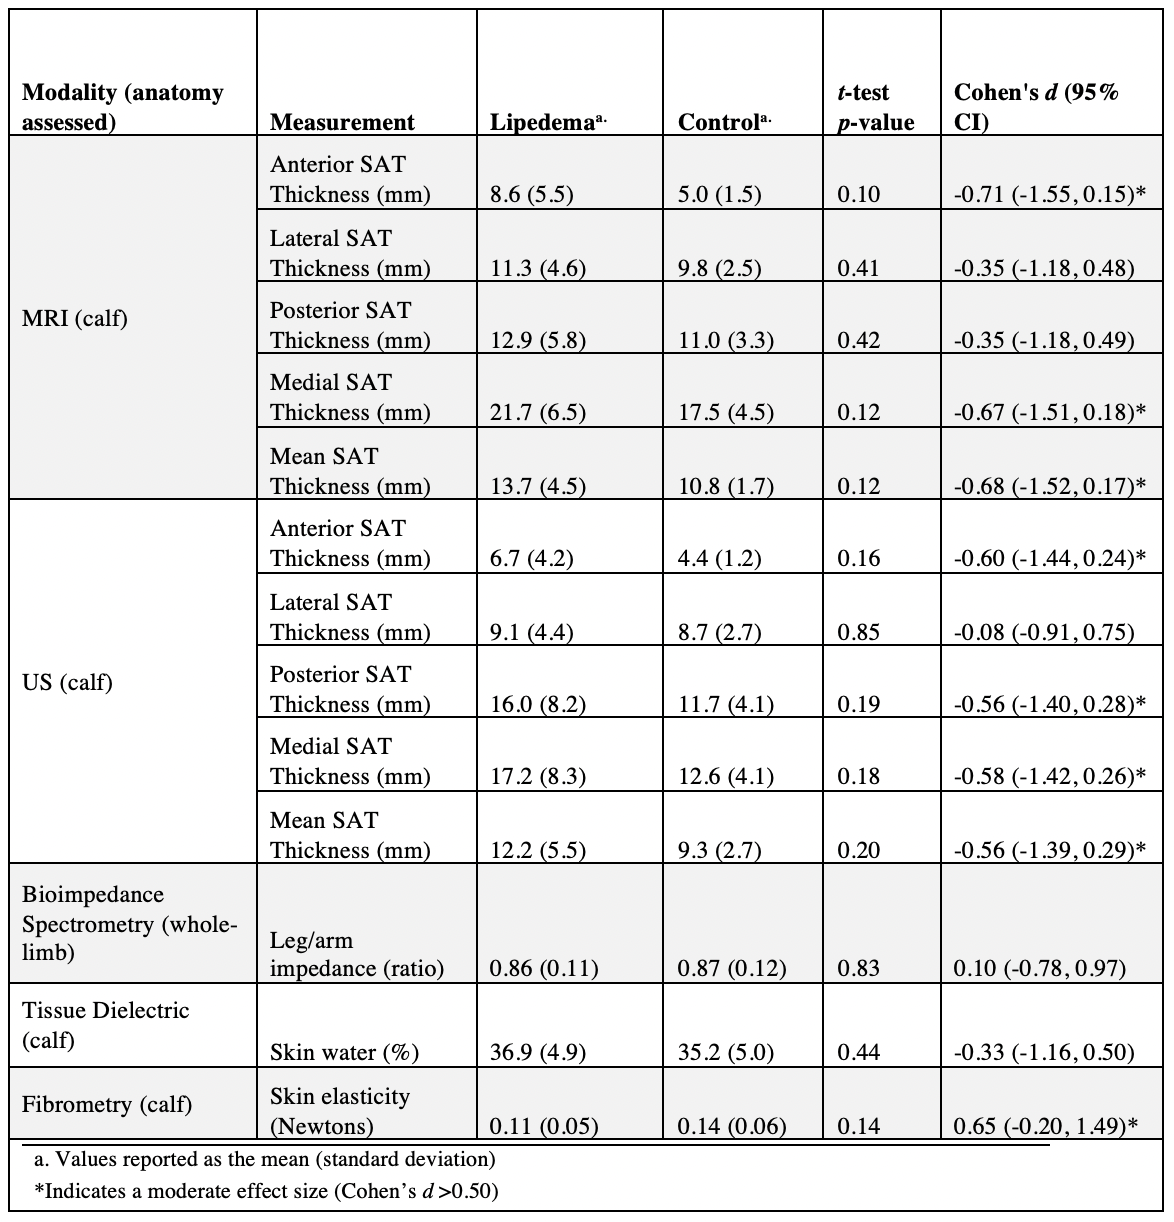
MRI measurements of SAT thickness yielded moderate effect sizes between lipedema and controls in the anterior and medial locations, and the average over four locations (Table 3). US measurements of SAT thickness demonstrated moderate effect sizes in the anterior, posterior, and medial locations, and the average over four locations (Table 3). Of the additional bedside modalities tested (bioimpedance, tissue dielectric probe, and fibrometry), fibrometry yielded a moderate effect size for detecting lower skin elasticity in patients with lipedema compared to controls (Table 3).
Discussion
Examination of patients with lipedema and BMI-matched controls using objective measurement tools revealed insights into the design of a translational screening exam for lipedema. MRI and US measurements of SAT thickness averaged over four approximate locations on the calf exhibited the best concordance between modalities (RPC=3.3 mm). Although MRI-derived SAT thickness exceeded US-derived measurements by 1.4 mm (95% CI [-1.9, 4.7]) on average, this difference is not clinically significant compared to SAT thickness exhibited in patients with lipedema (13.0 mm [SD 4.1 mm]). MRI and US measurements of SAT thickness showed similar moderate effect sizes for discriminating between lipedema and control participants, suggesting that both modalities could be potential screening tools for lipedema. Fibrometry of calf skin elasticity yielded a moderate effect size, supporting its role within a lipedema diagnostic exam.Conclusions
MRI and ultrasound measurements of leg SAT thickness demonstrate promising sensitivity for differentiating lipedema from obesity, its most frequent misdiagnosis. This ongoing clinical trial will continue to evaluate translational imaging modalities to develop a screening tool for lipedema.Acknowledgements
References
[1] Aksoy H, Karadag AS, Wollina U. Cause and management of lipedema-associated pain. Dermatol Ther. 2021 Jan;34(1):e14364. doi: 10.1111/dth.14364. Epub 2020 Oct 12. PMID: 33001552.
[2] Dudek JE, Białaszek W, Ostaszewski P. Quality of life in women with lipoedema: a contextual behavioral approach. Qual Life Res. 2016 Feb;25(2):401-408. doi: 10.1007/s11136-015-1080-x. Epub 2015 Jul 28. PMID: 26216585.
[3] Herbst, K. L., Kahn, L. A., Iker, E., Ehrlich, C., Wright, T., McHutchinson, L., Schwartz, J., Sleigh, M., Donahue, P. M. C., Lisson, K. H., Faris, T., Miller, J., Lontok, E., Schwartz, M. S., Dean, S. M., Bartholomew, J. R., Armour, P., Correa-Perez, M., Pennings, N., Wallace, E. D., Larson, E., “Standard of care for lipedema in the United States,” Phlebology 0(0), 1-18 (2021).
[4] Fife CE, Maus EA, Carter MJ. Lipedema: a frequently misdiagnosed and misunderstood fatty deposition syndrome. Adv Skin Wound Care. 2010 Feb;23(2):81-92; quiz 93-4. doi: 10.1097/01.ASW.0000363503.92360.91. PMID: 20087075.
[5] Crescenzi, R., Donahue, P. M. C., Petersen, K. J., Garza, M.,“Upper and Lower Extremity Measurement of Tissue Sodium and Fat Content in Patients with Lipedema,” Obesity, 28(5), 907-915 (2020)
[6] Shannon L. Taylor, Paula M. C. Donahue, Michael Pridmore, Maria Garza,Niral J. Patel, Chelsea A. Lee, Aaron W. Aday, Joshua A. Beckman, Manus J.Donahue, Rachelle L. Crescenzi, "Whole-leg chemical-shift encoded MRI analysis reveals differential subcutaneous adipose tissue accumulation in lipedema," Proc. SPIE 12036, Medical Imaging 2022: Biomedical Applications in Molecular, Structural, and Functional Imaging, 120361S (4 April 2022); doi:10.1117/12.2611240
[7] Iker, Emily & Mayfield, Cory & Gould, Daniel & Patel, Ketan. (2019). Characterizing Lower Extremity Lymphedema and Lipedema with Cutaneous Ultrasonography and an Objective Computer-Assisted Measurement of Dermal Echogenicity. Lymphatic Research and Biology. 17. 10.1089/lrb.2017.0090.
[8] Crescenzi R, Donahue PMC, Weakley S, Garza M, Donahue MJ, Herbst KL. Lipedema and Dercum's Disease: A New Application of Bioimpedance. Lymphat Res Biol. 2019.
[9] Jagtman BA, Kuiper JP, Brakkee AJ. Mesures de l'élasticité de la peau chez les personnes souffrant d'un lipcedème du type rusticanus Moncorps [Measurements of skin elasticity in patients with lipedema of the Moncorps "rusticanus" type]. Phlebologie. 1984 Jul-Sep;37(3):315-9. French. PMID: 6494267.
[10] Crescenzi R, Donahue PMC, Garza M, et al. Elevated magnetic resonance imaging measures of adipose tissue deposition in women with breast cancer treatment-related lymphedema. Breast Cancer Res Treat 2022;191(1):115-124.
Figures
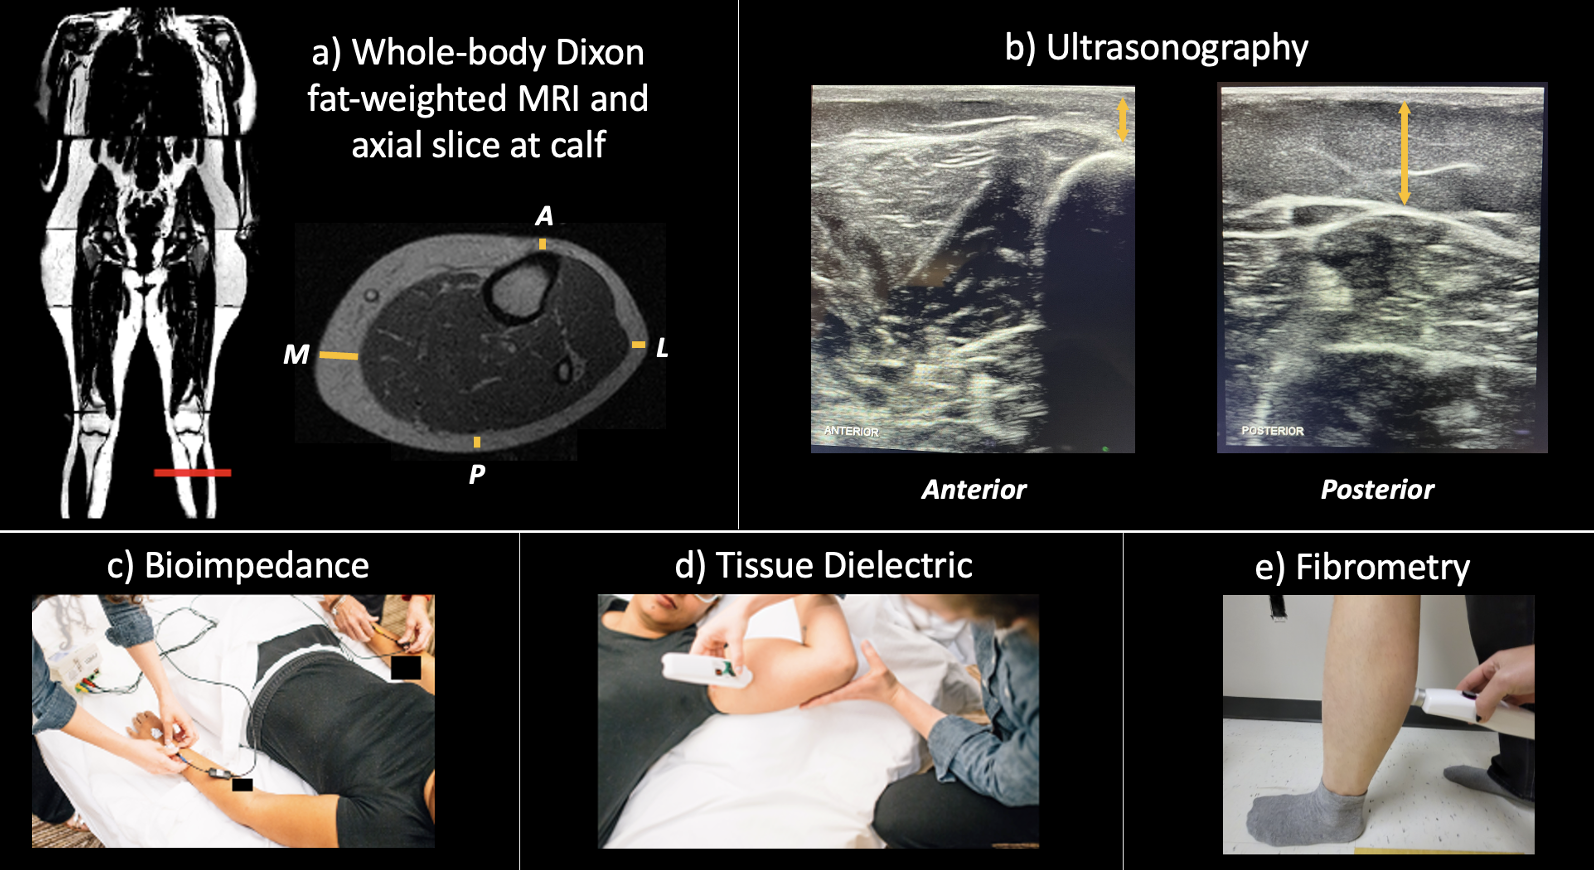
Figure 1: Experimental procedures for lipedema diagnostic modalities.
a) Participants underwent whole-body Dixon MRI. SAT thickness was assessed at an axial slice 5 cm below the tibial tuberosity at 4 locations: A: anterior, P: posterior, M: medial, L: lateral.
b) US was acquired at an identical slice and SAT thickness was assessed at the same 4 locations.
c) Bioimpedance employs electrodes and leads to estimate whole-limb impedance.
d) A tissue dielectric probe was placed on the posterior calf to measure skin water content.
e) Fibrometry was used to measure calf skin elasticity.