2765
Synthetic MRI in the assessment of the classification of rotator cuff injury1Ningxia Medical University General Hospital Radiology department, Yinchuan, China, 2Ningxia Medical University General Hospital Radiology department, Yinchuan, China, Yinchuan, China
Synopsis
Keywords: Tendon/Ligament, Quantitative Imaging
In this study,to investigate the diagnostic value of quantitative parameters of synthetic magnetic resonance image in the grade of rotator cuff injury , we found that the T2 values had high diagnostic efficacy in grading the degree of rotator cuff injury, especially the T2 values of the lateral subregion and the middle subregion had high diagnostic efficacy in differentiating complete tears from partial tears, tendinopathy and normal tendons.Introduction
Rotator cuff tear is a common cause of shoulder pain and disability [1].The incidence of such injuries increases with age, reducing the quality of life because of shoulder pain and weakness with shoulder flexion and abduction [2]. Knowledge of the integrity of the RC tendons in an episode of subacromial pain is an important factor to consider in treatment decision-making [3]. MRI is currently the most commonly used imaging tool to assess rotator cuff injury lesions,with excellent sensitivity and specificity for cuff tear diagnosis [4-5]. Furthermore, diagnosis and monitoring of tendon health with MRI also remains largely subjective, and does not accurately reflect the internal structural changes of the tendon, which limits the accurate assessment of the level of tendon degeneration and treatment effects[6,7]. In recently years, initial studies have shown promise for detecting tendon pathology using quantitative MRI[8-13]. Anz et al.[14] first described T2 mapping for the evaluation of the supraspinatus tendon in asymptomatic individuals and reported excellent inter- and intra-rater reliability. Ganal et al.[15] reported that T2 mapping was an accurate non-invasive method to identify quantitatively early rotator cuff pathology.Synthetic MRI is a novel multimodal quantitative MRI technique that can generate multiple sets of conventional weighted sequences and quantitative sequences at one time, reflect the quantitative information of human tissue components [16,17]. Synthetic MRI can generate different image contrasts by adjusting TE and TR generated inherent T1 relaxation, T2 relaxation and proton density[18], which are absolute magnetic resonance properties of any living tissue[19], achieve quantitative assessment of early biochemical changes in various tissues such as collagen fiber structure, orientation and water content [20-22]. Currently, synthetic MRI are clinically applied to the central nervous system, breast and prostate in addition to the central nervous system [23-25], and many studies have confirmed its feasibility in imaging the temporomandibular joint, lumbar intervertebral disc lesions and sacroiliac joints [25-27] and other bony muscle systems, Yi et al.[28] and Fayad et al.[29] also reported the feasibility of synthetic MRI in knee imaging. However, the clinical application of synthetic MRI in assessing the rotator cuff injury is still little understood.
In this work, the value of the quantitative mapping provided by synthetic MRI in evaluation of the grading of rotator cuff injuries in patients is investigated.
Methods and Materials
1. This prospective study had institutional review board approval and was conducted in accordance with the Committee for Human Research. Informed consent was obtained.2. 97 patients with clinical suspicion of rotator cuff injury and 28 healthy volunteers were prospectively collected. Conventional sequences T2W-FS and T1WI FSE in axial view, T2W-FS in oblique coronal view, PD in oblique sagittal view and Magic sequence in oblique coronal view were performed on 3.0T MR scanner (SIGNATM Premier, GE Healthcare Systems,WI USA) with a 16-channel shoulder-specific coil. Based on the arthroscopic findings of the shoulder, the case groups were divided into 3 groups: tendinopathy group (grade II), partial tear group (grade III) and complete tear group (grade IV).The supraspinatus tendon was divided into lateral, medial and middle subregions according to its shape in oblique coronal T2WI view.Two radiologists with 10 years of experience in musculoskeletal system diagnosis measured the T1, T2 and PD values of the supraspinatus tendon on the Magic oblique coronal images.
3. ICC were used to compared the consistency between and within observers. One-way analysis of variance or Kruskal-Wallis H test were used to compare the differences of quantitative parameters in different regions. ROC curves were drawn for parameters with statistically significant differences to evaluate the diagnostic efficacy for rotator cuff injury.
Results
1. The ICC values of T1, T2 and PD values for the three subregions of the supraspinatus tendon were greater than 0. 700, with good agreement.2. The differences in T1 values in the lateral subregion , T2 values in the lateral and middle subregions were statistically significant in the overall comparison across different classifications (all P < 0. 001).The differences of T1 values in the middle and medial subregions, T2 values in the medial subregion and PD values in the lateral, middle and medial subregions were not statistically significant in the overall comparison of different grades of rotator cuff injury (all P>0. 001).
3. The quantitative parameters with statistically significant differences between grades were included in the ordered regression analysis, and the differences of T2 values in the lateral and middle subregions were statistically significant (all P < 0. 001).
4. The AUCs of the later subregion T2 values for diagnostic class I vs class IV, class II vs class IV and class III vs class IV were 0. 891, 0. 797, 0. 723, and the AUCs for the middle subregion T2 values diagnosing grade I vs IV, grade II vs IV, grade II vs III, and grade I vs III were 0. 946, 0. 886, 0. 746, 0. 843, all with high diagnostic efficacy.
Conclusions
Synthetic MRI have high clinical application value in the grading of rotator cuff injury, especially T2 value can be used as an effective quantitative parameter for the grading of rotator cuff injury, which can provide an objective basis for the clinical grading of rotator cuff injury.Acknowledgements
No acknowledgement found.References
[1] Hughes J D, Gibbs C M, Reddy R P, et al. Repair of high-grade partial thickness supraspinatus tears after surgical completion of the tear have a lower retear rate when compared to full-thickness tear repair[J]. Knee Surg Sports Traumatol Arthrosc, 2021,29(7):2370-2375.DOI:10.1007/s00167-021-06524-9.
[2] Nozaki T, Tasaki A, Horiuchi S, et al. Predicting Retear after Repair of Full-Thickness Rotator Cuff Tear: Two-Point Dixon MR Imaging Quantification of Fatty Muscle Degeneration-Initial Experience with 1-year Follow-up[J]. Radiology, 2016,280(2):500-509.DOI:10.1148/radiol.2016151789.
[3] Blanchard T K, Bearcroft P W, Constant C R, et al. Diagnostic and therapeutic impact of MRI and arthrography in the investigation of full-thickness rotator cuff tears[J]. Eur Radiol, 1999,9(4):638-642.DOI:10.1007/s003300050724.
[4] Lenza M, Buchbinder R, Takwoingi Y, et al. Magnetic resonance imaging, magnetic resonance arthrography and ultrasonography for assessing rotator cuff tears in people with shoulder pain for whom surgery is being considered[J]. Cochrane Database Syst Rev, 2013(9):D9020.DOI:10.1002/14651858.CD009020.pub2.
[5] de Jesus J O, Parker L, Frangos A J, et al. Accuracy of MRI, MR arthrography, and ultrasound in the diagnosis of rotator cuff tears: a meta-analysis[J]. AJR Am J Roentgenol, 2009,192(6):1701-1707.DOI:10.2214/AJR.08.1241.
[6] Ma J, Sahoo S, Imrey P B, et al. Inter-rater agreement of rotator cuff tendon and muscle magnetic resonance imaging parameters evaluated preoperatively and during the first postoperative year following rotator cuff repair[J]. Journal of Shoulder and Elbow Surgery, 2021,30(12):e741-e752.DOI:10.1016/j.jse.2021.04.021.
[7] Khazzam M, Kuhn J E, Mulligan E, et al. Magnetic resonance imaging identification of rotator cuff retears after repair: interobserver and intraobserver agreement[J]. Am J Sports Med, 2012,40(8):1722-1727.DOI:10.1177/0363546512449424.
[8] Bittersohl B, Miese F R, Dekkers C, et al. T2* mapping and delayed gadolinium-enhanced magnetic resonance imaging in cartilage (dGEMRIC) of glenohumeral cartilage in asymptomatic volunteers at 3 T[J]. Eur Radiol, 2013,23(5):1367-1374.DOI:10.1007/s00330-012-2718-5.
[9] Juras V, Zbyn S, Pressl C, et al. Regional variations of T(2)* in healthy and pathologic achilles tendon in vivo at 7 Tesla: preliminary results[J]. Magn Reson Med, 2012,68(5):1607-1613.DOI:10.1002/mrm.24136.
[10] Robson M D, Benjamin M, Gishen P, et al. Magnetic resonance imaging of the Achilles tendon using ultrashort TE (UTE) pulse sequences[J]. Clin Radiol, 2004,59(8):727-735.DOI:10.1016/j.crad.2003.11.021.
[11] Juras V, Apprich S, Pressl C, et al. Histological correlation of 7 T multi-parametric MRI performed in ex-vivo Achilles tendon[J]. Eur J Radiol, 2013,82(5):740-744.DOI:10.1016/j.ejrad.2011.09.022.
[12] Crema M D, Roemer F W, Marra M D, et al. Articular cartilage in the knee: current MR imaging techniques and applications in clinical practice and research[J]. Radiographics, 2011,31(1):37-61.DOI:10.1148/rg.311105084.
[13] Trattnig S, Zbyn S, Schmitt B, et al. Advanced MR methods at ultra-high field (7 Tesla) for clinical musculoskeletal applications[J]. Eur Radiol, 2012,22(11):2338-2346.DOI:10.1007/s00330-012-2508-0.
[14] Anz A W, Lucas E P, Fitzcharles E K, et al. MRI T2 mapping of the asymptomatic supraspinatus tendon by age and imaging plane using clinically relevant subregions[J]. Eur J Radiol, 2014,83(5):801-805.DOI:10.1016/j.ejrad.2014.02.002.
[15] Ganal E, Ho C P, Wilson K J, et al. Quantitative MRI characterization of arthroscopically verified supraspinatus pathology: comparison of tendon tears, tendinosis and asymptomatic supraspinatus tendons with T2 mapping[J]. Knee Surg Sports Traumatol Arthrosc, 2016,24(7):2216-2224.DOI:10.1007/s00167-015-3547-2.
[16] Drake-Perez M, Delattre B, Boto J, et al. Normal Values of Magnetic Relaxation Parameters of Spine Components with the Synthetic MRI Sequence[J]. AJNR Am J Neuroradiol, 2018,39(4):788-795.DOI:10.3174/ajnr.A5566.
[17] Lou B, Jiang Y, Li C, et al. Quantitative Analysis of Synthetic Magnetic Resonance Imaging in Alzheimer's Disease[J]. Front Aging Neurosci, 2021,13:638731.DOI:10.3389/fnagi.2021.638731.
[18] Schmidbauer V, Geisl G, Diogo M, et al. SyMRI detects delayed myelination in preterm neonates[J]. Eur Radiol, 2019,29(12):7063-7072.DOI:10.1007/s00330-019-06325-2.
[19] Goncalves F G, Serai S D, Zuccoli G. Synthetic Brain MRI: Review of Current Concepts and Future Directions[J]. Top Magn Reson Imaging, 2018,27(6):387-393.DOI:10.1097/RMR.0000000000000189.
[20] Roux M, Hilbert T, Hussami M, et al. MRI T2 Mapping of the Knee Providing Synthetic Morphologic Images: Comparison to Conventional Turbo Spin-Echo MRI[J]. Radiology, 2019,293(3):620-630.DOI:10.1148/radiol.2019182843.
[21] Schmidbauer V, Dovjak G, Geisl G, et al. Impact of Prematurity on the Tissue Properties of the Neonatal Brain Stem: A Quantitative MR Approach[J]. AJNR Am J Neuroradiol, 2021,42(3):581-589.DOI:10.3174/ajnr.A6945.
[22] Zhao L, Liang M, Shi Z, et al. Preoperative volumetric synthetic magnetic resonance imaging of the primary tumor for a more accurate prediction of lymph node metastasis in rectal cancer[J]. Quant Imaging Med Surg, 2021,11(5):1805-1816.DOI:10.21037/qims-20-659.
[23] Ambarki K, Lindqvist T, Wahlin A, et al. Evaluation of automatic measurement of the intracranial volume based on quantitative MR imaging[J]. AJNR Am J Neuroradiol, 2012,33(10):1951-1956.DOI:10.3174/ajnr.A3067.
[24] Jung Y, Gho S M, Back S N, et al. The feasibility of synthetic MRI in breast cancer patients: comparison of T2 relaxation time with multiecho spin echo T2 mapping method[J]. Br J Radiol, 2018:20180479.DOI:10.1259/bjr.20180479.
[25] Arita Y, Takahara T, Yoshida S, et al. Quantitative Assessment of Bone Metastasis in Prostate Cancer Using Synthetic Magnetic Resonance Imaging[J]. Invest Radiol, 2019,54(10):638-644.DOI:10.1097/RLI.0000000000000579.
[26] Lee C, Choi Y J, Jeon K J, et al. Synthetic magnetic resonance imaging for quantitative parameter evaluation of temporomandibular joint disorders[J]. Dentomaxillofac Radiol, 2021,50(5):20200584.DOI:10.1259/dmfr.20200584.
[27] Jiang Y, Yu L, Luo X, et al. Quantitative synthetic MRI for evaluation of the lumbar intervertebral disk degeneration in patients with chronic low back pain[J]. Eur J Radiol, 2020,124:108858.DOI:10.1016/j.ejrad.2020.108858.
[28] Yi J, Lee Y H, Song H T, et al. Clinical Feasibility of Synthetic Magnetic Resonance Imaging in the Diagnosis of Internal Derangements of the Knee[J]. Korean J Radiol, 2018,19(2):311-319.DOI:10.3348/kjr.2018.19.2.311.
[29] Fayad L M, Parekh V S, de Castro L R, et al. A Deep Learning System for Synthetic Knee Magnetic Resonance Imaging: Is Artificial Intelligence-Based Fat-Suppressed Imaging Feasible?[J]. Invest Radiol, 2021,56(6):357-368.DOI:10.1097/RLI.0000000000000751.
Figures
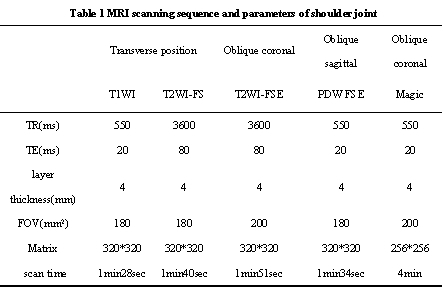
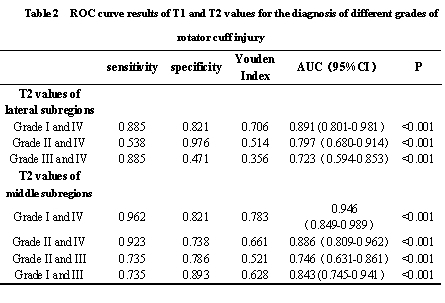
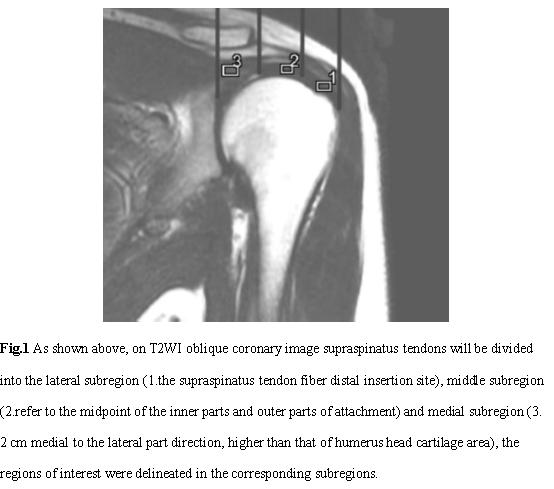
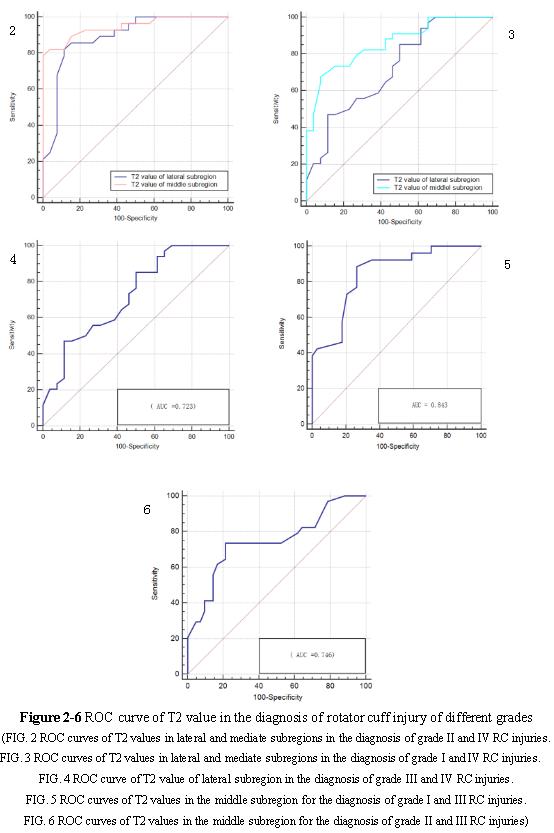
Figure 2-6 ROC curve in the diagnosis of RC injury of different grades
(FIG. 2 ROC curves of T2 values in lateral and mediate subregions in the diagnosis of grade II and IV RC injuries.
FIG. 3 ROC curves of T2 values in lateral and mediate subregions in the diagnosis of grade I and grade IV RC injuries.
FIG. 4 ROC curve of T2 value of lateral subregion in the diagnosis of grade III and IV RC injuries.
FIG. 5 ROC curves of T2 values in the middle subregion for the diagnosis of grade I and III RC injuries.
FIG. 6 ROC curves of T2 values in the middle subregion for the diagnosis of grade II and III RC injuries)