2762
The choroid plexus as a source for selecting an arterial input function for resting cerebral perfusion measures1University Health Network, Toronto, ON, Canada, 2Physiology, University of Toronto, Toronto, ON, Canada
Synopsis
Keywords: Susceptibility, Perfusion
The choroid plexus is composed of arteries and stroma with negligible metabolic activity allowing its vessels to remain arterialized throughout its structure. We assessed the choroid plexus as a suitable alternate arterial input function rather than the middle cerebral artery in DSC imaging in individuals with both normal vasculature and pathology affecting the middle cerebral artery.Introduction
The choroid plexus (CP) is a highly vascular tissue composed essentially of arterialized blood vessels and acellular stroma engaging in minimal metabolism relative to its blood flow1. It is located predominately in the third and lateral ventricles as well as fourth ventricle. Its main function is the production and maintenance of cerebral spinal fluid (CSF)2. Hypoxia-induced deoxyhemoglobin ([dOHb]) and gadolinium-based contrast agent (GBCA) have been used as dynamic susceptibility contrast (DSC) agents for measuring relative cerebral perfusion metrics3,4,5. Conventional analytical methods of DSC imaging use an arterial input function (AIF) derived from the BOLD signal over a middle cerebral artery (MCA). The signal profile of the AIF in the MCA may vary with the location of the selected voxel and its overlap with adjacent tissue including veins, CSF and brain parenchyma due to volume averaging effects. Due to its degree of arterialization and its large cross-sectional area, the CP may provide a more accurate AIF profile. The CP was therefore investigated as an alternative source to the MCA for identifying an AIF for calculating resting perfusion metrics.Methods
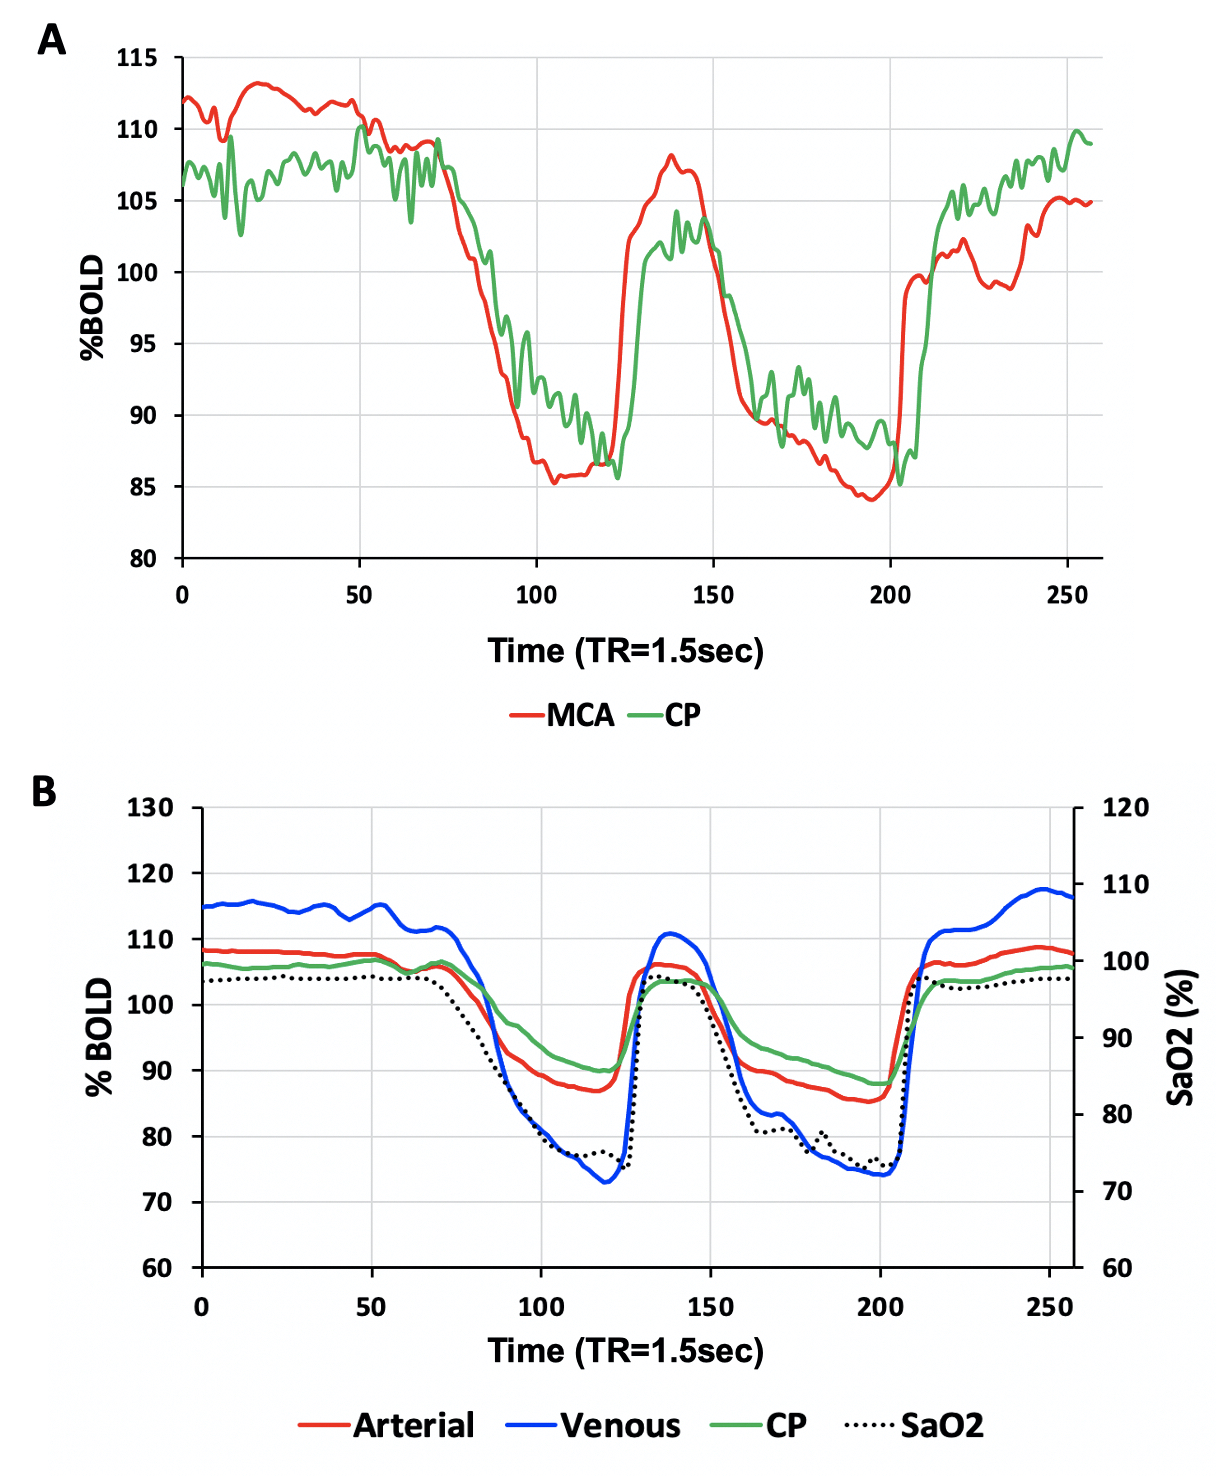
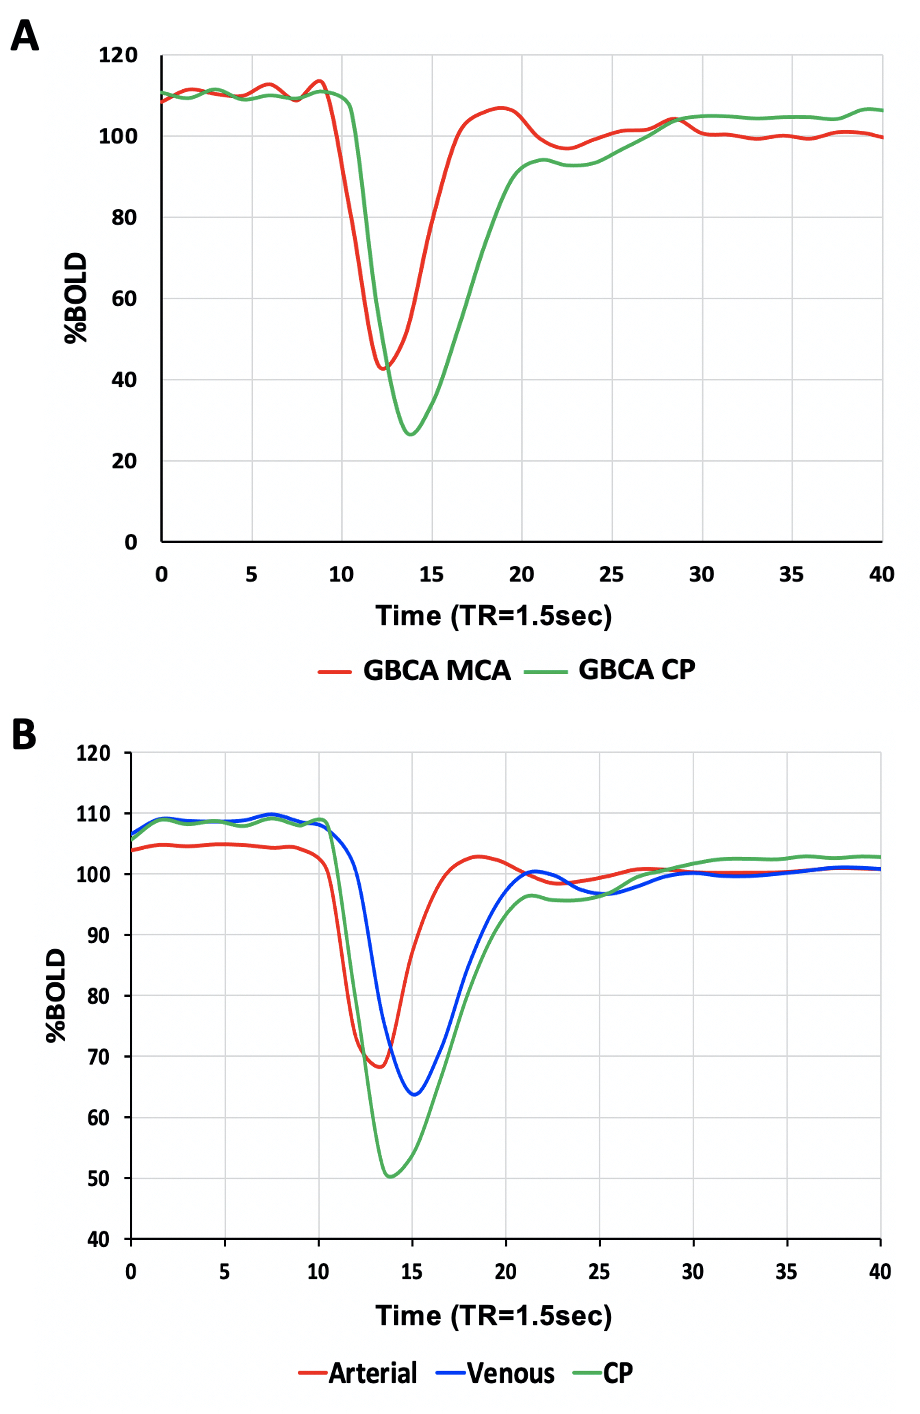
Eight healthy volunteers (6F, age 23-60 years) and a patient with known steno-occlusive disease, were imaged on a 3T MR scanner using an 8 channel receive only head coil. A computer-controlled gas blender was used to control end-tidal O2 (PETO2) and CO2 (PETCO2) concentrations using sequential gas delivery (RespirAct™, Thornhill Medical, Toronto, Canada). A BOLD acquisition with TR/TE = 1500/30 ms, flip angle = 73°, 29 slices, voxel size of 3 mm isotropic and matrix size of 64 x64 was acquired during PETO2 manipulation while maintaining normocapnia during a 4 min 20 second scan. The gas manipulation consisted of a 60 s baseline PETO2 of 95 mmHg (normoxia), followed by a step decrease in PETO2 to 40 mmHg (hypoxia) for 60 seconds, a return to normoxia was then applied for 20 seconds, followed by a similar timed hypoxic period (Figure 1). The healthy volunteers underwent an additional BOLD sequence with the same parameters where an intravenous injection of GBCA (5ml bolus using 0.1 mmol/kg of gadobutrol at 5 ml/sec) was administered. A voxel from the MCA (AIF-MCA) and the CP (AIF-CP) were selected for BOLD AIF determination during the [dOHb] bolus as well as the GBCA bolus. A parametrized method for deconvolving and fitting the residue function with an exponential was used to calculate mean transient time (MTT) and relative cerebral blood volume (rCBV) for each AIF selection4. Relative cerebral blood flow (rCBF) was calculated as rCBF=rCBV/MTT. Average perfusion metrics were calculated for gray (GM) and white matter (WM).Results
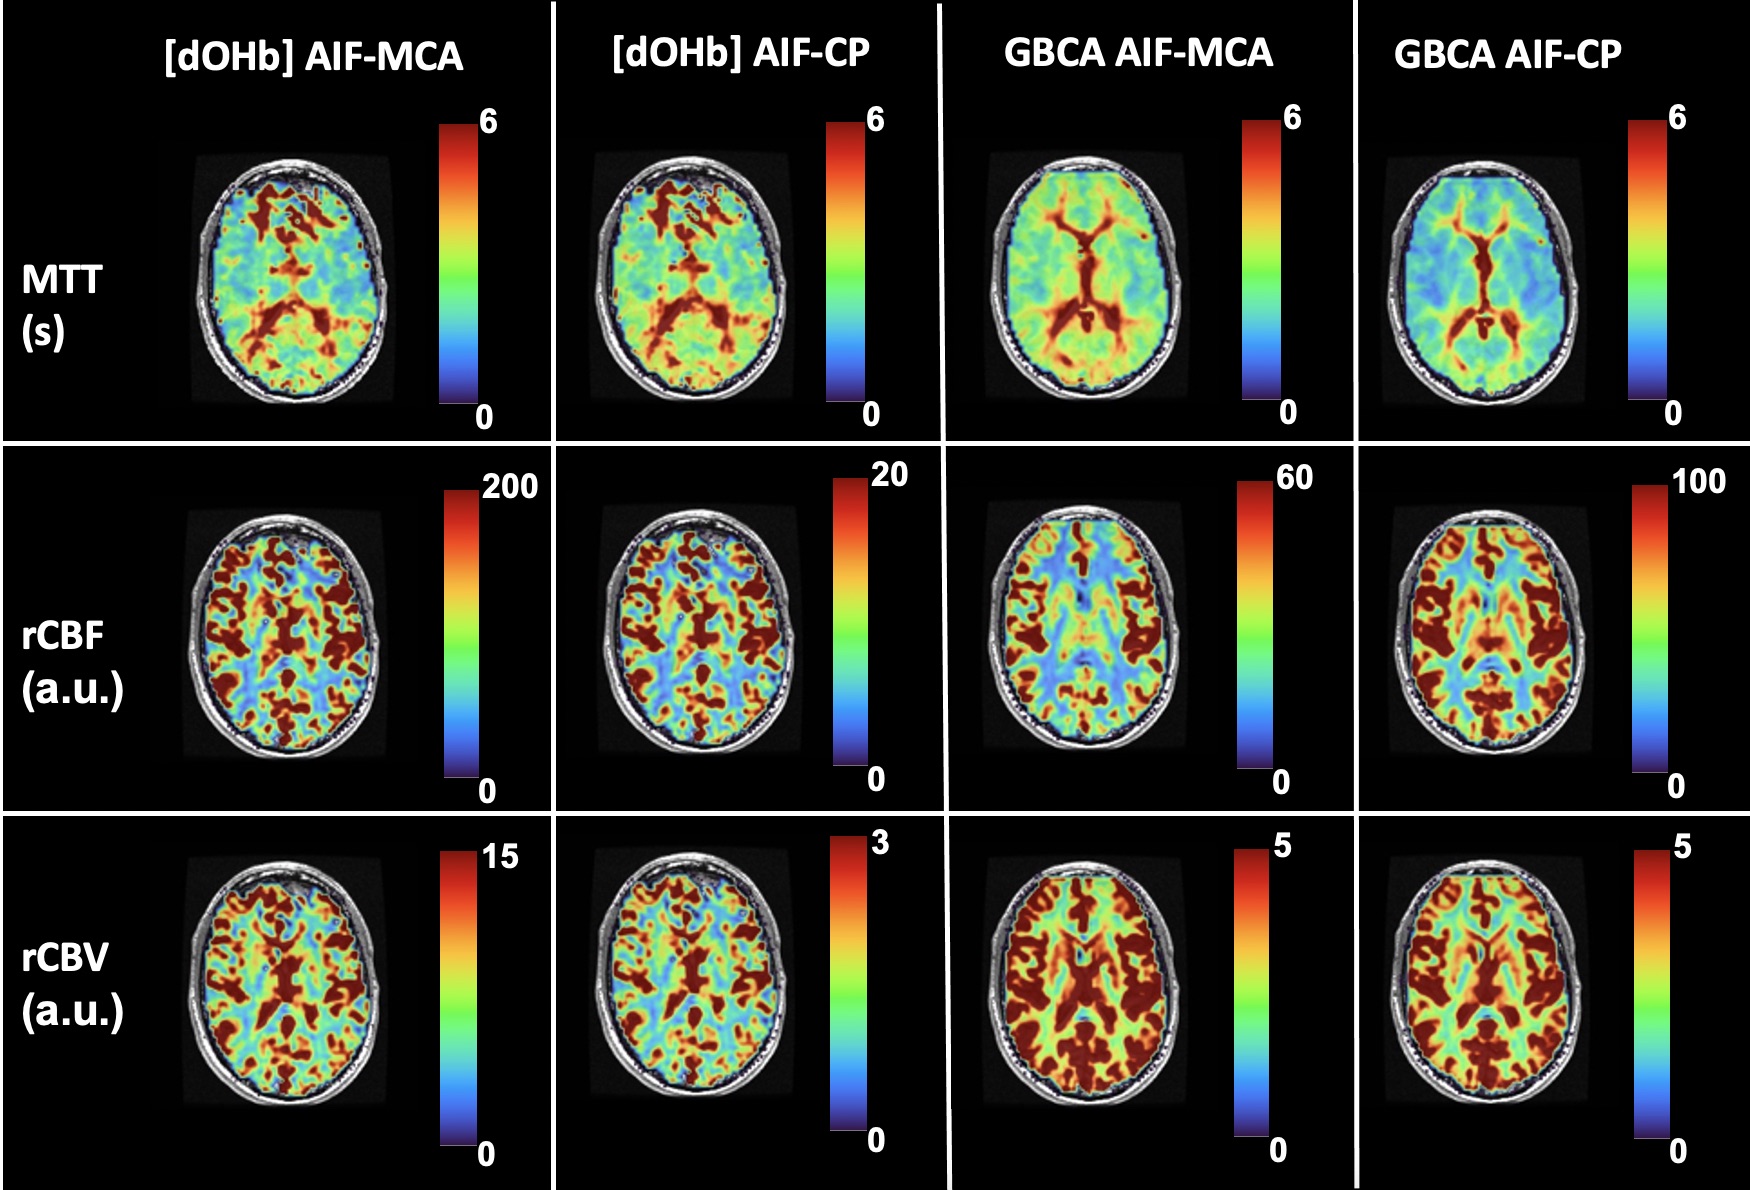
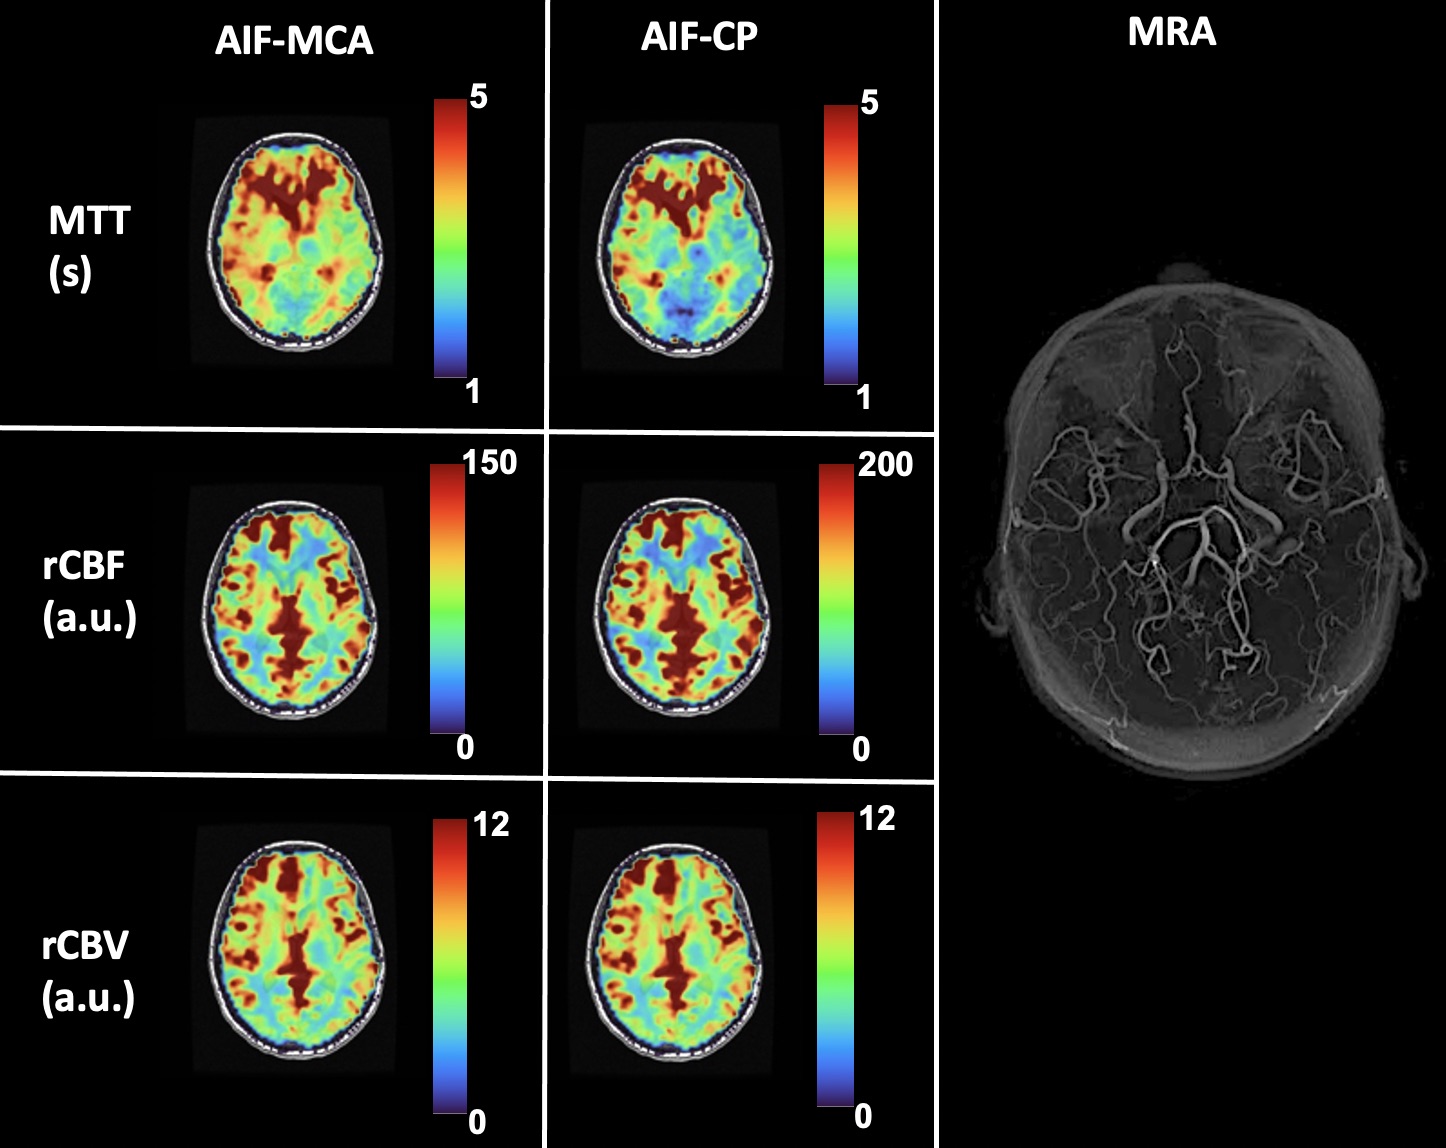
The [dOHb] and GBCA signals were similarly resolved in the MCA and CP (Figure 1 and Figure 2 respectively). As expected, the change in the CP signal followed the drop in arterial signal and preceded the venous signal in both DSC methods. The spatial maps of resting perfusion metrics using AIFs from the MCA and CP were very similar (Figure 3). No statistically significant differences were found between average MTT and rCBF values in either GM or WM using AIF-MCA and AIF-CP in GBCA. Significant differences were found for rCBV in both GM (P=0.028, α=0.05) and WM (P=0.042, α=0.05) comparing the CP and MCA AIFs for GBCA. For the [dOHb] protocol, statistically significant differences were only found between MTT AIF-CP and AIF-MCA for GM and WM (GM P=0.042 & WM P=0.021, α=0.05).Discussion
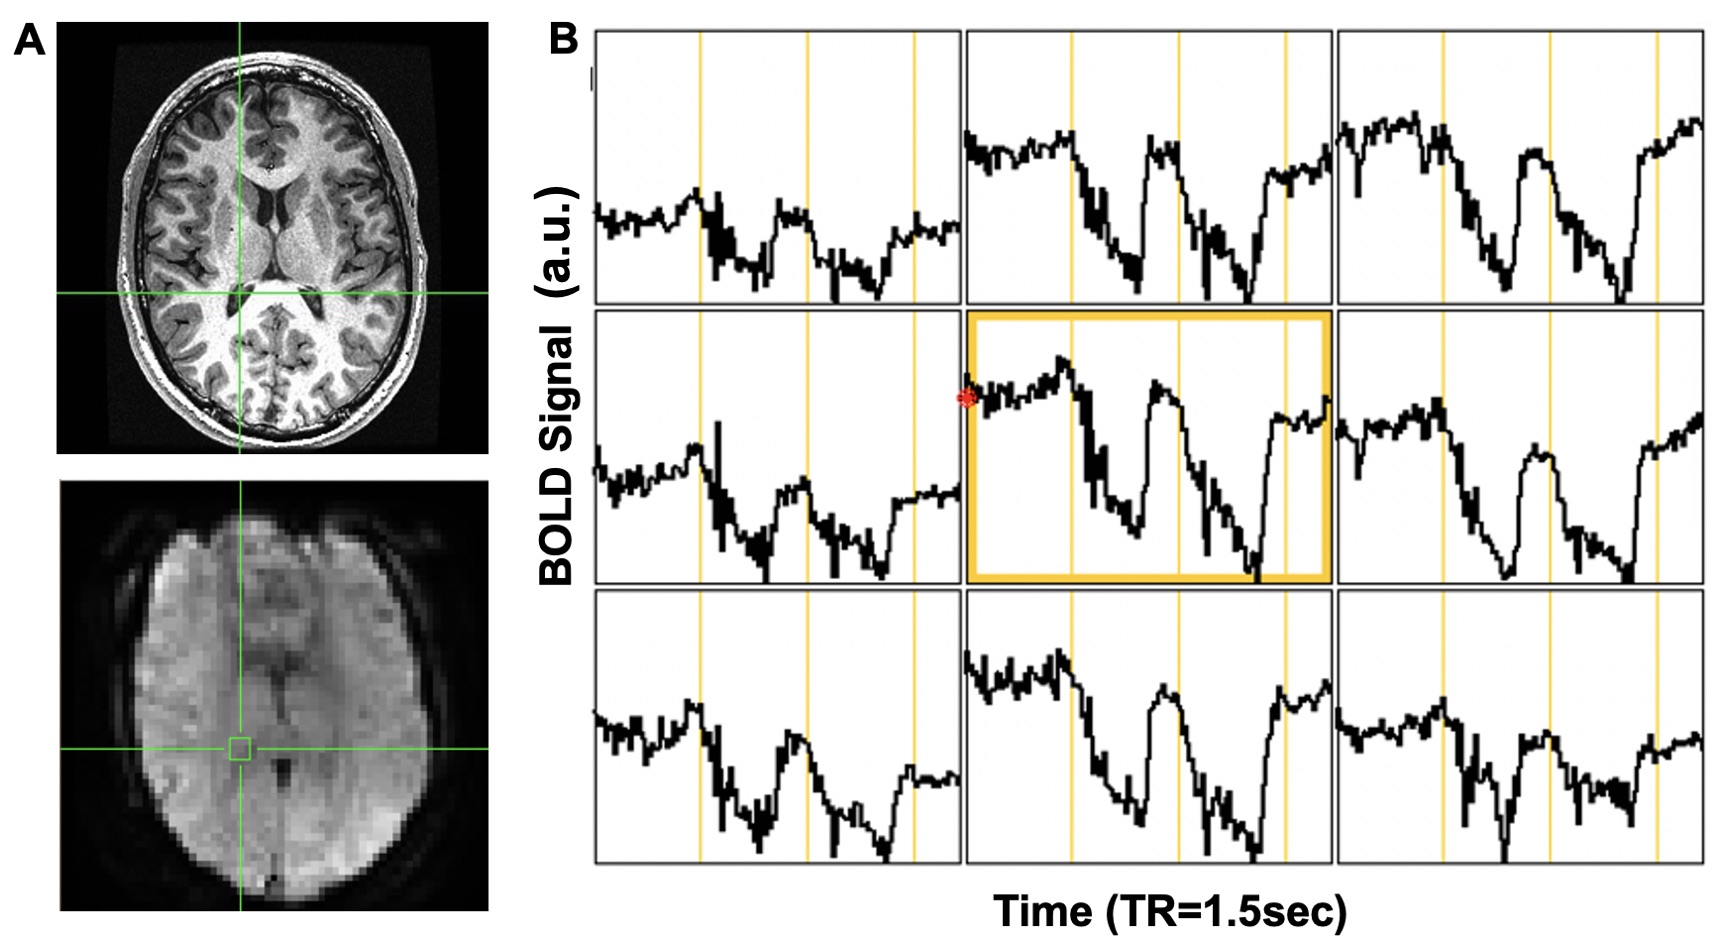
Multiple locations in the CP yielded near identical signal changes that could be used as an AIF (Figure 4). Maps of the perfusion metrics for the AIF-CP and AIF-MCA were similar for both GBCA and [dOHb]. Statistical differences in similar appearing distributions of perfusion measures may be due to the large differences in CNR between [dOHb] and GBCA as well as the differences in the magnitude and shape of the AIF at each location. The advantage of selecting the CP for the AIF is that it resides in a homogenous B0 magnetic environment as opposed to the MCA that is frequently located in regions of B0 field inhomogeneity secondary to the susceptibility effects caused by the skull base distorting the bolus signal. Furthermore, the CP behaves like an arterial structure by virtue of its unique structure and function as seen by the similarity in bolus shapes for the passage of [dOHb] and GBCA boluses. There is little metabolic activity and therefore little consumption of oxygen compared to neural tissue. The CP may therefore be a suitable alternate structure for deriving the AIF for GBCA and [dOHb] bolus methods for generating perfusion metrics particularly when there is uncertainty regarding signal sampling in the MCA (Figure 5).Conclusion/summary of findings
This study demonstrates that the CP may provide an alternate source to the MCA for selection of an AIF for calculation of resting perfusion measures when using DSC imaging.Acknowledgements
All authors thank MR technologist Keith Ta for his help in acquiring the MR images.References
1. Ghersi‑Egea, JF., Strazielle, N., Catala M., et al. Molecular anatomy and functions of the choroidal blood‑cerebrospinal fluid barrier in health and disease. Acta Neuropathologica. 2018;135(3):337–361.
2. Zhao, L., Taso, M., Dai, W., et al. Non-invasive measurement of choroid plexus apparent blood flow with arterial spin labeling. Fluids Barriers CNS. 2020; 17(1):58. doi:10.1186/s12987-020-00218-z
3. Vu C, Chai Y, Coloigner J, et al. Quantitative perfusion mapping with induced transient hypoxia using BOLD MRI. Magn Reson Med. 2021;85:168-181. doi: 10.1002/mrm.28422
4. Poublanc J, Sobczyk O, Shafi R, et al. Perfusion MRI using endogenous deoxyhemoglobin as a contrast agent: Preliminary data. Magn Reson Med. 2021;86(6):3012–3021. doi:10.1002/mrm.2897
5. Sayin ES, Schulman J, Poublanc J, et al. Investigation of hypoxia-induced deoxyhemoglobin as a contrast agent for cerebral perfusion imaging. Human Brain Mapp. 2022:1-11. doi: 10.1002/hbm.26131
6. Balaban DY, Dukn J, Preiss D, et al. The in-vivo oxyhaemoglobin dissociation curve at sea level and high altitude. Respiratory Physiology & Neurobiology. 2013;186(1):45–52.doi:10.1016/j.resp.2012.12.011
Figures