2760
Feasibility Study to Spatially Map the Filtration Function of the Kidneys with Multi-TE Arterial Spin Labeling1Fraunhofer Institute for Digital Medicine MEVIS, Bremen, Germany, 2mediri GmbH, Heidelberg, Germany, 3University of Bremen, Bremen, Germany
Synopsis
Keywords: Arterial spin labelling, Kidney
A spatial mapping of the renal filtration function of the blood might be helpful in identifying parts of the kidney that only work with reduced function and are therefore impaired the most. This work shows an approach to a non-invasive method to map the filtration rate of the kidney.Introduction
The Glomerular Filtration Rate (GFR) is the standard value to represent filtration of the blood in the kidney, usually calculated for both kidneys. This has the advantage of containing quick and easy to understand information about the state of both kidneys and the health of the patient, but it misses spatial information of renal filtration. Our goal is to find a non-invasive technique that can spatially map the filtration function of the kidney.Existing multi-compartment-models map the exchange time for blood from intra- to extravascular compartment in neuro imaging with non-invasive multi echo time (TE) Arterial Spin Labeling (ASL)1,2,3. By applying this method to the kidneys the exchange time might be indirectly proportional to the filtration rate serving as a biomarker for kidney function. Therefor we propose transferring the aforementioned model to renal ASL hoping to be able to map the renal function. Since the model is based on the assumption of a compartmental difference in T2, its feasibility was assessed by reviewing the existence of this phenomenon in the kidney. For the transfer of the model to the kidneys a mono-exponential decay in dependency of T2 was fitted to multi-TE data as shown in Milford et al.4.
Methods
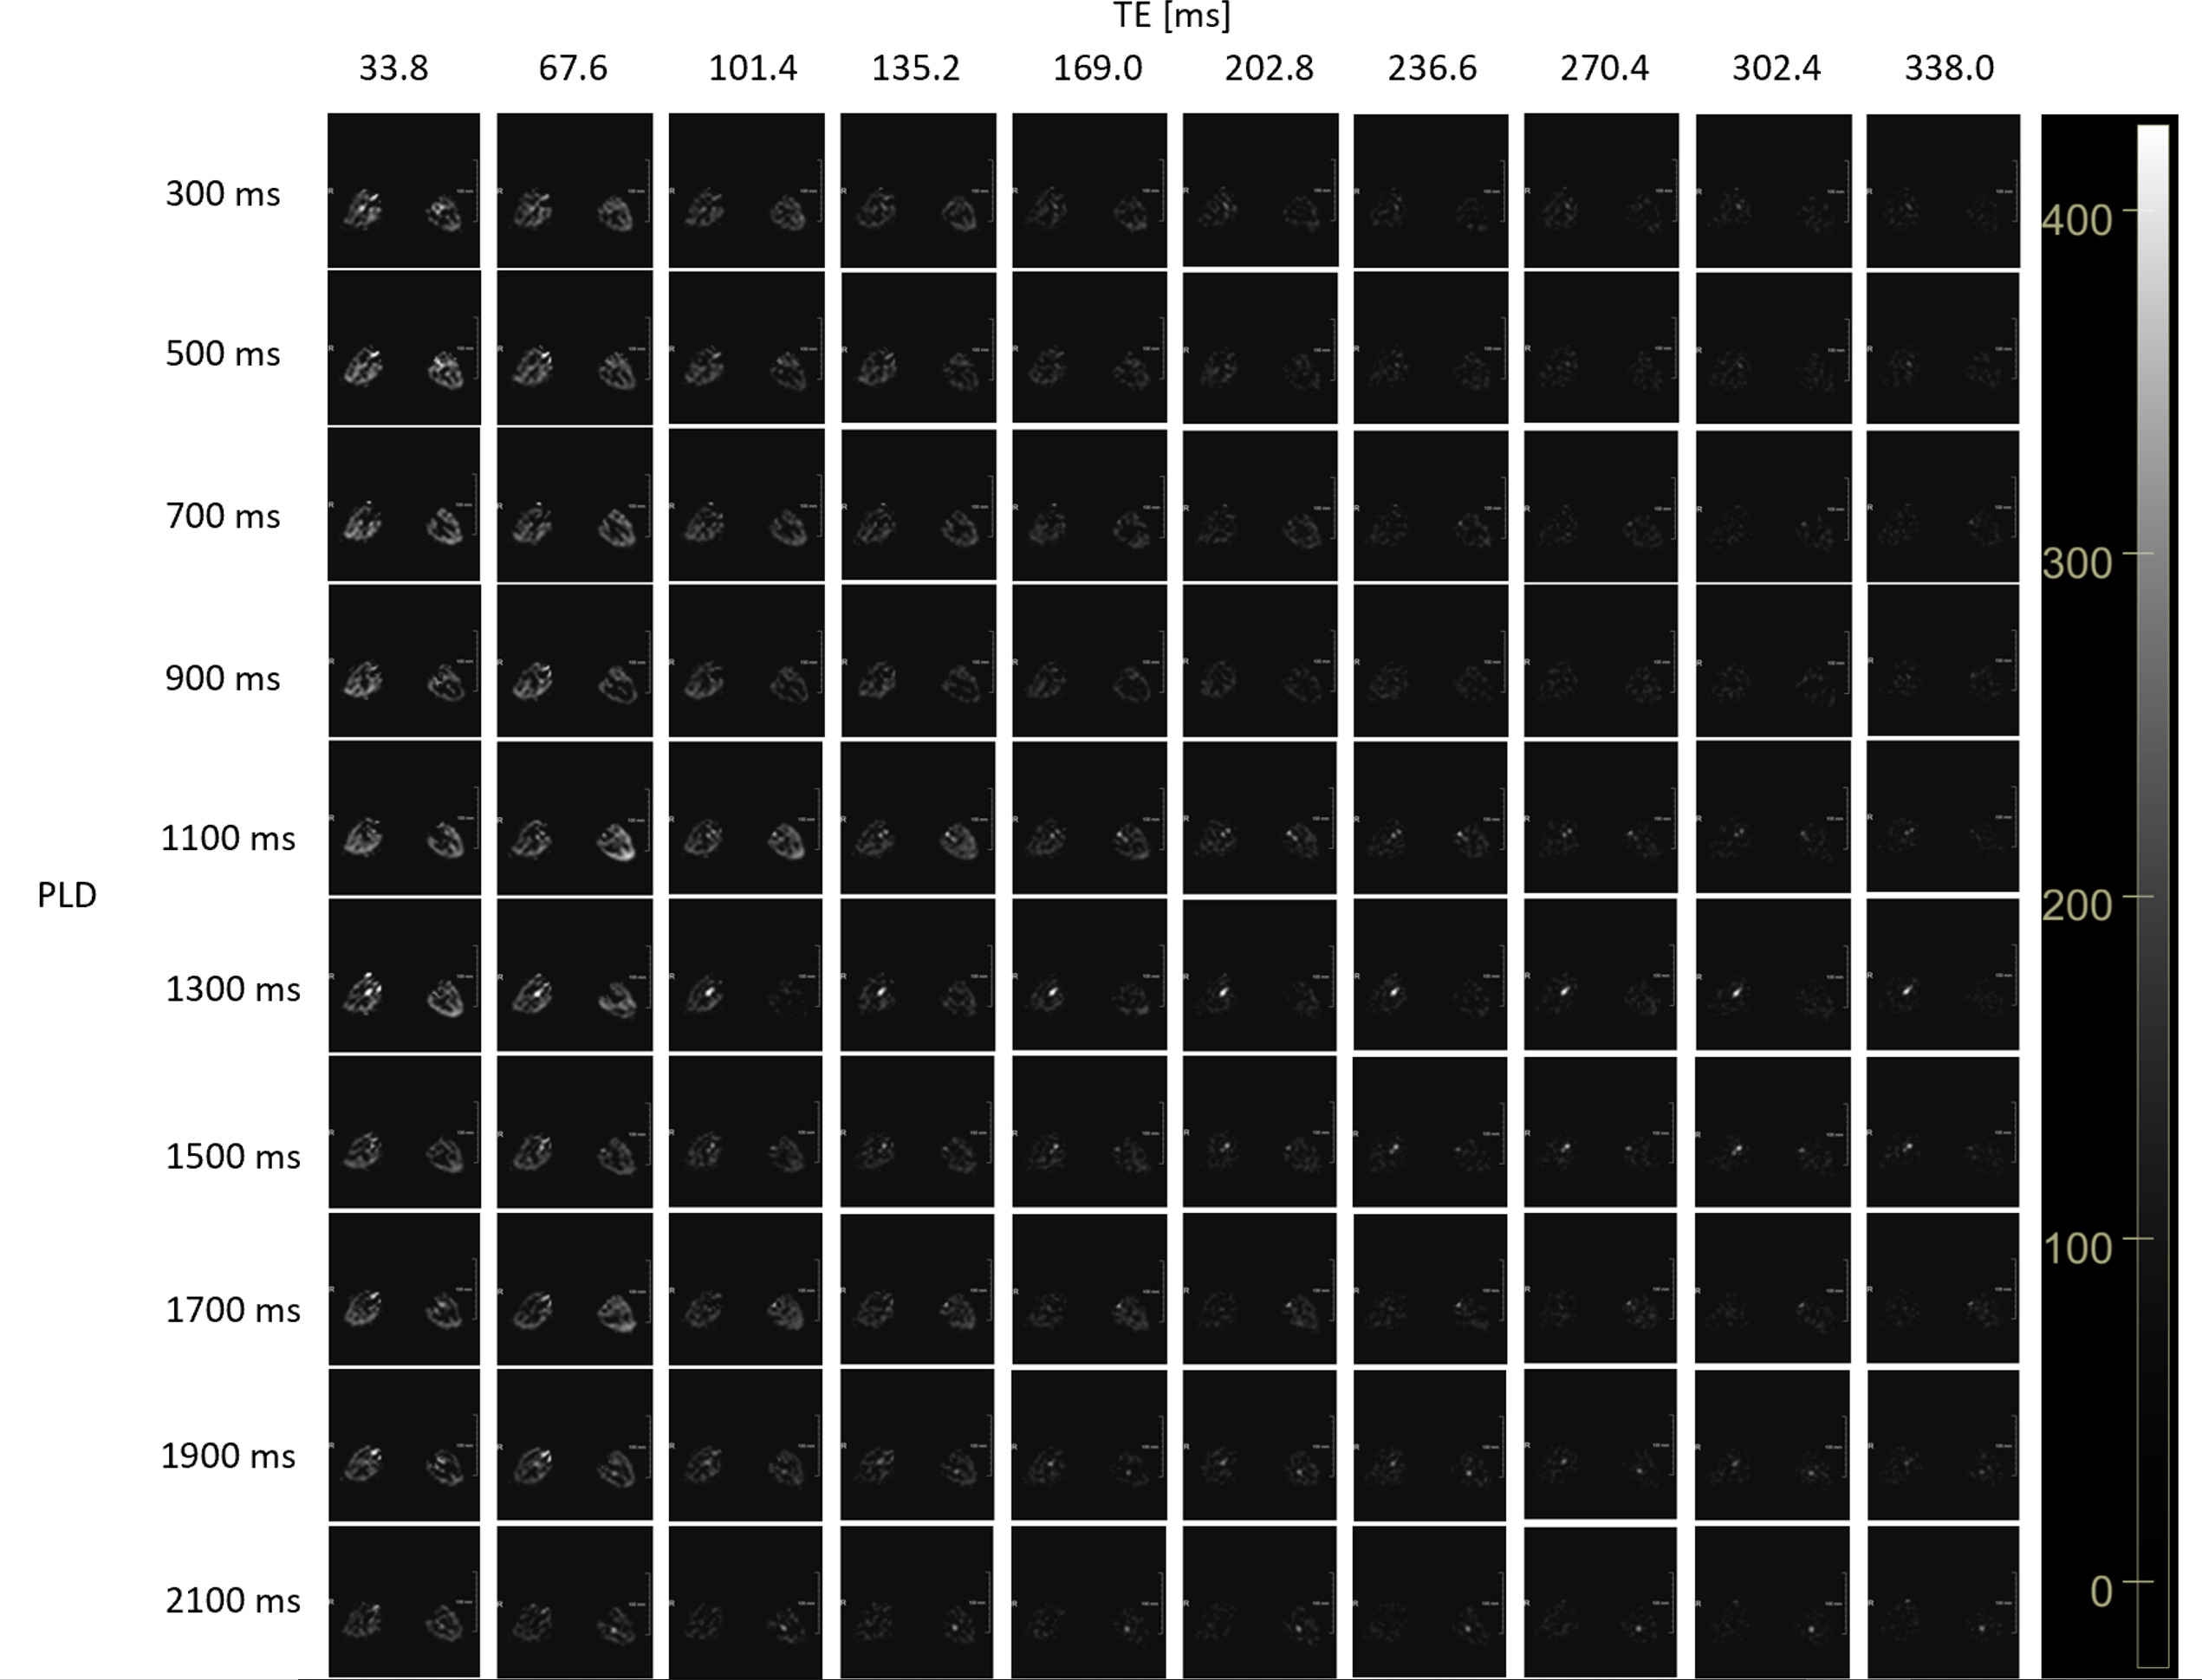
Three datasets were acquired with a pCASL sequence with transversal labeling of the aorta using an EPI readout to enable the acquisition of up to 10 TEs, all containing enough signal for fitting. The high number of TEs facilitates a precise T2-fit. The sequence was implemented using the vendor-agnostic MRI framework gammaSTAR5,6. A new subject was used for each dataset. For all datasets a breathholding protocol was used to minimize respiratory motion. All data was acquired using a 3T VidaFit MRI by Siemens Healthineers.The first acquisition used a with multi-PLD/LD sequence with three different inflow times (TI) with 25 repetitions. This aimed to compare T2 for early and late TIs. Dataset 2 contains two sets of 10 PLDs to showcase the course of T2 detailed during a longer period of TIs. For the last acquisition, four TIs were acquired focusing on detecting T2 changes in very late TIs. Table1 lists the exact parameters for all datasets.
The fitting of T2 was performed using MeVisLab (Fraunhofer MEVIS, Bremen). The average T2 was calculated for the kidney only considering values from 20-350ms. T2 values fitted outside this range were assessed as unrealistic. For the first dataset, an average for all 25 repetitions and the averages for 5 sets of 5 repetitions were calculated, to allow closer analysis of T2 progression. The following two datasets only allowed computing the average T2 of all repetitions.
Results
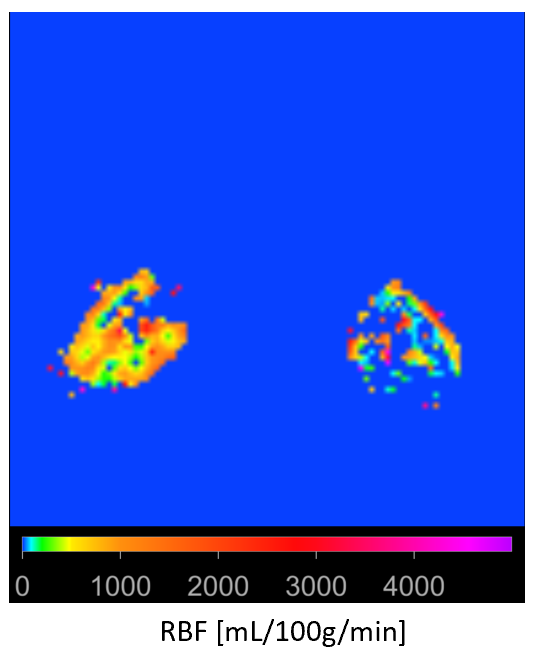
The data gave high quality perfusion-weighted images (PWI) of the kidney (Figure2). Dataset 2 was used to calculate perfusion with a single-compartment-model7, returning realistic results (Figure3).The exact quantitative results of the T2 comparison can be found in Table2. The first dataset shows no clear difference in T2 between the TIs and a high variance when calculating the average (Figure1). This is reinforced when examining the averages of the sets of five to closer analyze the course of T2 in the different repetitions. These vary too much to make out a clear trend. For the second dataset the variance is high enough to prohibit a statement about a distinct T2 progress. Additionally, the two sets of PLDs contradict each other in their estimated values. The last dataset aimed to capture late changes in T2. Though, in the PWIs the last two PLDs showed almost no signal, leading to unreliable results of the T2-fit. A counteractive smoothing showed no improvement. The early PLDs contained enough signal for calculations, though returning too high variance.
Therefore no significant change in T2 was detected contradicting our expectations.
Discussion
When examining the RBF-Map the different appearance of the kidneys is explained with positioning of the (FOV) and the position of the respective kidney in relation to it.All T2 results show high variance and no clear pattern of change in T2. This leads us to believe that there in fact is no distinct difference between T2 in intravascular and extravascular space. Other influencing factors might be that the model does not correctly mathematically describe the biophysical process; or the absence of motion correction. However, respiratory motion was minimized by using breathholding protocol. This leads to long TR, which was no issue here, since the data was strictly acquired for research with experienced probands. For a clinical setting a free breathing approach with prospective and retrospective motion correction would be a suitable option, as already shown in liver ASL8.
The lack of measurable differences in T2 for different TIs and therefore for the compartments contradicts our expectations. Hence a new approach to non-invasively measure renal filtration with diffusion weighting included in an ASL sequence will be tested in future work.
Conclusion
We showed a multi-TE multi-PLD ASL sequence with high image quality of reconstructed parameter maps to find differences in T2 values for confirming the feasibility of transferring the PLD two-compartment-model established in neuro imaging. Since no distinctly different T2 can be detected, we suggest a new approach including diffusion weighting to find physiological differences.Acknowledgements
No acknowledgement found.References
1 Gregori, J., Schuff, N., Kern, R., Günther, M. (2013). T2-based Arterial Spin Labeling measurements of blood to tissue water transfer in human brain. Journal of Magnetic Resonance Imaging. Vol.73(2), pp. 332–342.
2 Mahroo, A. et al.(2021). Robust Multi-TE ASL-Based Blood–Brain Barrier Integrity Measurements. frontiers in Neuroscience. Vol.15
3 Schidlowski, M., Boland, M., Rüber, T., Stöcker, T. (2020). Blood–brain barrier permeability measurement by biexponentially modeling whole-brain arterial spin labeling data with multiple T2-weightings. NMR in Biomedicine. Vol.33(10)
4 Milford, D., Rosbach, N., Bendszus, M., Heiland, S. (2015). Mono-Exponential Fitting in T2-Relaxometry: Relevance of Offset and First Echo. PLOS One.
5 Cordes, C., Konstandin, S., Porter, D., Günther, M. (2019, 10 21). Portable and platform-independent MR pulse sequence programs. Magnetic Resonance in Medicine. Vol.83(4), pp. 1277-1290
6 Fraunhofer MEVIS. gammaSTAR v1.0.16. url: https://gamma-star.mevis.fraunhofer.de/#/ (accessed: 14:33 Oct. 11th 2022, Germany)
7 Buxton R. B. et al. (1998). A general kinetic model for quantitative perfusion imaging with arterial spin labeling. Magnetic Resonance in Medicine. Vol.40(3), pp. 383-396
8 Huber, J., Günther, M., Channaveerappa, M., Hoinkiss, D. C. (2022). Towards Free Breathing 3D ASL Imaging of the Human Liver using Prospective Motion Correction. Magnetic Resonance in Medicine. Vol.88(2), pp. 711-726
Figures
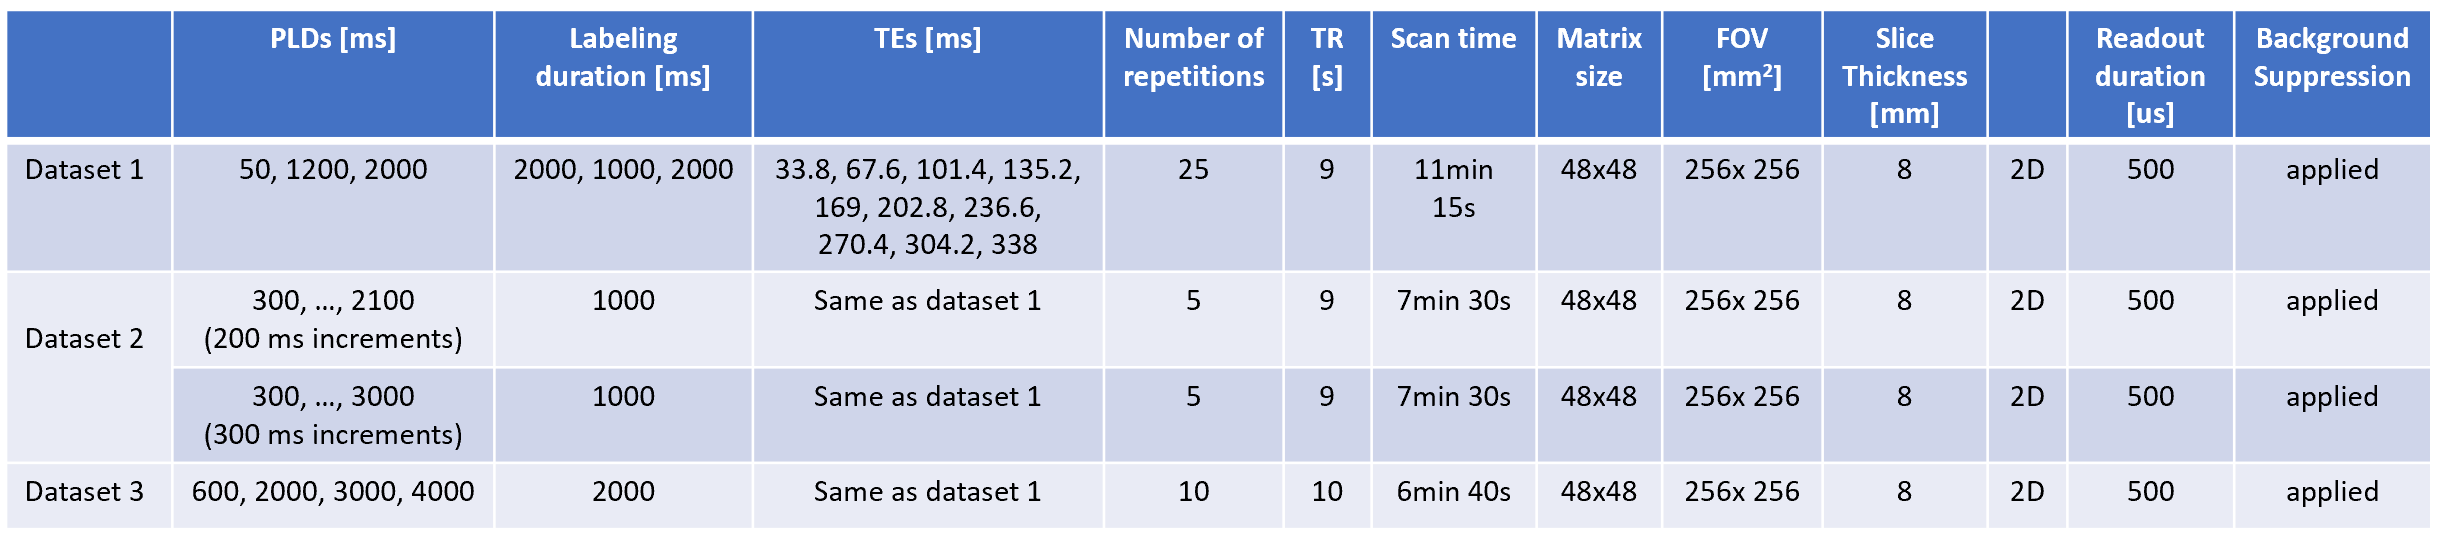
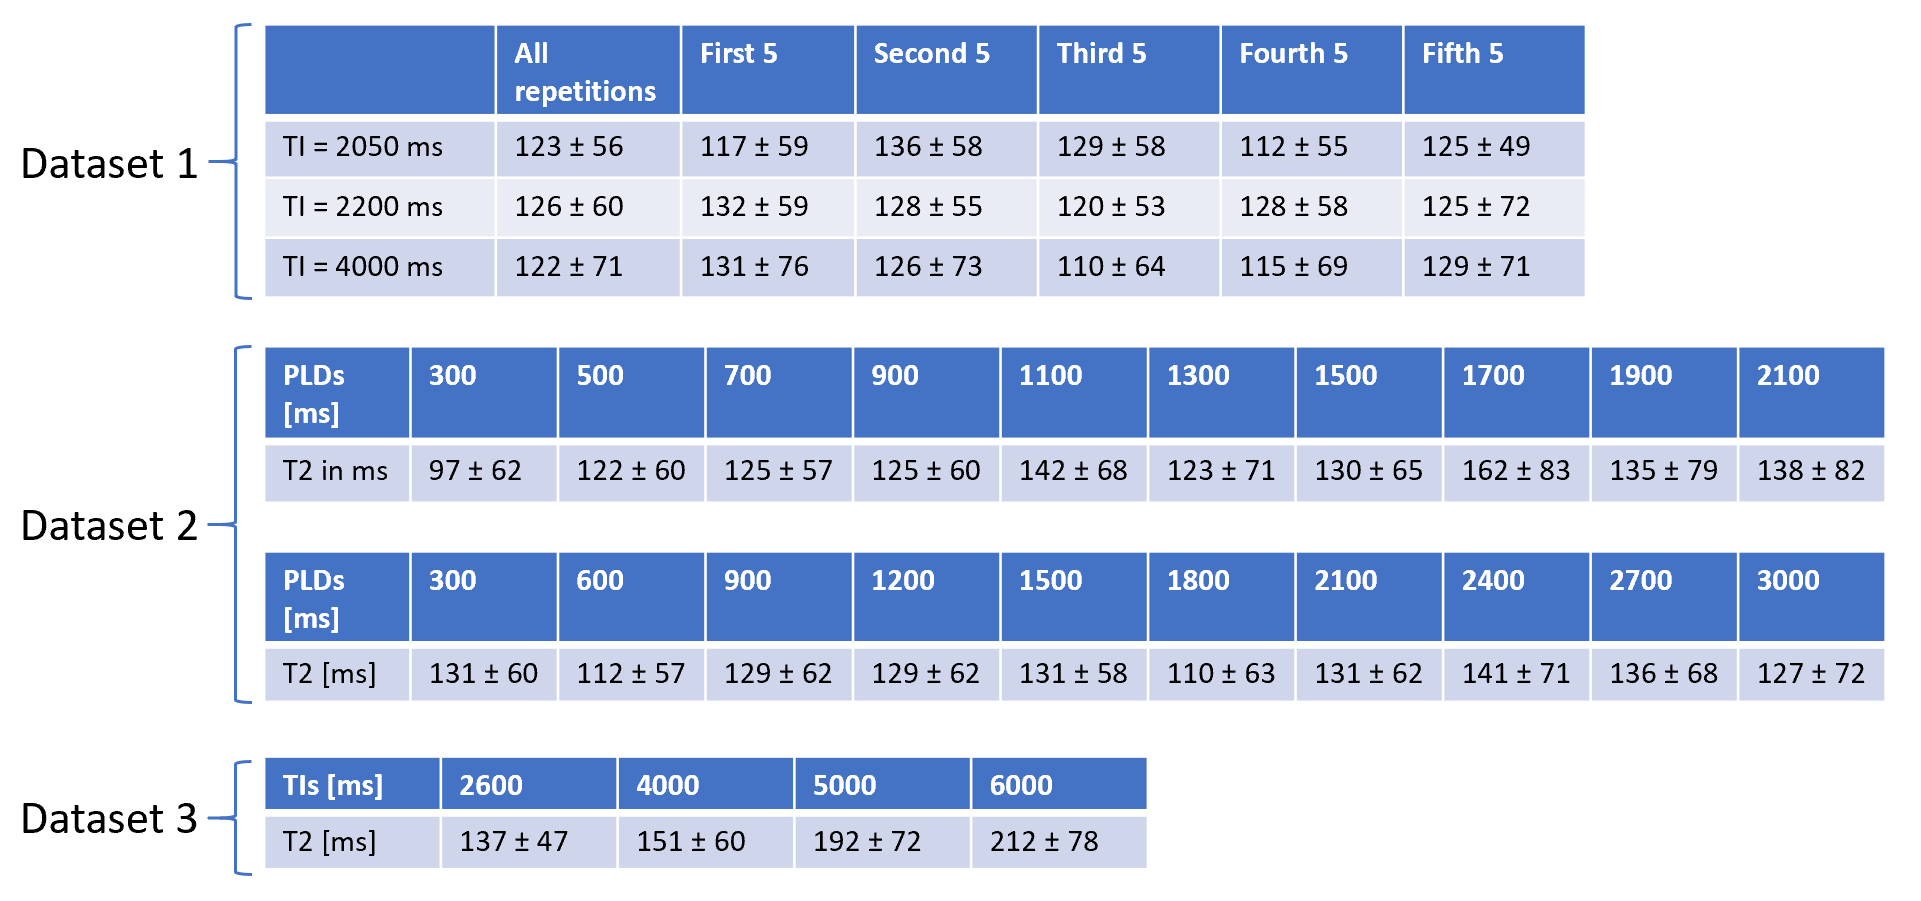
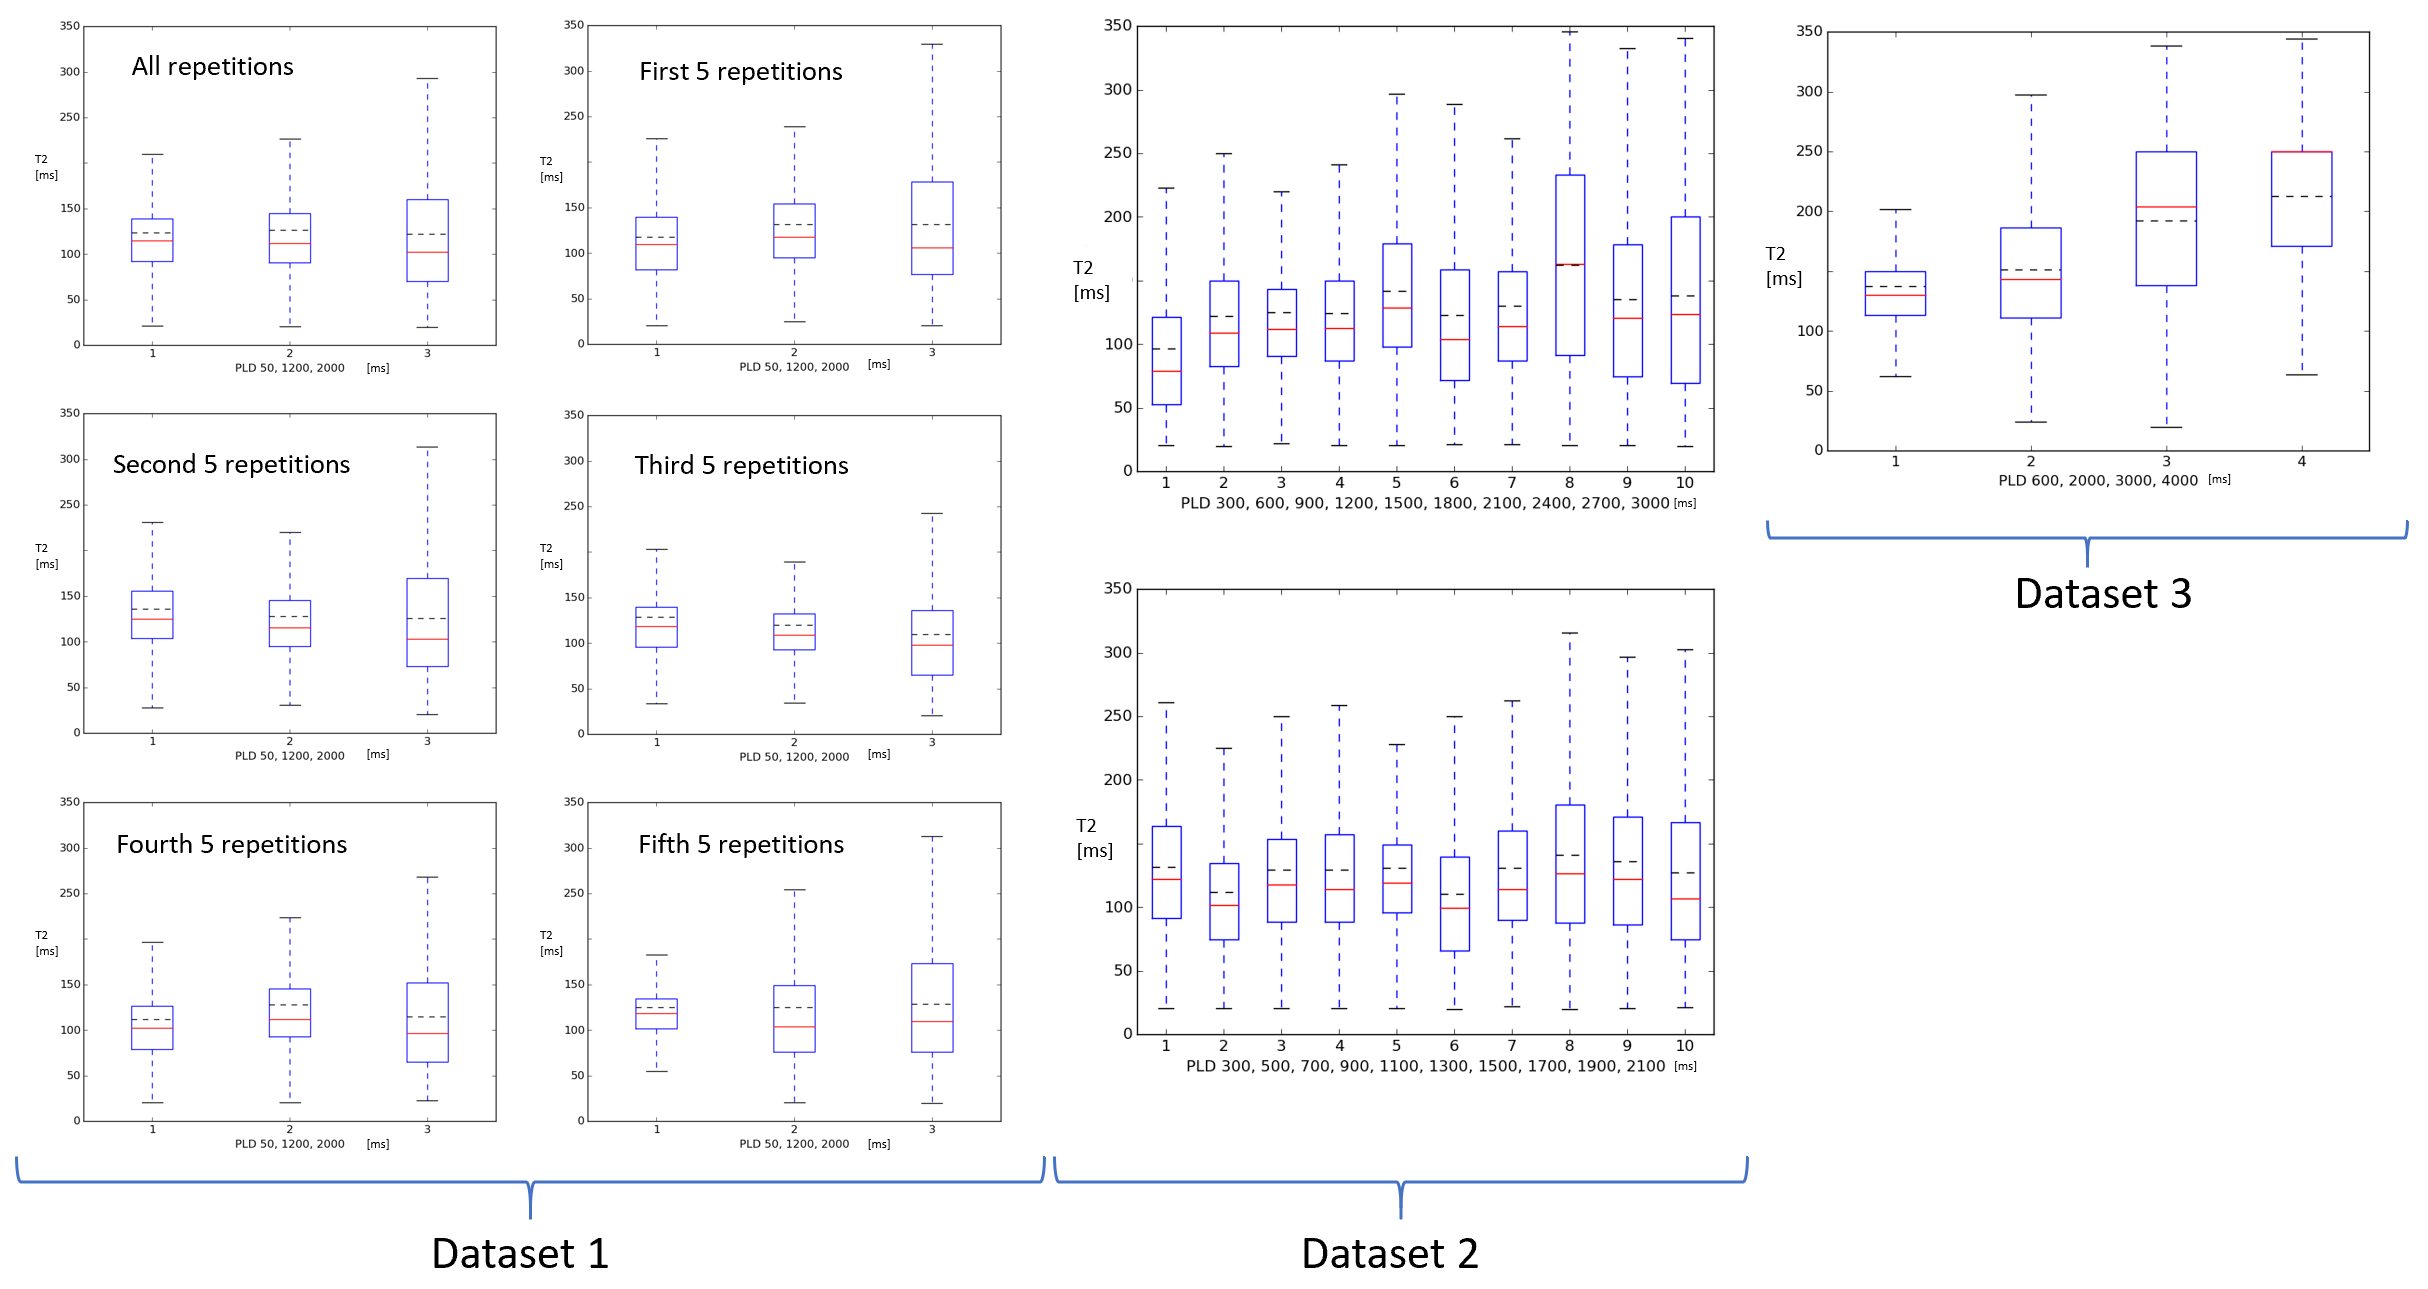
Figure1:
Boxplots of all T2 averages. These display the median (red line) and the mean (black dashed line)of the T2 values at there respective PLDs of the datasets, the upper and lower quartile as the box and the range of data in form of the whiskers