2759
Spatiotemporal redundancy based denoising method in arteprial spin labeling MRI: A ticket to free sensitivity improvement1Department of electronic science, Xiamen University, Xiamen, China, 2Clinical & Technical Support, Philips Healthcare, Beijing, China, 3Russell H. Morgan Department of Radiology and Radiological Science, Johns Hopkins University School of Medicine, Baltimore, MD, United States
Synopsis
Keywords: Arterial spin labelling, Data Processing, Denoising
Arterial-spin-labeling (ASL) MRI has been widely used in neurological studies for investigating brain activity via focusing on regional perfusion differences. However, sensitivity is a general issue in ASL MRI to prevent the high-resolution comparisons of perfusion heterogeneity, which are associated with pathological process, or lead to prolonged scan time, which inhibits the temporal resolution in monitoring acute-stage perfusion changes (e.g., perfusion recovery after spontaneous resuscitation in cardiac arrest). Therefore, in this study, a post-processing method exploring spatiotemporal redundant information of ASL data is proposed to enhance the sensitivity without extending scan durations.Introduction
Arterial spin labeling (ASL) MRI is a powerful technique to measure cerebral blood flow (CBF) noninvasively by tracing the accumulation of magnetically labeled arterial blood water, which has gained importance in the research of neurological diseases, particularly, vascular dysfunctions1. Compared to the popular functional MRI using blood oxygenation level dependent (BOLD) effect with complicated contributions from multifaceted microvascular physiologies, ASL MRI is advantageous in terms of immediately representing the spatial location and quantitative correction of brain activity2. However, the inherent low signal-to-noise ratio (SNR) induced by the relatively small signals pertaining to CBF limits a broader application of ASL MRI. Signal averaging across numerous repetitions is a commonly used strategy to improve the SNR, however, at the expense of increasing total scan time and thus is improper for time-critical applications, e.g., in acute-stage monitoring of stroke or less cooperative subjects like neonates. An alternative is to exploit the redundant information embedded in ASL data to enhance the SNR3. In this abstract, a denoising approach based on subspace-based non-local similarity constraint and local-smoothness regularization is proposed for ASL MRI, which can efficiently exploit the non-local similarity in the spatial domain, spatiotemporal local-smoothness prior and global structure similarity within the control and labeled images of ASL dataset.Methods
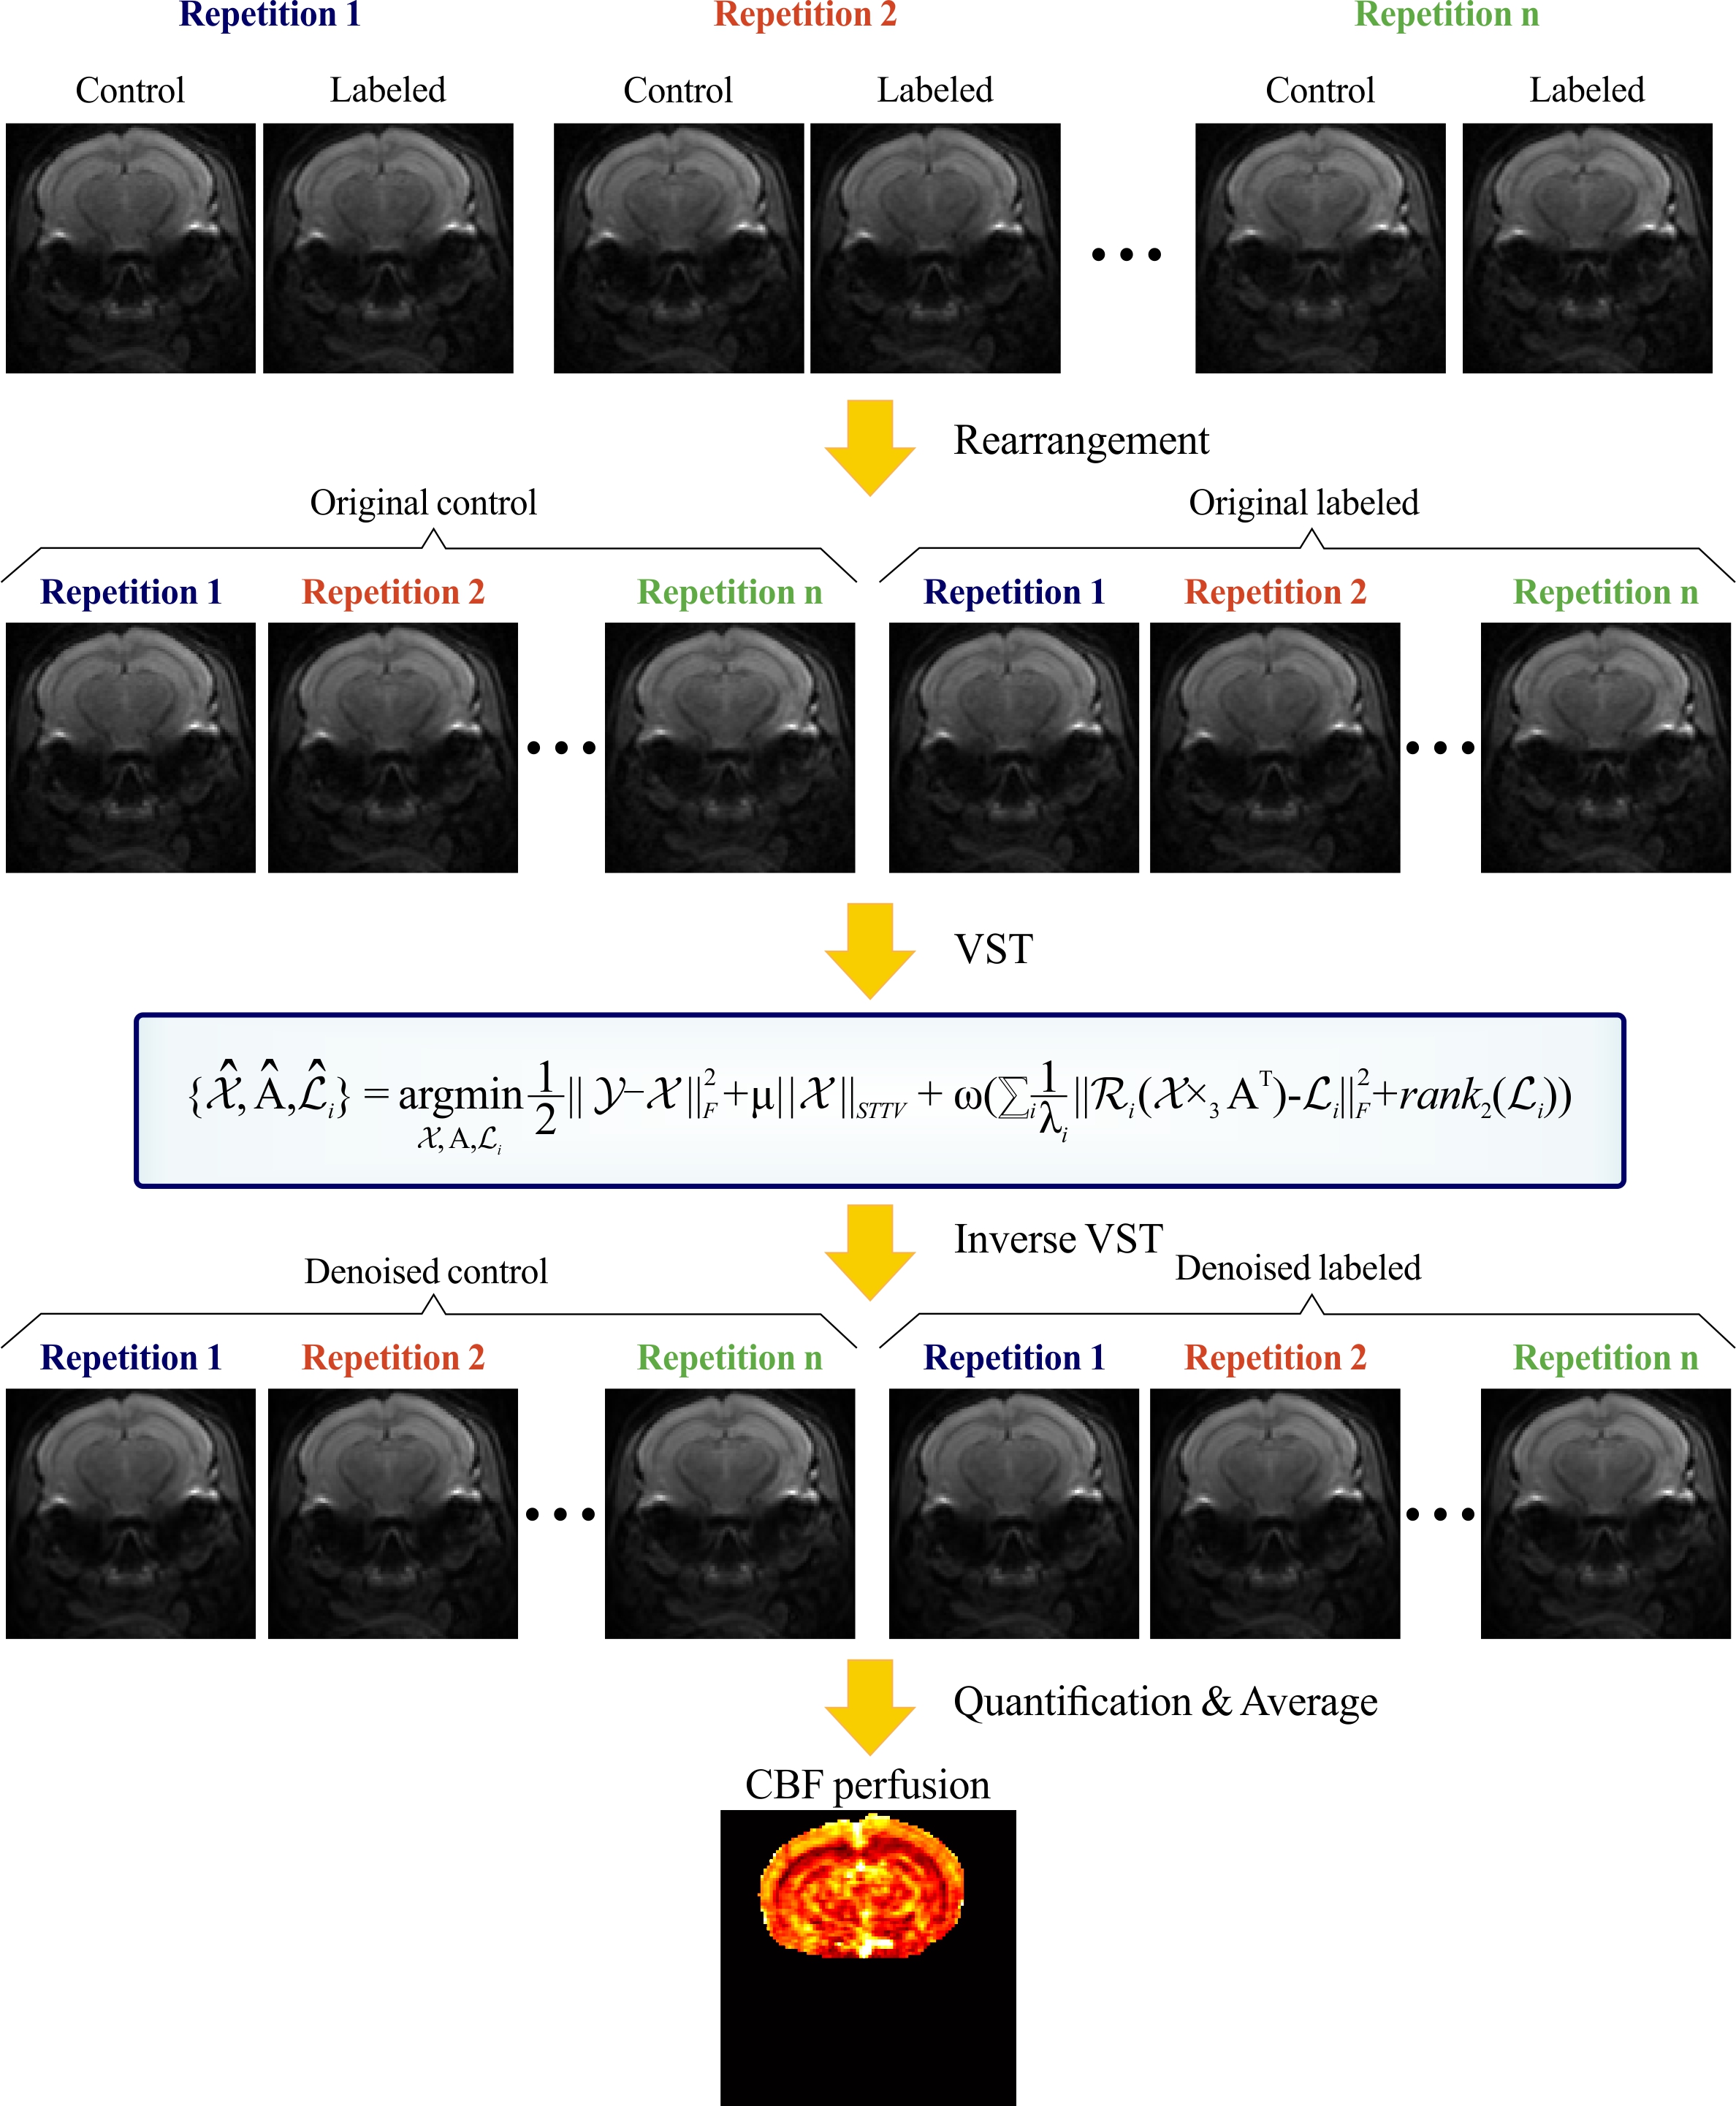
Theory of the proposed method: The general framework of the proposed method is shown in Figure 1. The ASL images were rearranged into control and labeled groups to enhance temporal local smoothness. The forward variance-stabilizing transformation (VST) was employed to convert signal-dependent Rician noise in ASL images into additive Gaussian-distributed noise. By combining the data fidelity term and regularization terms, our reconstruction model was shown in Figure1. The first term was the data fidelity term, which provided the similarity between denoised data and measured data. The second term refered to the spatial-temporal local smoothness prior exploited by spatiotemporal total variation (STTV). The third term described the decomposition of ASL data into subspace domain according to the low-rank property, and subsequently applying non-local similarity constraint in subspace domain. The AM and ADMM algorithms were used to solve the above optimization problem.In vivo experiment: The in vivo experiment was performed on a horizontal bore 11.7 T Bruker Biospec system (Bruker, Ettlingen, Germany) using a two-scan pseudo-continuous ASL sequence4 (FOV=15×15 mm2, matrix size=96×96, thickness=0.75 mm, labeling pulse duration=500 µs, inter-pulse delay=1 ms, total labeling duration=1800 ms, spin-echo echo-planar-imaging acquisition in two segments) for a C57BL/6 mouse. ASL images with different numbers of control/labeled (C/L) pairs were utilized to validate the efficiency of the proposed method.
Results and Discussion
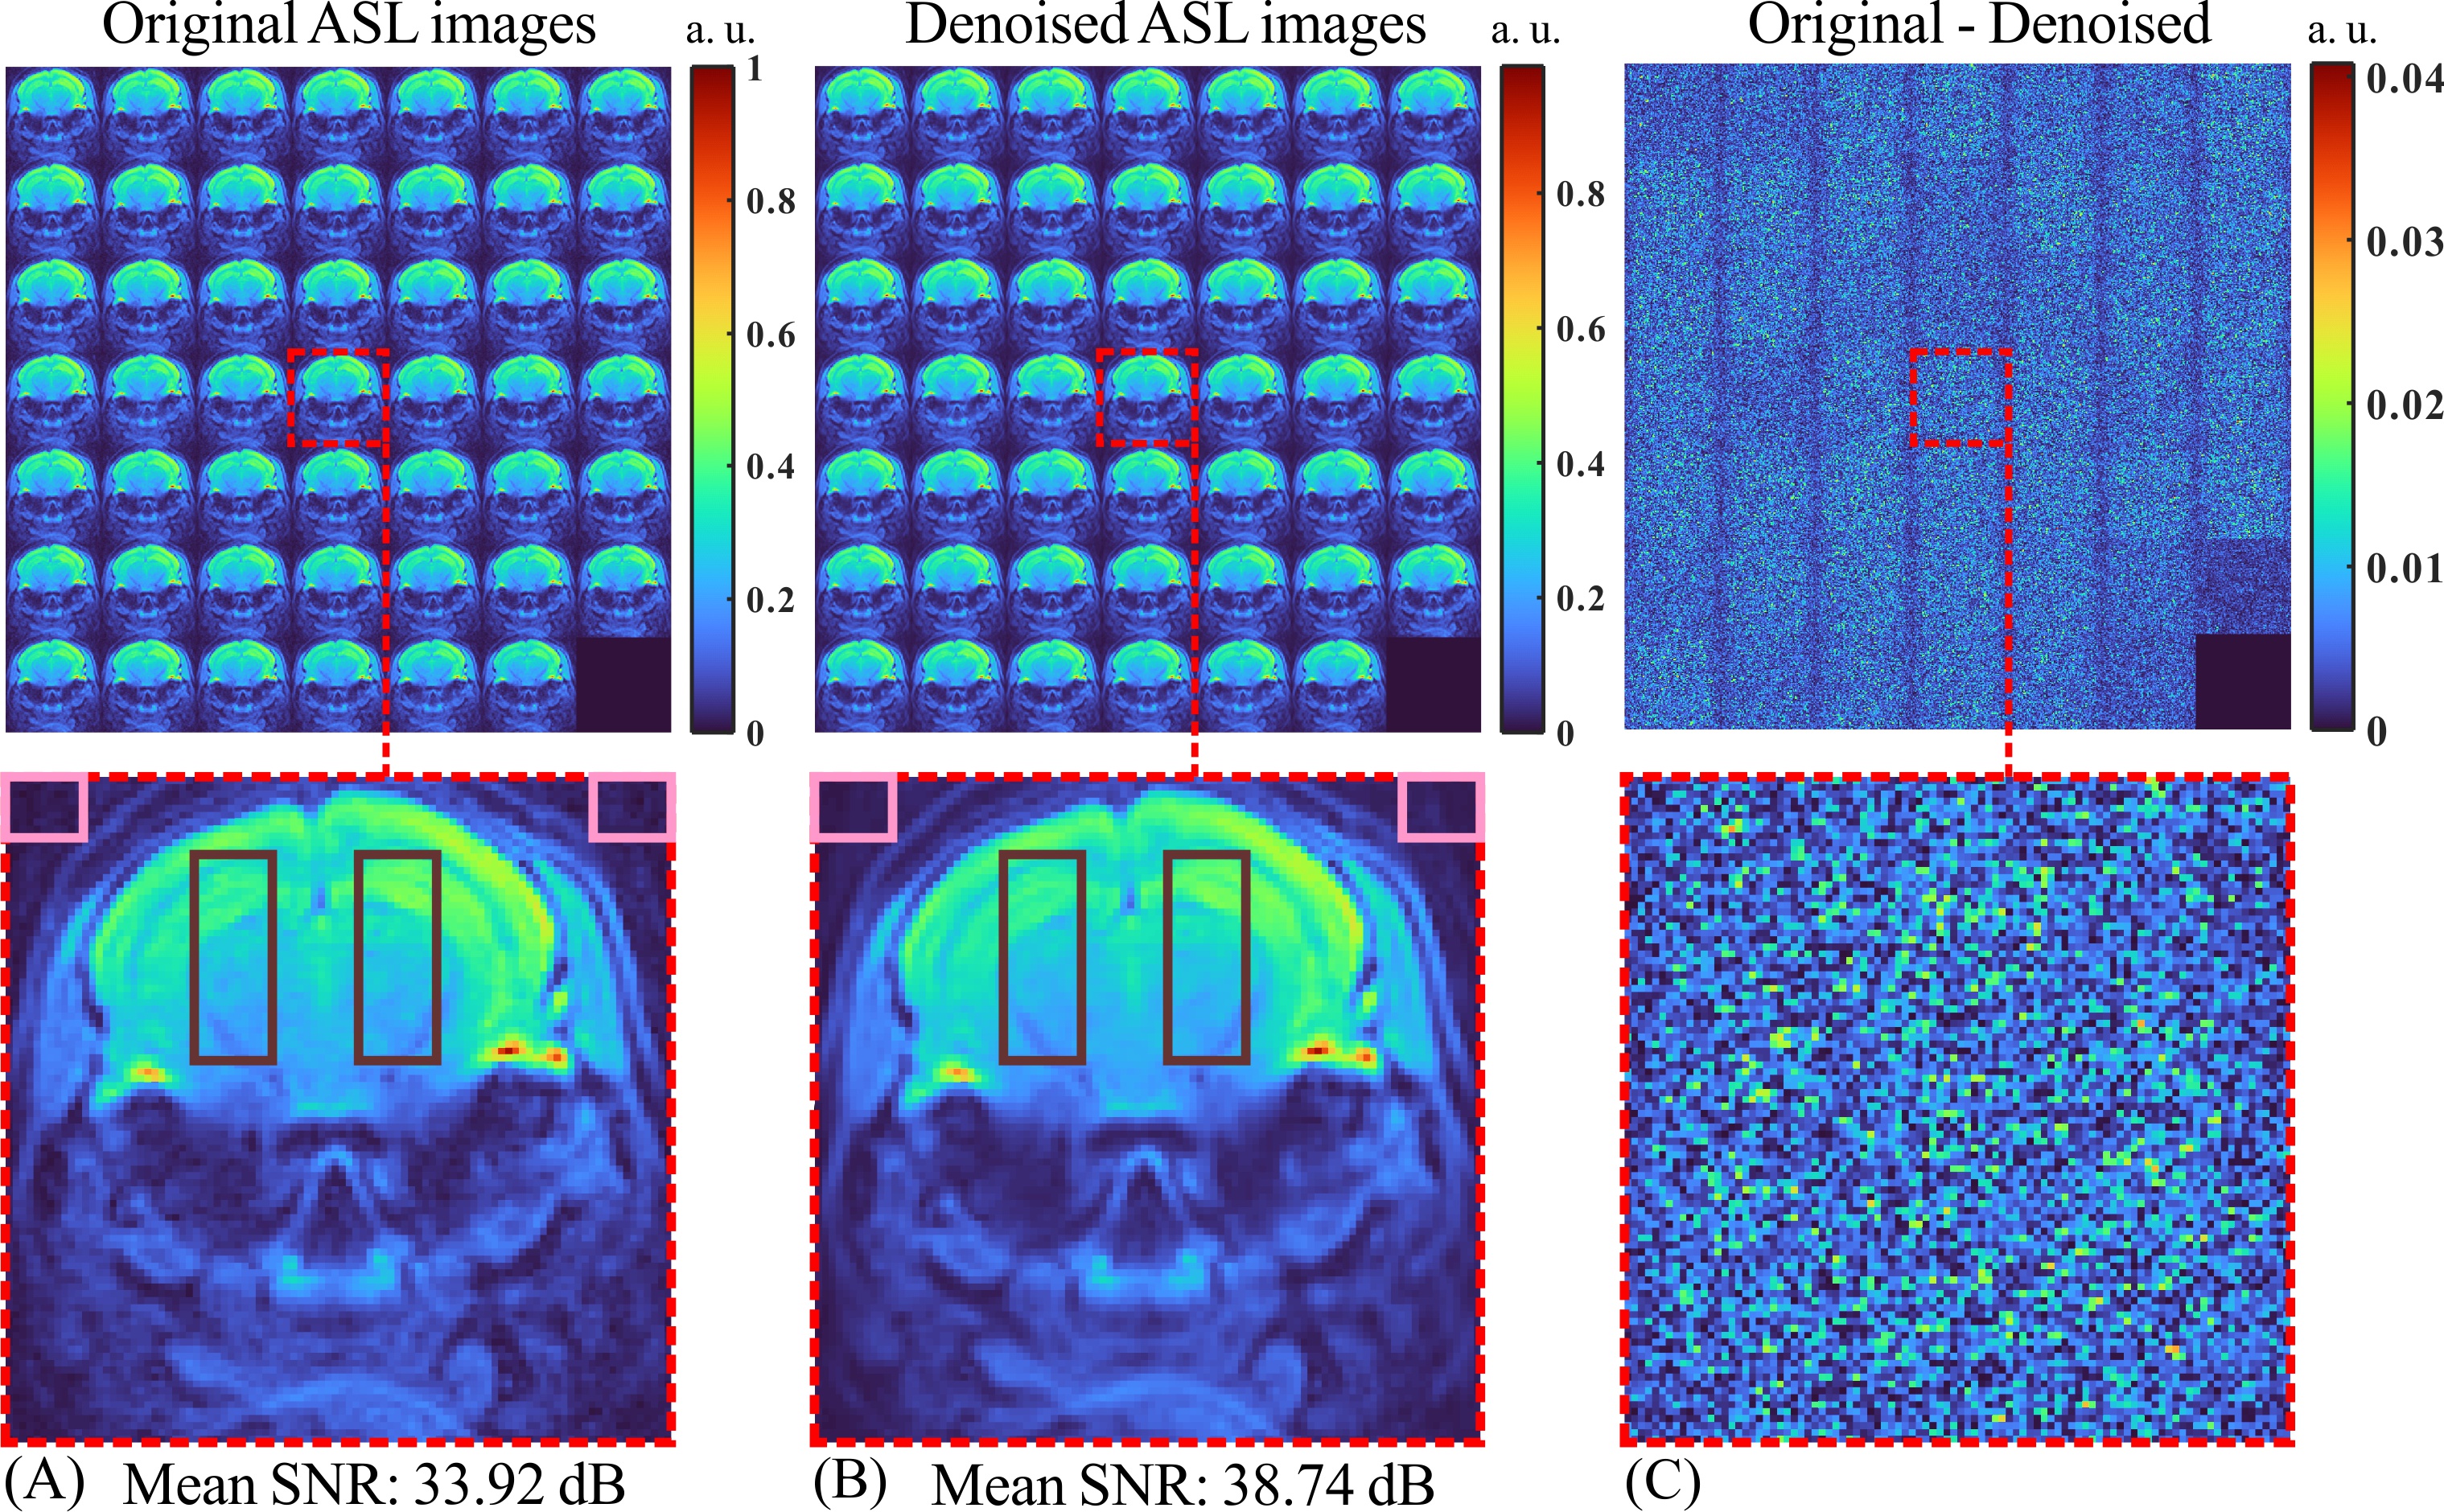
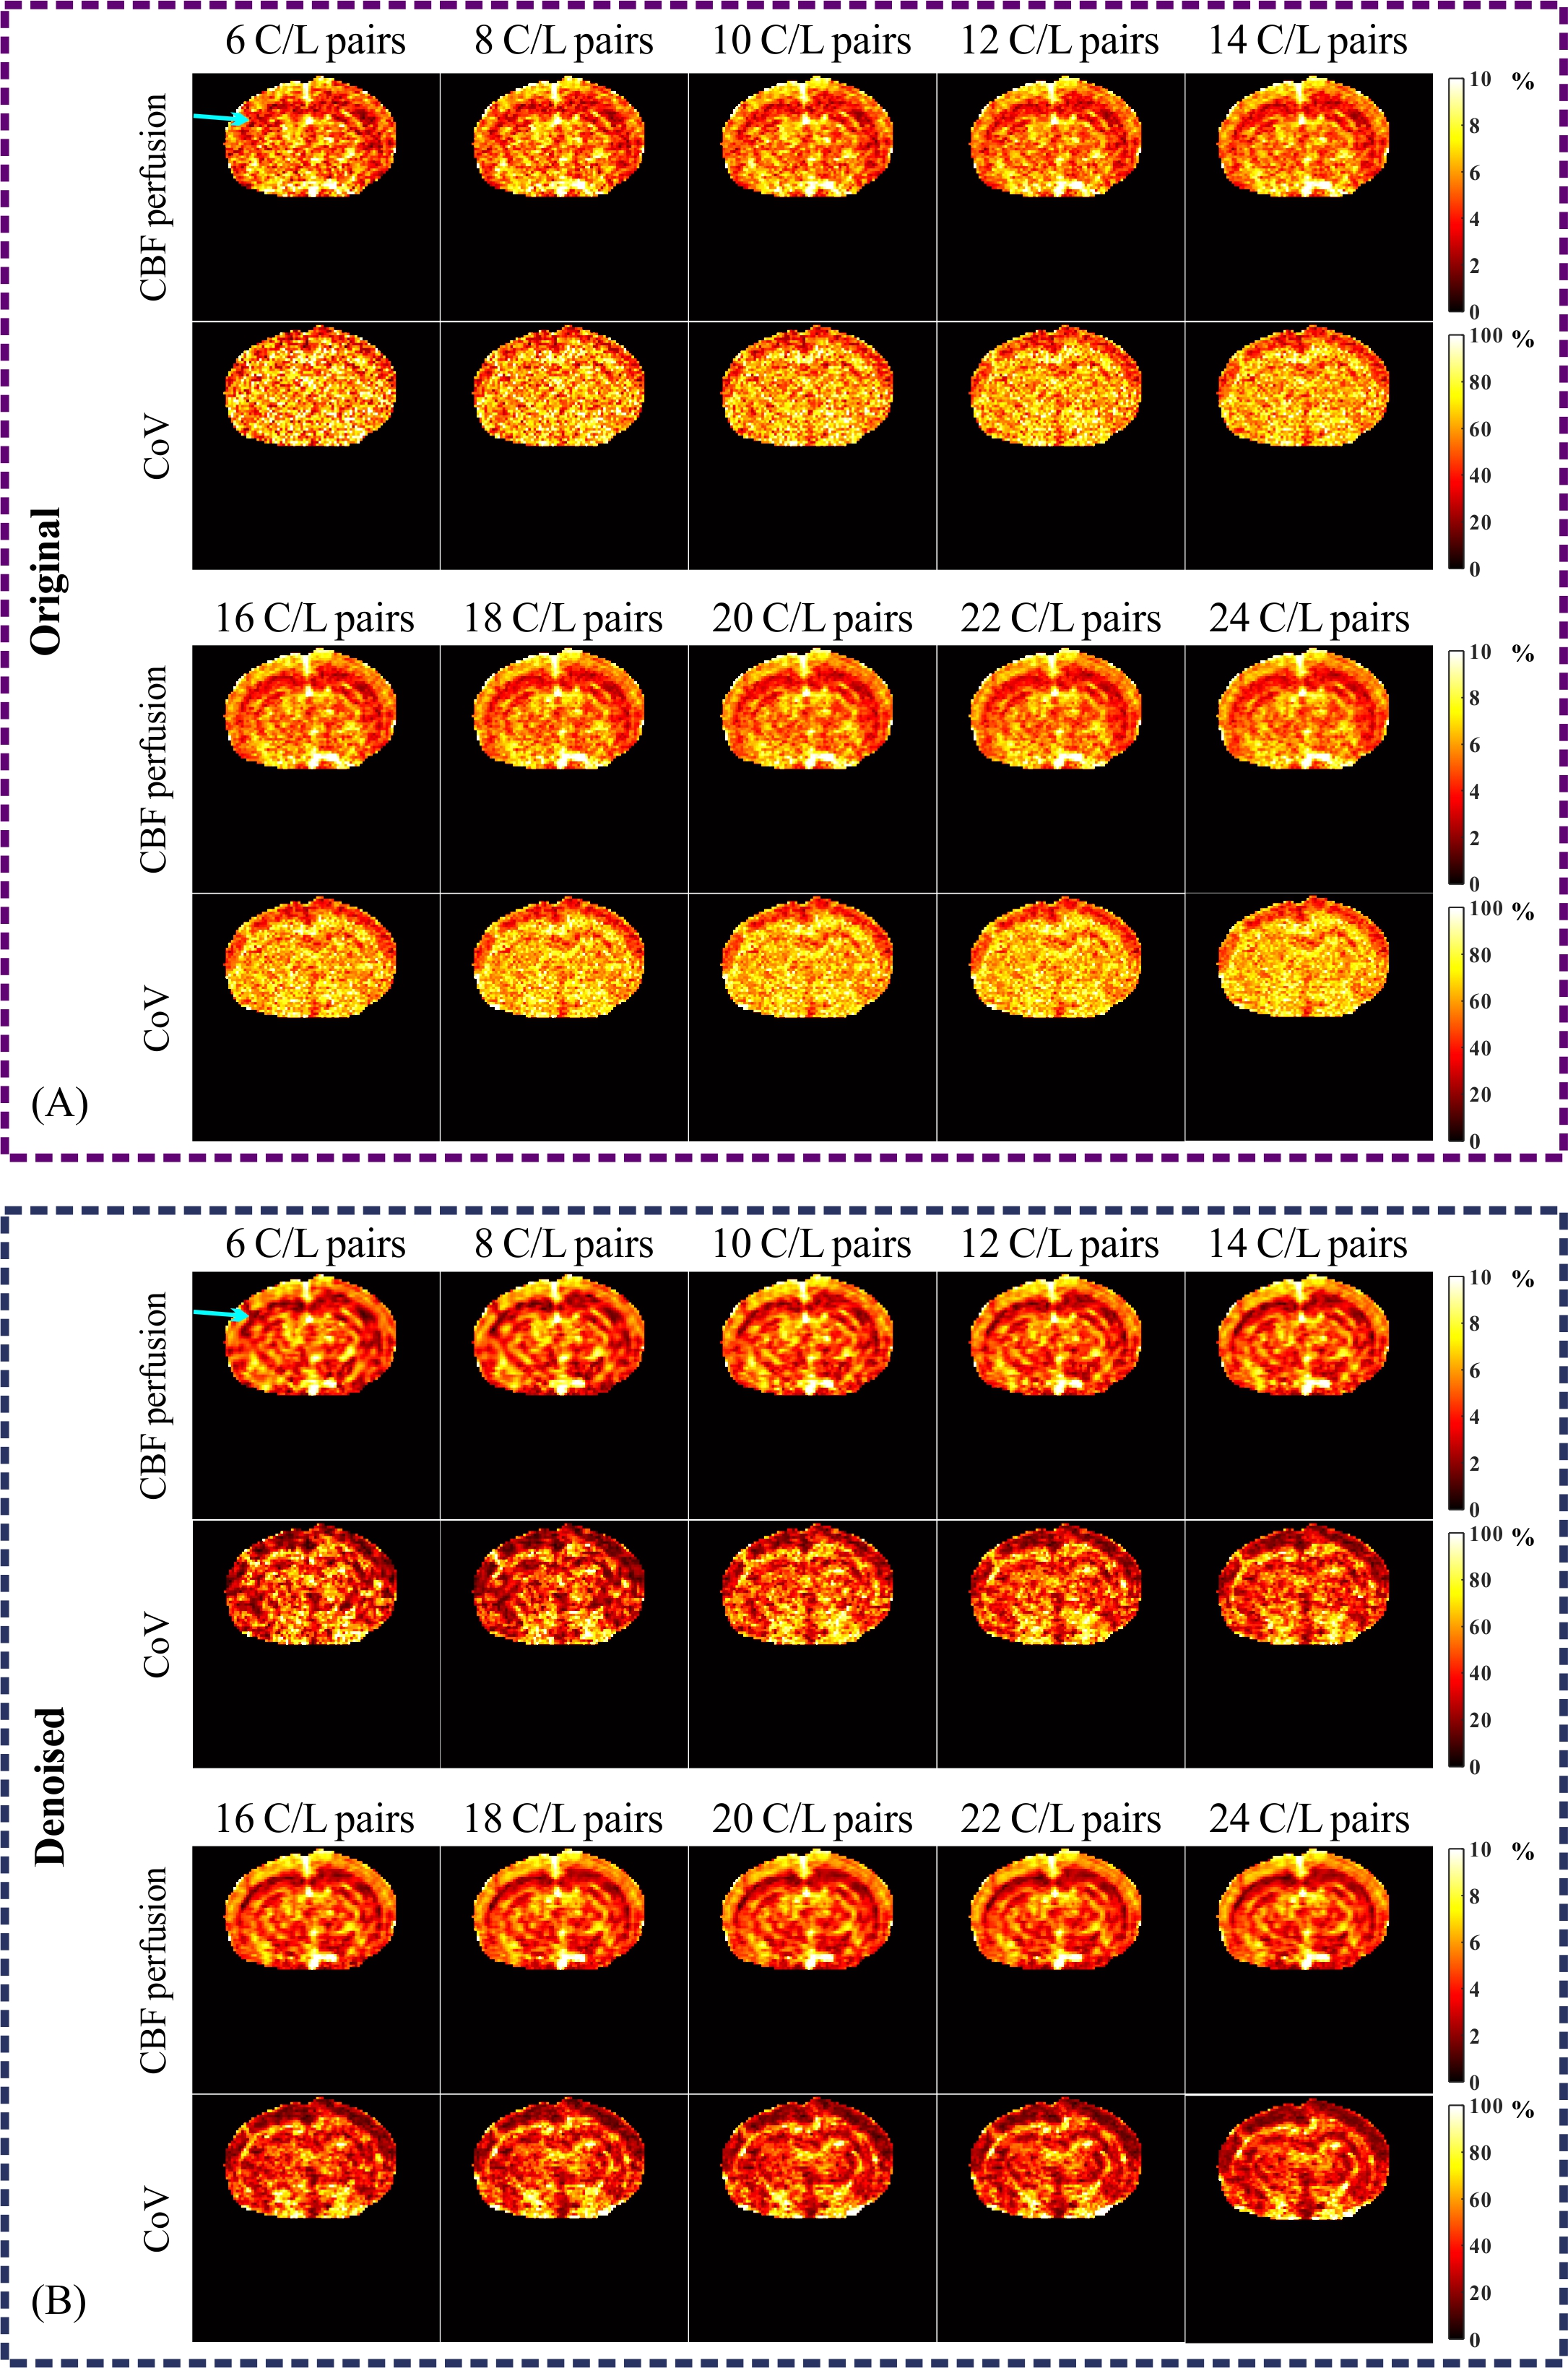
The denoising results for 24 C/L image pairs are shown in Figure 2. From the difference maps (Figure 2C), it’s evident that noise was substantially eliminated with minimal loss of spatial information.Figure 3 presents the perfusion maps and coefficient-of-variation (CoV) maps with and without our denosing method at different number of C/L PAIRS. It can be noticed that the grey-white matter contrast pointed by blue arrows (cerebral cortex and corpus callosum) has been improved by the denosing method at each repeition number. The original perfusion map started to show clear grey-white matter contrast with 12 averages. By contrast, the denoised perfusion map exhibited comparable contrast with 6 aveages, suggesting a potential advantage in shortening the scan duration without losing the desired contrast. On the other hand, if the total 24 averages were used, the denoised perfusion map exhibited prominent imporvements in SNR as indicated by the disappearance of scattering hyperintensities in the deep brain region (thalamus and hypothalamus), suggesting the potential to persue higher resolution to reveal local perfusion alteration of small regions. We have also calculated the CoV on a voxel basis across different repetitions (Figure 3). It is clear that CoV values were suppressed globally with the denosing method, suggesting improved reproducibility.
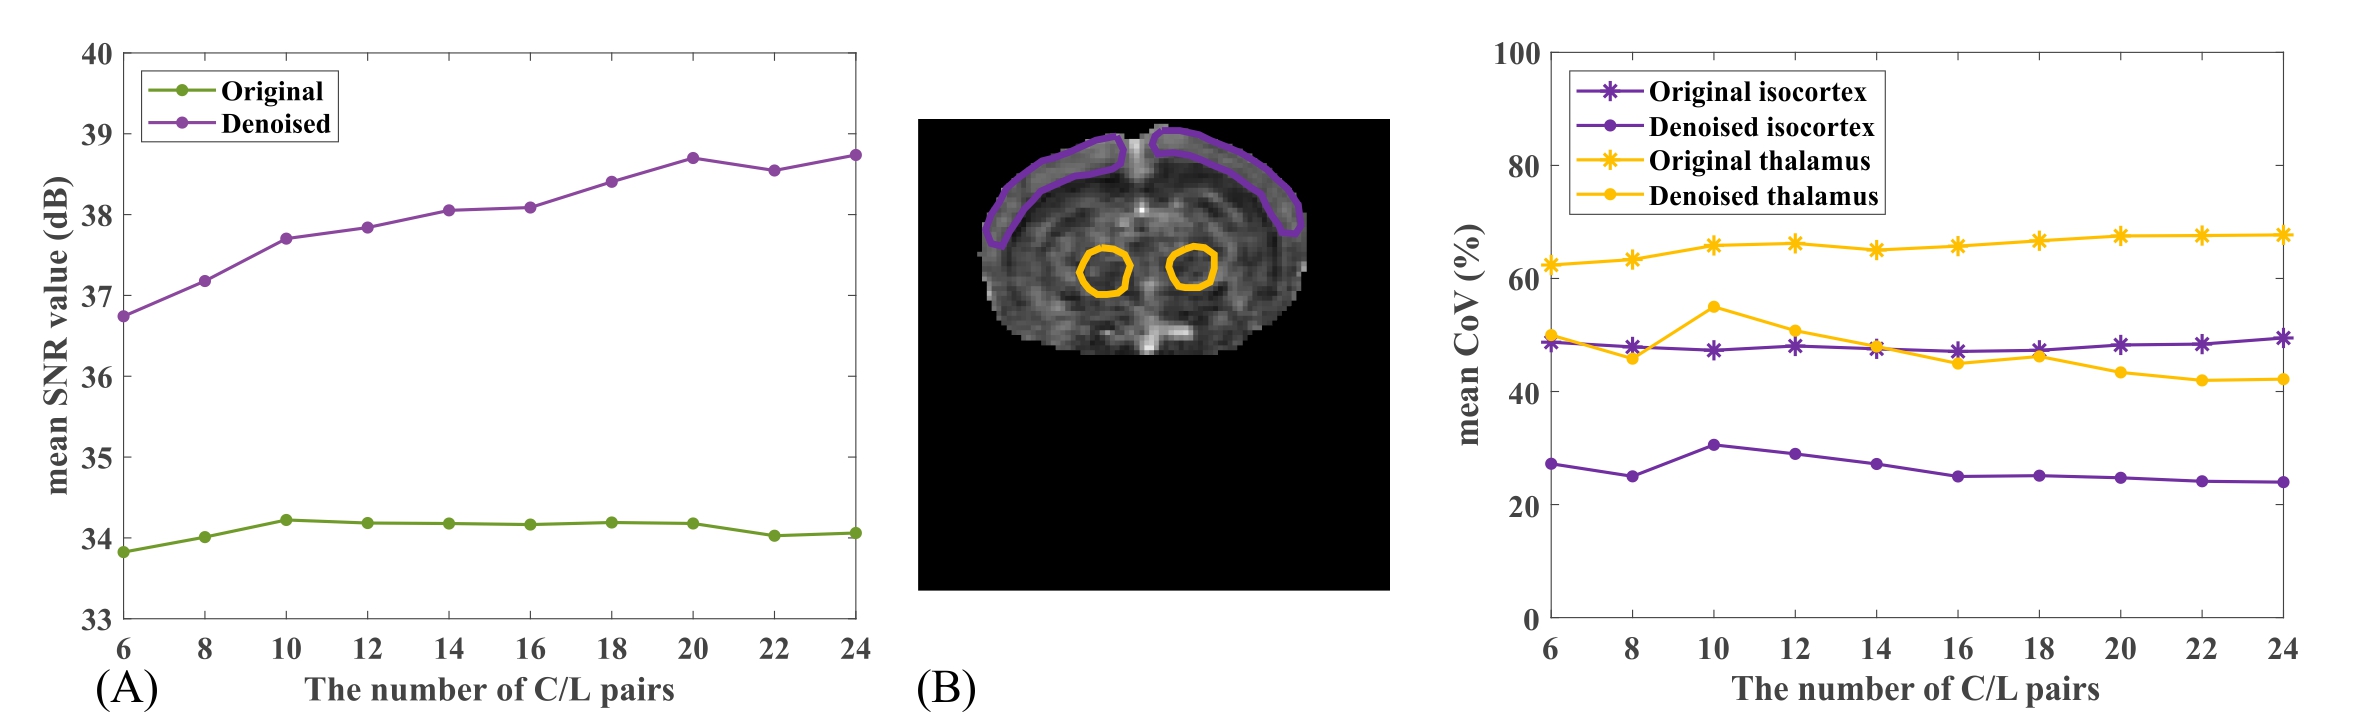
The mean signal-to-noise ratio (SNR) (a region covering parts of cerebral cortex, hippocampus, thalamus, and hypothalamus was used to represent the signal intensity from superficial cortex to deep brain; and a region at the boundary of FOV outside of the mouse brain was used to denote noise) was employed for performance evaluation, and significant improvement can be observed after denoising. Figure 4A shows the SNR improvements as a function of different repetition numbers. It can be observed that SNR was at least more than 2.92 dB higher compared to the original images. Note that the SNR of denoised images keeps increasing with the number of C/L pairs since more repetition can enhance the low-rank property of ASL data, which benefits our method. Meanwhile, the mean CoV of the denoised images is at least 35% lower in the isocortex and at least 17% lower in thalamus regions compared to the original images (Figure 4B), suggesting significant improvement in the reproducibility.
Conclusion
In this work, we introduce a subspace-based non-local similarity constraint and local-smoothness regularization approach to enhance signal quality in ASL MRI. By jointly incorporating more prior information, our method can substantially improve the SNR of ASL data with reduced repetitions, which will facilitate the application of ASL MRI in the research of neuroscience.Acknowledgements
This work is supported by Science and Technology Project of Fujian Province, grant number 2022J05013.References
1. Zhang, N, Gordon, ML, Goldberg, TE, 2017. Cerebral blood flow measured by arterial spin labeling MRI at resting state in normal aging and Alzheimer’s disease. Neurosci. Biobehav. Rev. 72, 168–175.
2. Ivanov D, Gardumi A, Haast RAM, Pfeuffer J, Poser BA, Uludag K. Comparison of 3T and 7T ASL techniques for concurrent functional perfusion and BOLD studies. Neuroimage 2017;156:363–76.
3. Spann SM, Kazimierski KS, Aigner CS, Kraiger M, Bredies K, Stollberger R. Spatio-temporal TGV denoising for ASL perfusion imaging. Neuroimage. 2017;157:81-96
4. Hirschler L, Debacker CS, Voiron J, Kohler S, Warnking JM, Barbier EL. Interpulse phase corrections for unbalanced pseudo-continuous arterial spin labeling at high magnetic field. Magn Reson Med 2018;79(3):1314-1324.
Figures