2756
A Mathematical Model for Velocity-Selective Arterial Spin Labeling1Center for fMRI, University of California San Diego, La Jolla, CA, United States, 2Department of Radiology, UCSD, La Jolla, CA, United States, 3Department of Psychiatry, UCSD, La Jolla, CA, United States, 4Department of Bioengineering, UCSD, La Jolla, CA, United States, 5Department of Electrical and Computer Engineering, UCSD, La Jolla, CA, United States
Synopsis
Keywords: Arterial spin labelling, Arterial spin labelling
A mathematical model is presented that describes the arterial delivery function and cerebral blood volume components in velocity-selective arterial spin labeling. The model incorporates physiologically valid approximations of changes in acceleration and velocity along the vascular system. Applications of the model are shown using a set of example labeling and saturation profiles.Introduction
Velocity-selective arterial spin labeling (VSASL) labels blood based on its velocity1,2. While the key features of VSASL have been described in prior work1,2, a detailed mathematical model describing the interaction between the labeling process and the velocity profile of the vasculature has been lacking. Here we present a model that explicitly describes the VSASL arterial delivery function, as well as cerebral blood volume (CBV) contributions.Theory
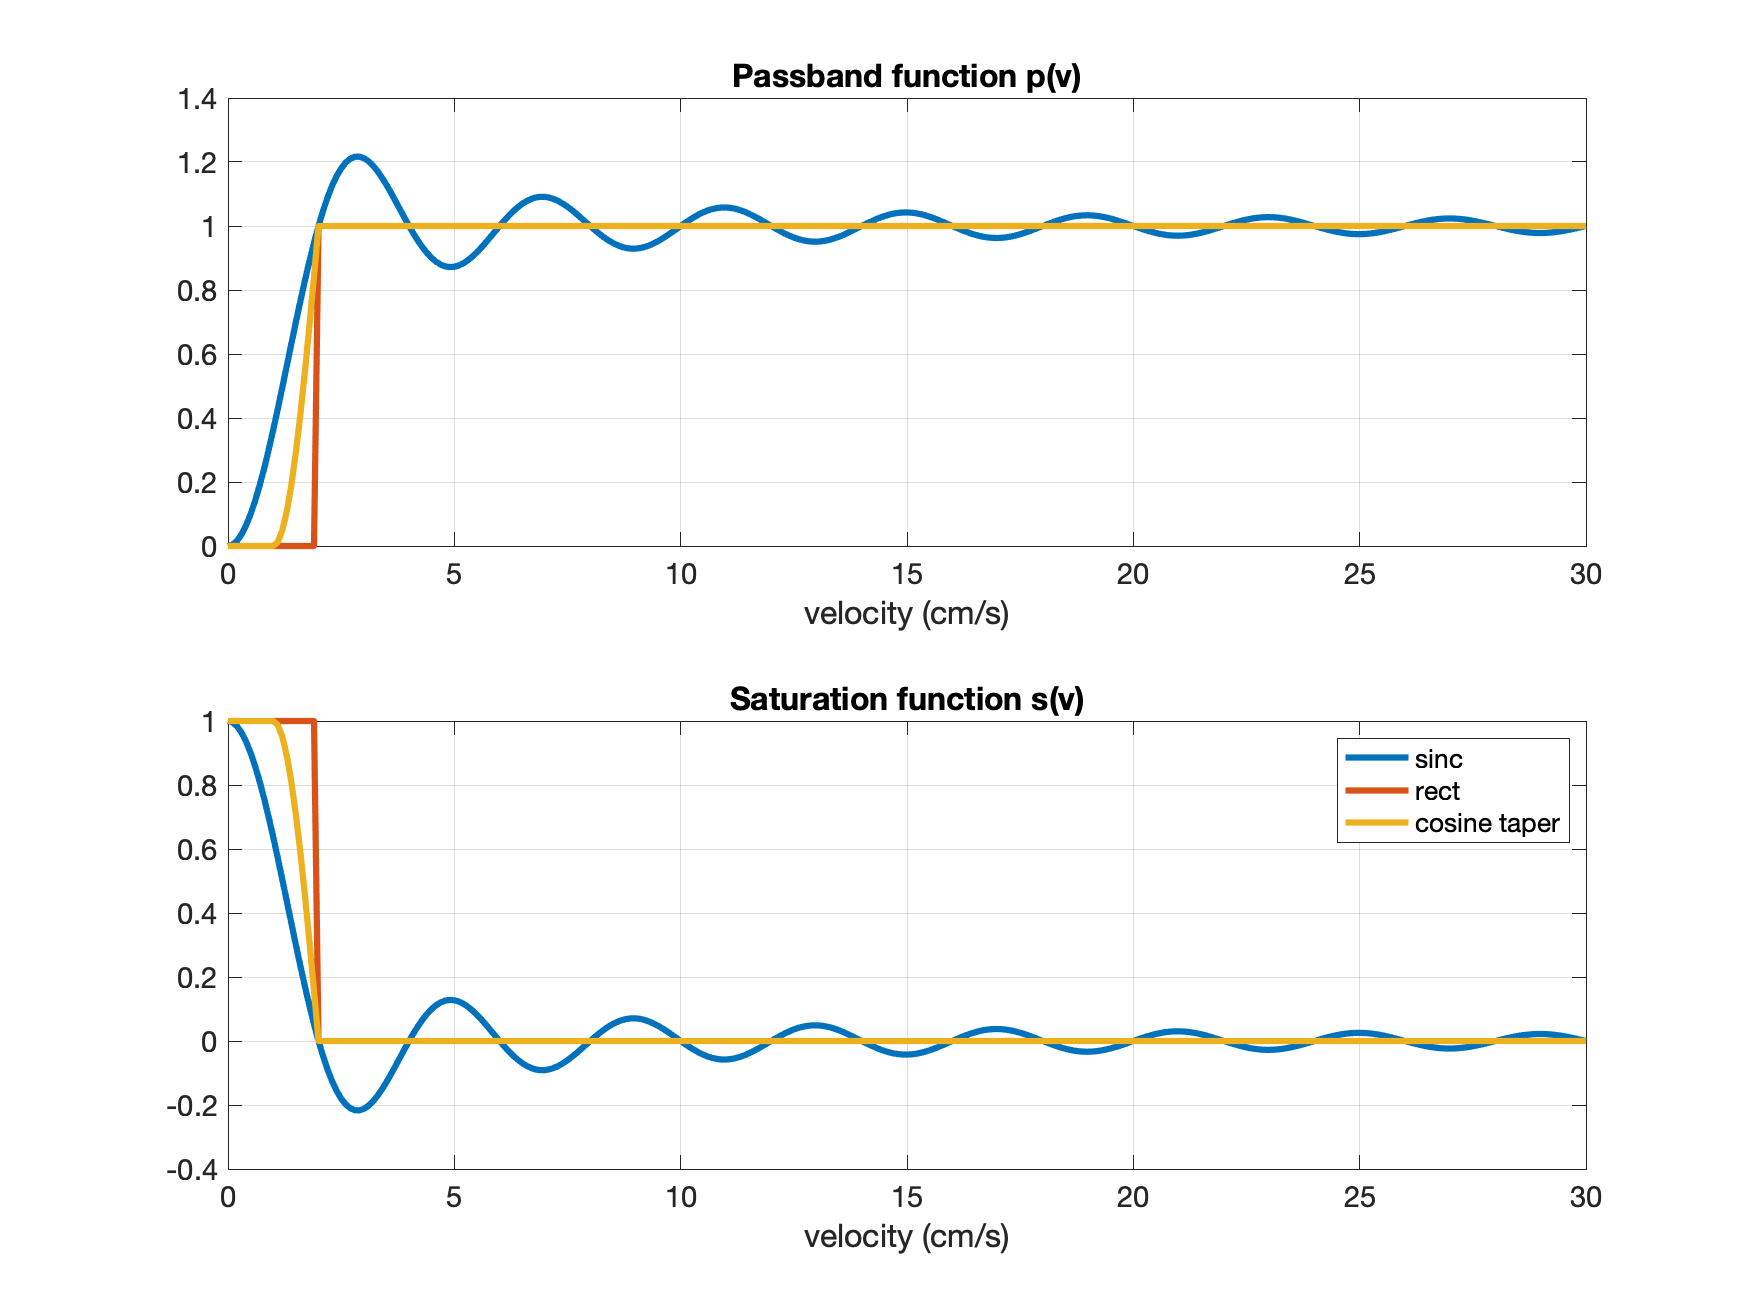
We model the VSASL labeling at $$$t=0$$$ with a unitless passband function $$$p(v)$$$ that represents the difference in magnetization between the control and tag conditions as a function of velocity. At $$$t=\tau$$$, a vascular crushing module (VCM) is applied and modeled with a unitless saturation function $$$s(v)$$$. Examples are shown in Figure 1.We first define $$$v_d$$$ as a threshold velocity such that labeled arterial magnetization that decelerates to $$$v \leq v_d$$$ is considered to be delivered. With this definition we may write the labeling and delivery function as $$$q_M(t)=e^{-t/T_{1b}}q(t)$$$ where $$q(t)=Q_0\cdot q_a(t)+V_0\cdot\delta(t) + \Delta V\cdot\delta(t-\tau)$$ with arterial delivery function $$q_a(t) = \begin{cases}p(v_d+v_a(t))&0\leq t <\tau\\ s(v_d+v_a(t-\tau)) \cdot p(v_d+v_a(t))&t\geq\tau\end{cases}$$ where labeling occurs at $$$t=0$$$, $$$Q_0$$$ represents the overall flow in units of ml/s, $$$T_{1b}$$$ denotes blood $$$T_1$$$, $$$\delta(t)$$$ denotes the Dirac delta function, and $$$V_0$$$ and $$$\Delta V$$$ represent CBV components that are injected at $$$t=0$$$ and $$$t=\tau$$$. The term $$$v_d+v_a(t)$$$ represents the velocity (at labeling time $$$t=0$$$) of arterial blood that crosses the $$$v_d$$$ threshold at a later time $$$t$$$. Since this blood has decelerated from further up the arterial tree, $$$v_a(t)$$$ can be derived (using time reversal arguments) from deceleration as a function of velocity.
The term $$$V_0$$$ reflects CBV components that are labeled at $$$t=0$$$ and includes arterial blood volume at velocities below the threshold velocity $$$v_d$$$ (i.e. $$$v_{cap}<v<v_d$$$), capillary blood volume, and venous blood volume. It is modeled as
$$V_0=Q_0\cdot \left(\int_{v_d}^{v_{cap}+\epsilon}\frac{p(v)}{a_a(v)}dv+t_{cap}\cdot p(v_{cap})+\int_{v_{cap}+\epsilon}^{v_{v,max}}\frac{p(v)}{a_v(v)}dv\right)$$ where $$$a_a (v)$$$ and $$$a_v(v)$$$ are the arterial and venous acceleration functions, respectively, $$$t_{cap}$$$ is the mean capillary transit time, $$$v_{cap}$$$ is the mean capillary velocity, and $$$v_{v,max}$$$ is the maximum venous velocity. As mean acceleration of blood in the capillary bed is assumed to be zero, the integral limits are set to end or begin just above the mean capillary velocity at $$$v_{cap}+\epsilon$$$ (with $$$\epsilon > 0$$$), so that division by the acceleration functions is well-defined.
The term $$$\Delta V=V_\tau-V_0$$$ represents the reduction in the CBV component due to the VCM, where the CBV component at $$$t=\tau$$$ is $$V_\tau=Q_0\cdot \left(D_{art}+D_{cap}+\int_{v_{cap}+\epsilon}^{v_{v,max}}\frac{p(v)}{a_v(v)}s\left(F(v,\tau)\right) dv \right)$$ where $$$F(v,\tau)$$$ represents the velocity at $$$t=\tau$$$ of venous magnetization with an initial velocity of $$$v$$$ and can be derived from $$$a_v(v)$$$. The arterial volume-related term is modeled as:
$$D_{art}=\begin{cases}s(v_{cap})\cdot\int_{v_d}^{v_{cap}+\epsilon}\frac{p(v)}{a_a(v)}dv&t_{dc}\leq \tau\\ \left(s(v_{cap})\cdot\int_{v_{thr}}^{v_{cap}+\epsilon}\frac{p(v)}{a_a(v)}dv+\int_{v_d}^{v_{thr}} \frac{p(v)}{a_a(v)}s\left( G(v,\tau)\right)dv \right)&\tau<t_{dc}\end{cases}$$ where $$$t_{dc}$$$ is the time for an arterial spin to move from $$$v_d$$$ to $$$v_{cap}$$$, $$$v_{thr}$$$ is the maximum velocity (when $$$\tau<t_{dc}$$$) below $$$v_d$$$ that reaches $$$v_{cap}$$$ at $$$t=\tau$$$, and $$$G(v,\tau)$$$ is the velocity at $$$t=\tau$$$ of arterial magnetization with an initial velocity of $$$v$$$ and can be derived from $$$a_a(v)$$$.
The capillary volume-related term is modeled as:
$$D_{cap}=p(v_{cap})\left(s(v_{cap})\left( (1-f_c)\cdot t_{cap}+f_c\cdot H(t_{cap}-\tau)\cdot (t_{cap}-\tau)\right)+f_c\int_{v_L}^{v_H}\frac{s(v)}{a_v(v)}dv\right) $$ where $$$f_c$$$ is the fraction of capillary spins that have exited the capillary bed, $$$H$$$ denotes the Heaviside step function and $$$v_L$$$ and $$$v_H$$$ span the predicted range of velocities at $$$t =\tau$$$ of capillary magnetization that has entered the venous tree in the interval $$$0<t<\tau$$$. Assumptions regarding capillary water exchange are roughly captured by varying the parameter $$$f_c$$$, such that $$$f_c=0.0$$$ corresponds to all capillary blood labeled at $$$t=0$$$ remaining in the capillaries or tissue, and $$$f_c=1.0$$$ corresponding to no exchange with tissue.
Methods
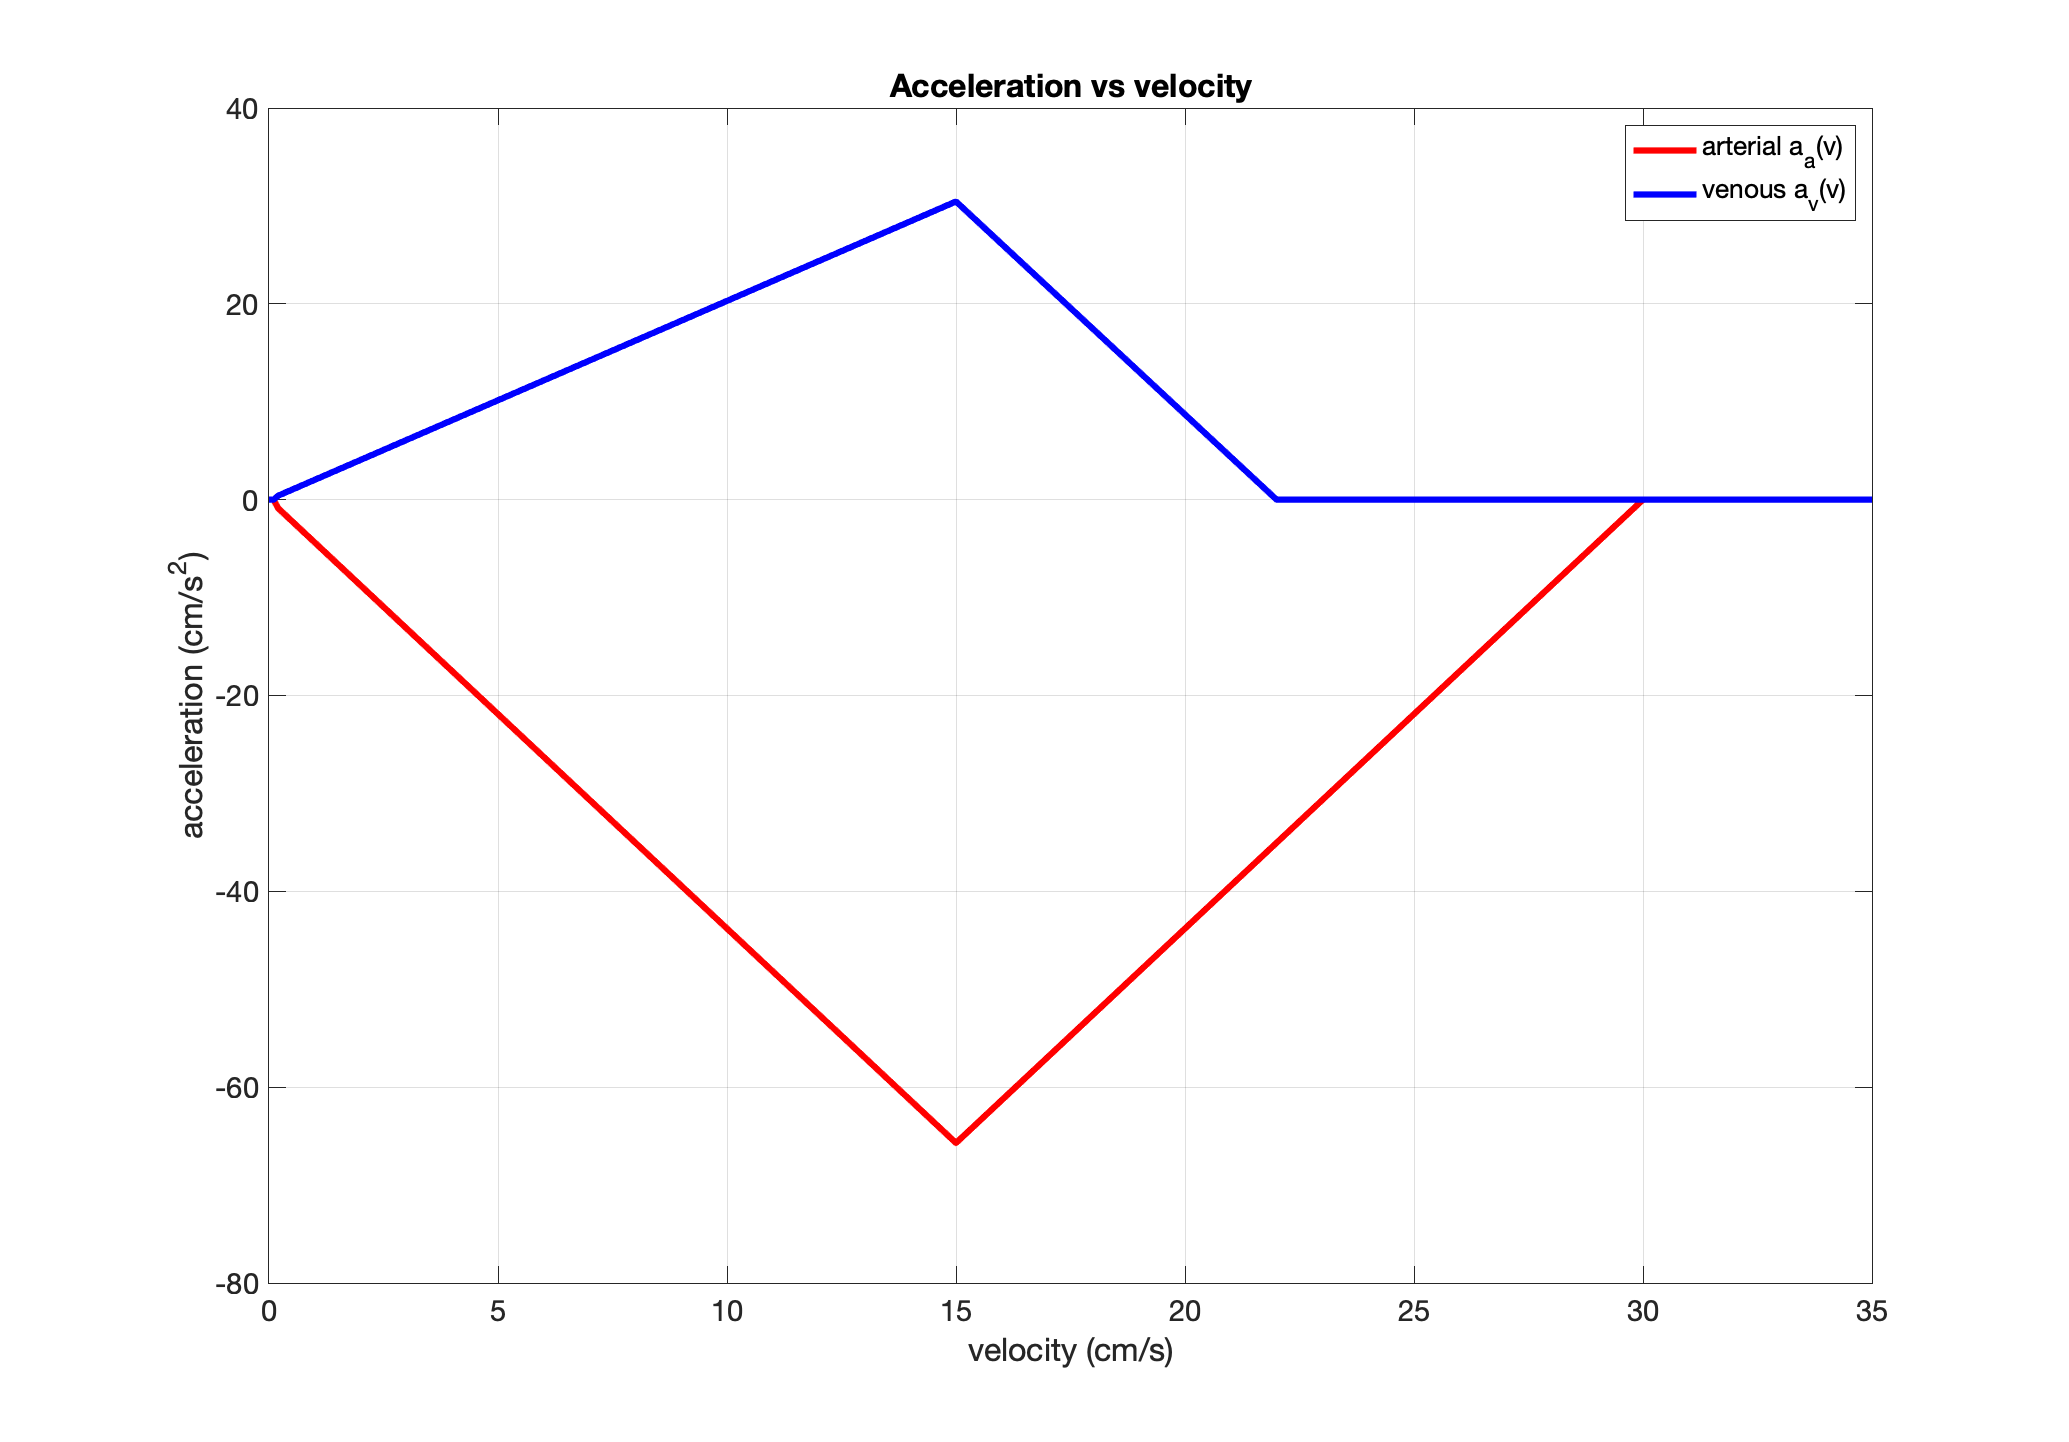
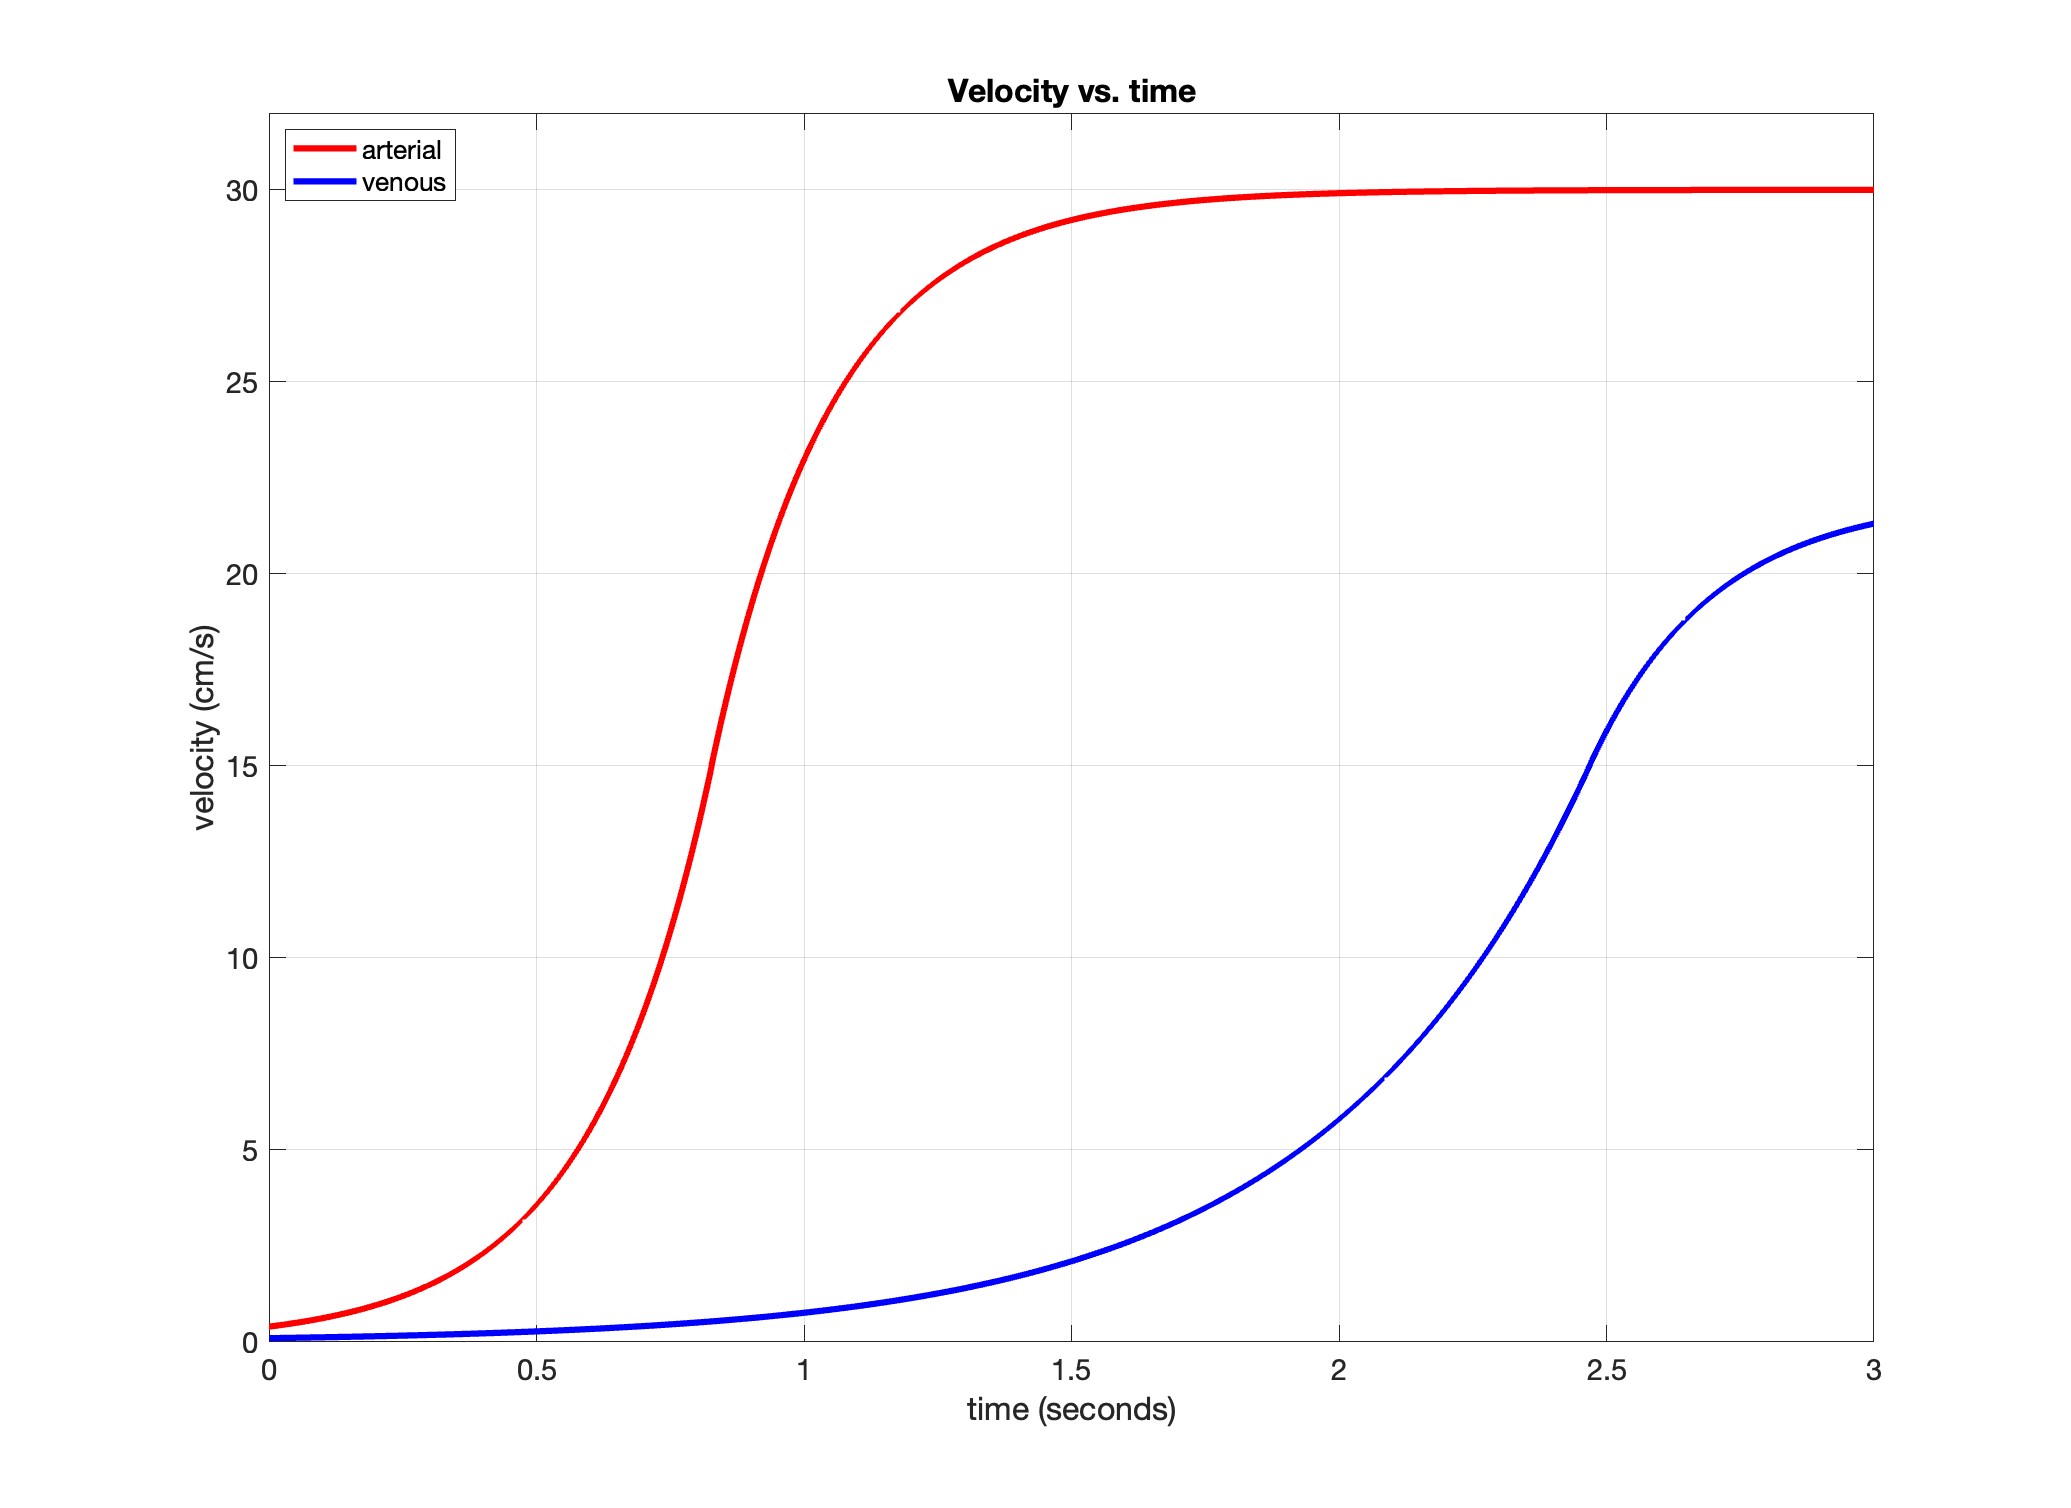
As an initial demonstration, we considered saturation-based VSASL examples with the $$$s(v)$$$ and $$$p(v)$$$ functions from Figure 1 and $$$\tau=1.4s$$$, $$$Q_0=12.5$$$ ml/s, $$$v_d=0.4$$$ cm/s, $$$v_{cap}=\epsilon=0.1$$$ cm/s, and $$$f_c=0.2$$$. We adapted a previously described vascular model3 to define $$$a_a(v)$$$ and $$$a_v(v)$$$. As shown in Figure 2, these models transition from a Murray's law4 region in which both flow and acceleration are proportional to velocity to a Da Vinci's law region where the velocity is constant and there is zero acceleration. Velocity as function of time derived using these models is shown in Figure 3.Results
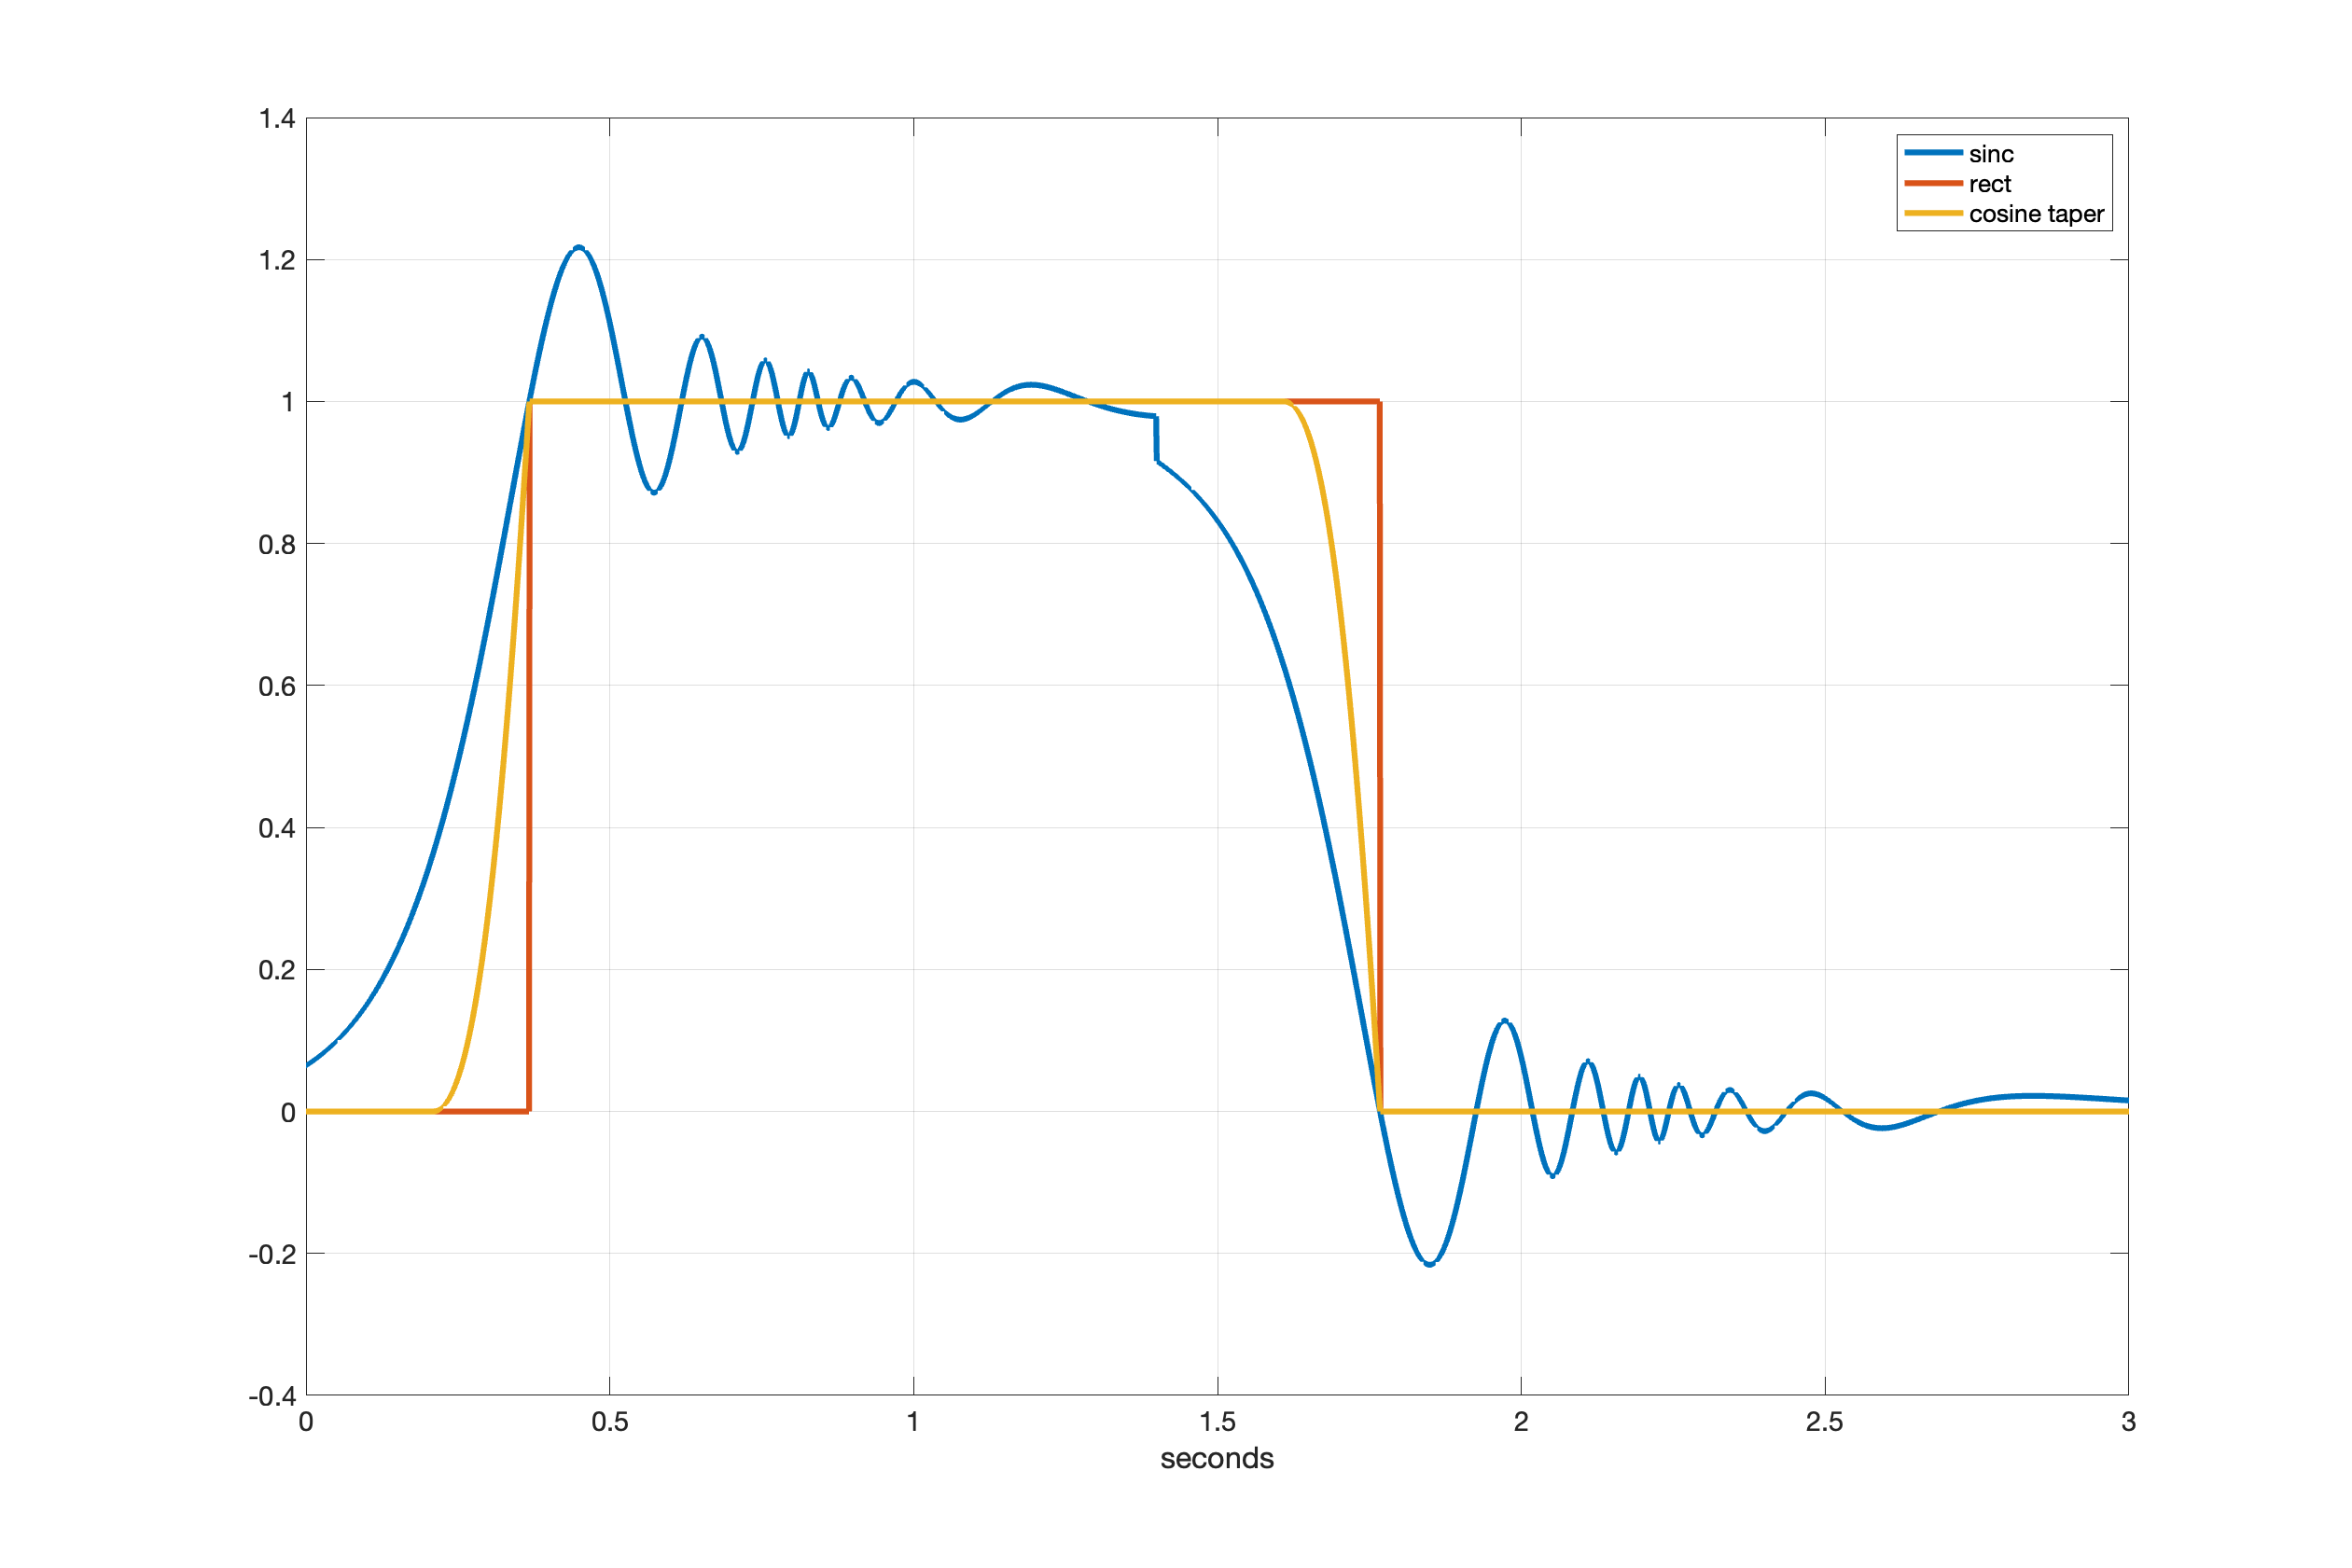
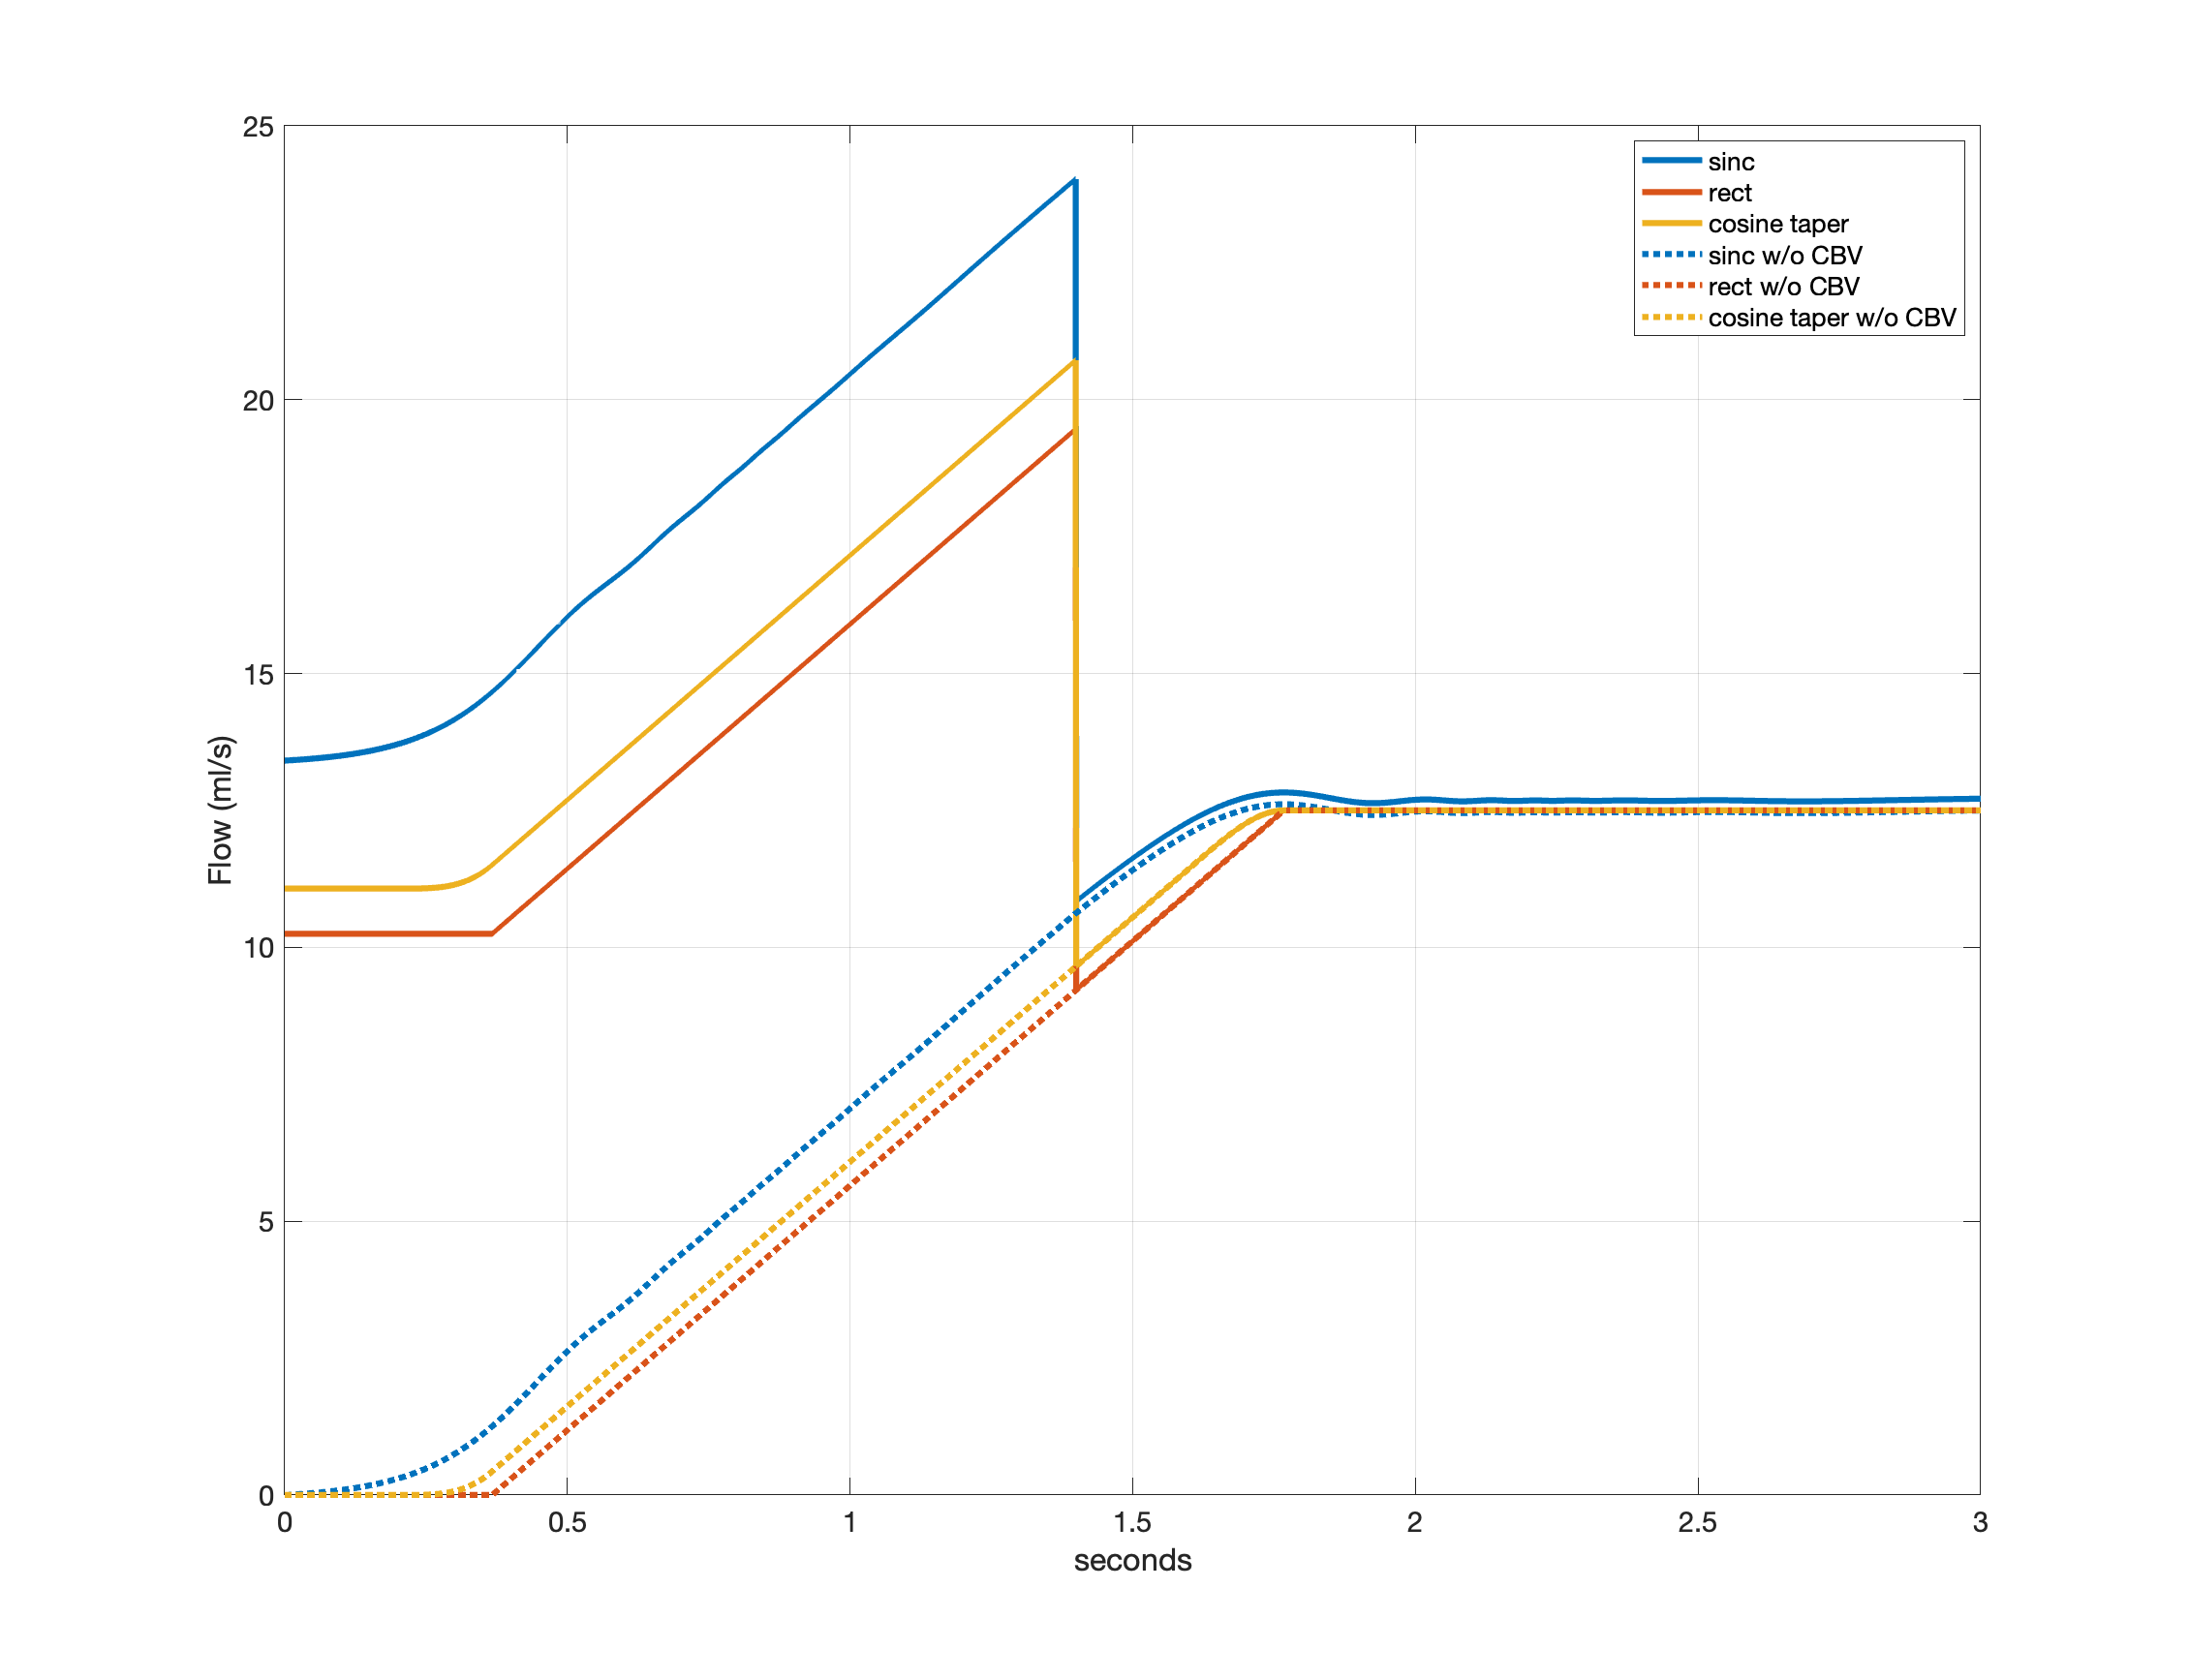
Figure 4 shows the arterial delivery function $$$q_a(t)$$$ for the sinc, rect, and cosine tapered saturation functions. Figure 5 shows the time varying integral $$$Q(t)=\frac{1}{\tau} \int_{0}^{t}q(s)ds$$$, which provides an estimate of CBF as a function of time $$$t$$$. For the rect and cosine-tapered profiles, the VCM at $$$t=\tau$$$ eliminates the CBV component $$$V_0$$$ such that $$$Q(\tau+\delta t)=Q_0$$$, where $$$\delta t$$$ is the transit time for arterial blood to flow from $$$v_{cut}$$$ to $$$v_d$$$. For the sinc profile, $$$Q(\tau+\delta t)=Q_0+\delta Q$$$ with $$$\delta Q$$$ reflecting residual labeling and CBV terms. For the parameters assumed here, the term $$$V_0$$$ is dominated by venous blood labeled at $$$t=0$$$.Conclusion
We have presented a general mathematical model for VSASL that generates the arterial delivery function and CBV terms for arbitrary labeling and vascular crushing functions and can readily incorporate different vascular model assumptions. Spatial variations in the vasculature are not considered here but will be addressed in an extended version of this model.Acknowledgements
No acknowledgement found.References
1. Wong EC et al, Velocity-Selective Arterial Spin Labeling, Magn. Reson. Med. 55:1334–1341, 2006.
2. Qin Q et al, Velocity-selective arterial spin labeling perfusion MRI: A review of the state of the art and recommendations for clinical implementation, Magn. Reson. Med. 88:1528-1547, 2022.
3. Piechnik SK et al, Modelling vascular reactivity to investigate the basis of the relationship between cerebral blood volume and flow under CO2 manipulation. NeuroImage 39: 107–118, 2008.
4. Murray CD, The physiological principle of minimum work. I. The vascular system and the cost of blood volume. Proc. Natl. Acad. Sci., 12:207-214, 1926.
5. Seymour RS et al, Blood flow rate and wall shear stress in seven major cephalic arteries of humans, J. Anatomy, 236:522-530, 2020.
Figures