2753
Theoretical and experimental evaluation of the test and retest reliability of single- and multi-delay 3D pCASL
Xingfeng Shao1, Zixuan Liu1, Qinyang Shou1, Kay Jann1, and Danny JJ Wang1
1Laboratory of FMRI Technology (LOFT), Mark & Mary Stevens Neuroimaging and Informatics Institute, Keck School of Medicine, University of Southern California, Los Angeles, CA, United States
1Laboratory of FMRI Technology (LOFT), Mark & Mary Stevens Neuroimaging and Informatics Institute, Keck School of Medicine, University of Southern California, Los Angeles, CA, United States
Synopsis
Keywords: Arterial spin labelling, Perfusion, test and retest reliability, multi-delay ASL
The goal of this study is to evaluate the quantification accuracy and measurement reliability of single- and multi-PLD pCASL via both simulation and in-vivo test and retest data. CBF calculated by single-delay ASL achieved highest test and retest reliability as compared to 5-PLD ASL. However, CBF values may be under-estimated due to prolonged ATT. 5-PLD ASL can be used to quantify ATT and CBF simultaneously with slightly reduced test and retest reliability. Model-fitting approach is more preferrable than the weighted-delay approach in terms of both quantification error and reliability.Background
An optimal post-labeling delay (PLD) needs to be carefully selected for single-delay arterial spin labeling (ASL) acquisitions to avoid cerebral blood flow (CBF) quantification errors in regions with prolonged arterial transit time (ATT), especially under neurophysiological conditions. Acquiring ASL signals at multiple PLDs allows simultaneous quantification of ATT and CBF with improved accuracy. The goal of this study is to directly evaluate the performance of single-/multi-PLD pCASL via simulation and in-vivo test/retest data.Method
Monte Carlo simulations were performed in MATLAB to evaluate the reliability at different noise levels. Perfusion signals ΔM were simulated according to Eq.[1] (1,2) assuming ATT=1.3/1.1s, CBF=35/50 ml/100g/min for WM/GM:$$CBF=\frac{\lambda \cdot \Delta M \cdot R_{1a}}{2 \cdot \alpha \cdot M_0 \cdot [exp((min(ATT-PLD,0)-ATT) \cdot R_{1a} )-exp(-(\tau+PLD) \cdot R_{1a})]}$$
Where λ is blood-brain partition coefficient = 0.9 g/ml, α is labeling efficiency=0.9, R1a is relaxation time of blood=0.6s-1, τ is labeling duration=1.8s. PLD=2s was used for single-delay protocol, and multi-delay protocol used 5 PLDs = [0.5,1,1.5,2,2.5] s. For each simulation, gaussian random noise with stand deviation=ΔM/tSNR was added, where tSNR describes the noise level in perfusion signals. This process was repeated 12 times, and CBFmc,1PLD was calculated from the averaged signal. For 5-PLD data, simulations were repeated [2,2,2,3,3] times for each PLD. ATTmc,5PLD and CBFmc,5PLD were simultaneously obtained using a weighted-delay method (2) or a least-square model fitting approach (3). We define the SNR of the reconstruction metrics as the mean divided by the standard deviation of CBFmc,1PLD, CBFmc,5PLD or ATTmc,5PLD obtained from 5000 Monte Carlo simulations.
21 subjects (12/9 females/males, age=42±21years) underwent MRI scans on a Siemens 3T Prisma scanner with a 32-ch head coil. Test/retest scans were acquired with an average interval of 7.9±2.8 days. Imaging parameters for 3D GRASE pCASL were: FOV=240×240mm2, resolution=2.5×2.5×3mm3, 40 slices (20%os), 4 segments, TE=37.8ms, TR=4.5s, labeling duration=1.8s. PLD=2s was used for single-delay with 9 repetitions acquired in 5min24s. Multi-delay protocol used PLDs = [0.5,1,1.5,2,2.5]s and [2,2,2,3,3] repetitions were acquired for each PLD with a total acquisition time = 7min12s. A separate M0 was acquired in 18s. Single-delay CBF maps were calculated according to Eq. [1] assuming PLD>ATT. Multi-delay ATT and CBF maps were calculated using a weighted-delay method (2) and a model-fitting approach (3), respectively. Test and retest reliability was quantified by intra-class correlation coefficient (ICC).
Results and discussion
Fig.1 shows the plots of simulated CBF and ATT values versus perfusion tSNR. Single-delay CBF values closely matched the reference value in both GM and WM. However, single-delay CBF could be under-estimated by ~10-20% if ATT is 100-200ms longer than PLD. Both 5-PLD weighted-delay and model fitting approaches slightly over-estimated CBF. The model fitting approach slightly overestimated ATT (~1% when tSNR>1.5), while the weighted delay approach can either over- or under-estimate ATT (<5%) with low to moderate input tSNR.Fig.2 shows the plots of CBF/ATT SNR versus tSNR of perfusion signals. Single-PLD CBF had an overall better performance than 5-PLD CBF values except when tSNR<0.5. And SNR of ATT and CBF calculated by the model fitting approach were overall higher than the weighted-delay method.
tSNR of in-vivo perfusion signals acquired at PLD=2000 ms were 1.7±0.4, 2.0±0.5 and 1.4±0.3 in whole brain, GM and WM. 5-PLD model fitting method provided ~20-40% SNR gain as compared to the weighted-delay approach with <5% estimation bias (Fig.1&2 arrows).
Fig.3 shows 8 representative slices of CBF (A) and ATT (B) maps. CBF maps were comparable upon visual inspection. 5-PLD weighted-delay ATT values were slightly lower in a few WM regions as compared to model fitting (white arrows), which is consistent with simulation.
Fig.4 shows the histogram of ATT values calculated by model-fitting (A) and weighted-delay (B) methods across 21 subjects. 10.2%/14.8% voxels in GM/WM had ATT>2.0s according to the model-fitting results. Fewer voxels (7.1%/9.9% in GM/WM) were estimated to have ATT>2.0s by the weighted-delay method. These results suggest that CBF values maybe underestimated in ~10% voxels when a single PLD of 2.0s was used.
CBF calculated by single-delay, 5-PLD model-fitting and weighted-delay method were 38.7±7.1, 42.7±8.0, 43.8±7.3 ml/100g/min in whole brain, 41.5±8.7, 45.2±9.4, 45.7±8.5 ml/100g/min in GM and 31.3±5.5, 34.7±6.3, 36.1±5.6 ml/100g/min WM across subjects. Single-delay CBF values were ~10% lower than 5-PLD CBF values. ATT calculated by 5-PLD model-fitting and weighted-delay method were 1222.0±204.9 and 1123.2±181.8 ms in whole brain, 1182.4±221.0, 1109.3±195.5 ms in GM and 1254.4±199.4 and 1147.0±191.1 ms in WM. ATT values were ~8% shorter when the weighted-delay approach was used.
Fig.5 shows the scatter plots of test/retest CBF (A,B) and ATT (C) across 21 subjects in GM (blue) and WM (orange). Single-delay CBF had highest ICC (0.89/0.86 in GM/WM) indicating the best test/retest reliability. However, single-PLD CBF values were systematically lower when 5-PLD CBF values. For 5-PLD data, model fitting approach improved reliability of ATT and CBF quantification, as indicated by higher ICC in both GM and WM.
Conclusion
CBF calculated by single-delay ASL achieved highest test/retest reliability as compared to 5-PLD ASL. However, CBF values may be under-estimated (~10%) due to prolonged ATT in ~10% voxels. 5-PLD ASL improved quantification accuracy but had slightly reduced test/retest reliability. Model-fitting approach is more preferrable than the weighted-delay approach in terms of both quantification error and reliability.Acknowledgements
This work was supported by National Institute of Health (NIH) grant R01-NS114382, R01-EB032169 and R01-EB028297.References
1. Buxton RB, Frank LR, Wong EC, Siewert B, Warach S, Edelman RR. A general kinetic model for quantitative perfusion imaging with arterial spin labeling. Magnetic resonance in medicine 1998;40(3):383-396.
2. Wang DJ, Alger JR, Qiao JX, Gunther M, Pope WB, Saver JL, Salamon N, Liebeskind DS, Investigators US. Multi-delay multi-parametric arterial spin-labeled perfusion MRI in acute ischemic stroke—comparison with dynamic susceptibility contrast enhanced perfusion imaging. NeuroImage: Clinical 2013;3:1-7.
3. Shao X, Wang D. Single shot high resolution 3D arterial spin labeling using 2D CAIPI and ESPIRiT reconstruction. 2017. p 3629.
Figures
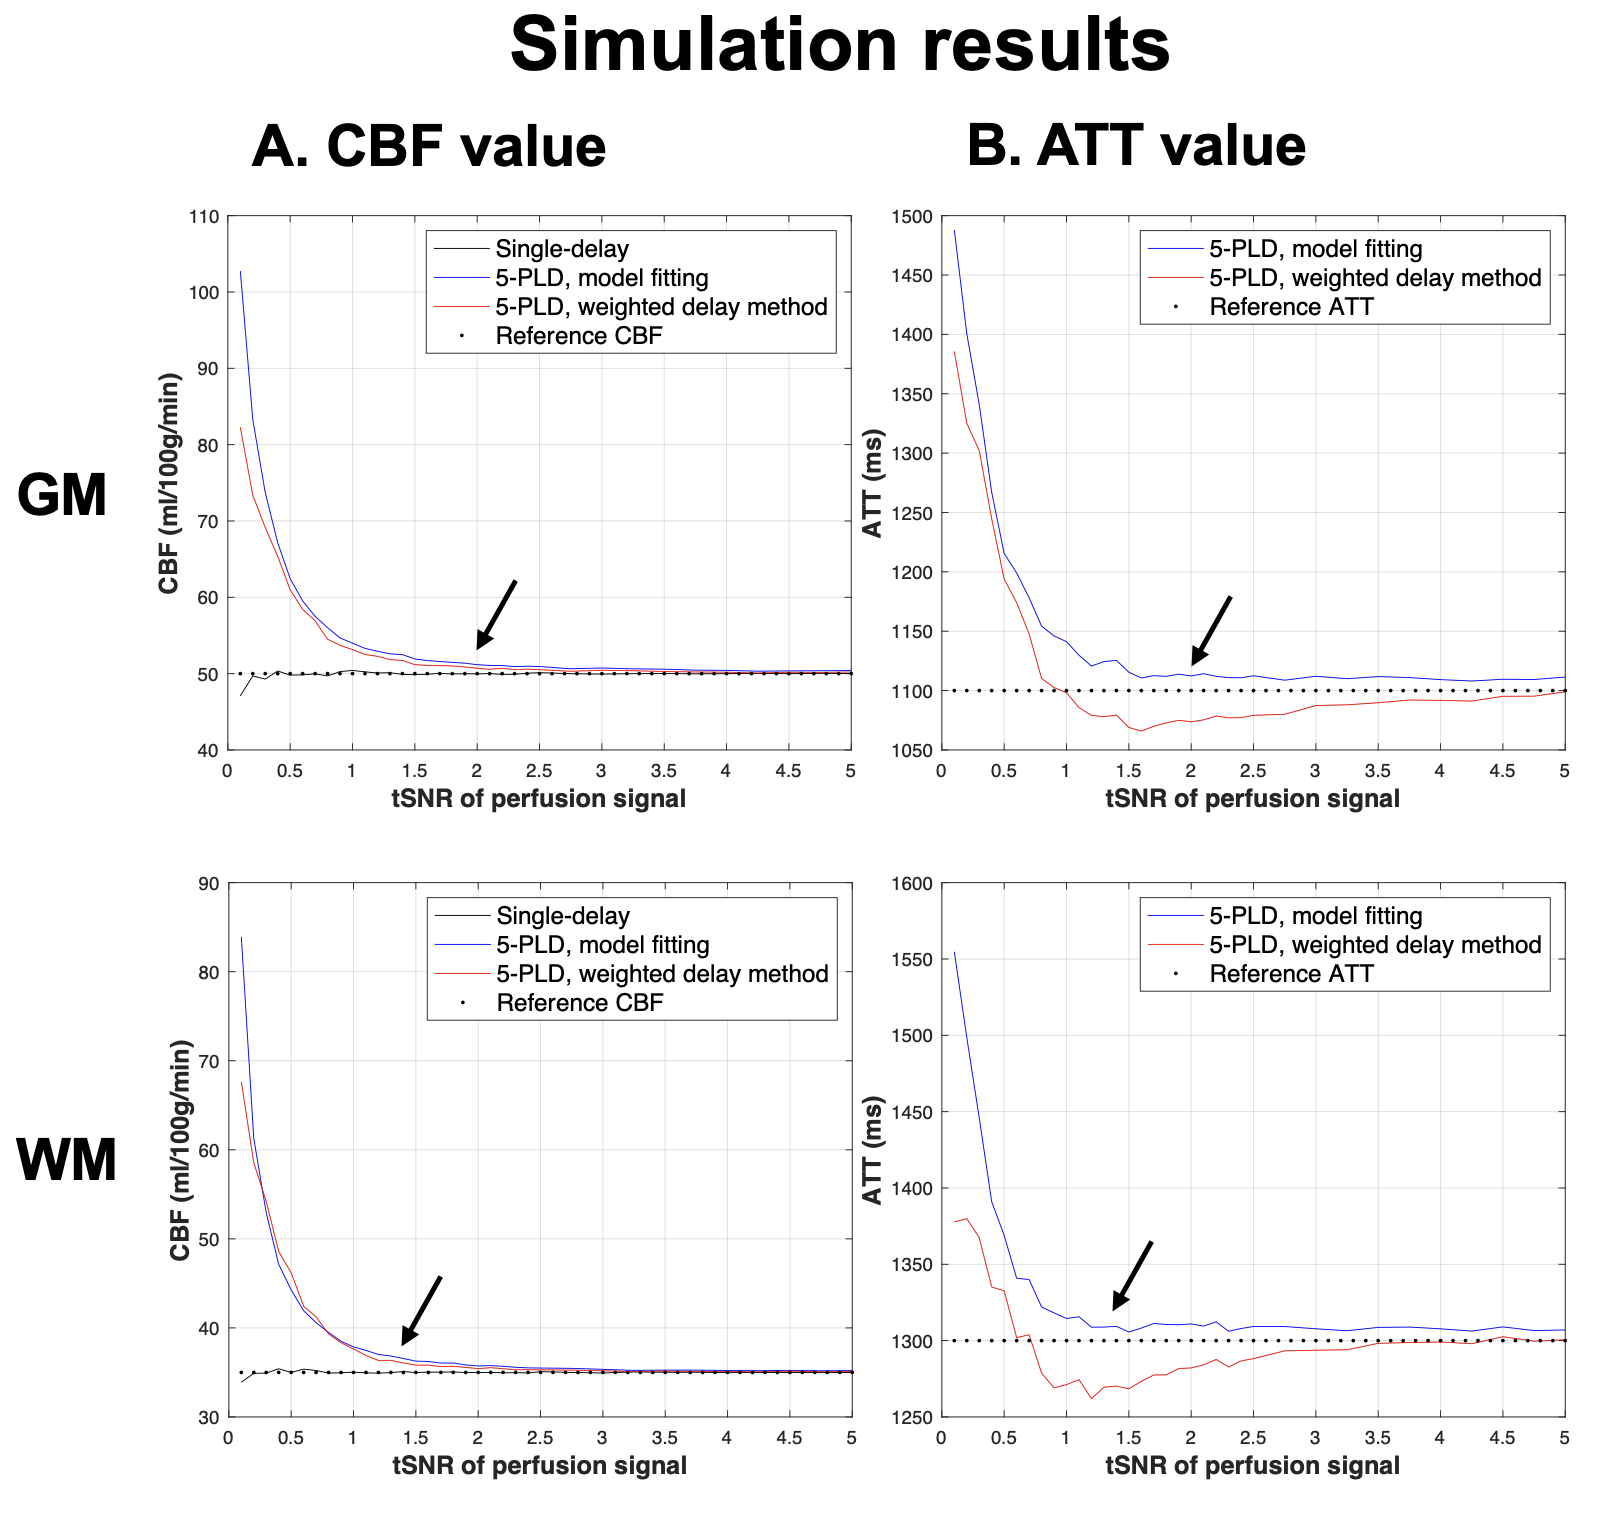
Figure 1. Plots of average CBF (A) and ATT (B) values obtained from 5000 Monte-Carlo simulations versus input perfusion tSNR in GM (top) and WM (bottom). Reference CBF and ATT were 50 ml/100g/min and 1100 ms in GM and 35 ml/100g/min and 1300 ms in WM, respectively (dashed lines). Simulations results of single-delay ASL, 5-PLD model fitting and 5-PLD weighted-delay were shown as black, blue, and red traces, respectively. Black arrows indicate the tSNR calculated from 21 subjects.

Figure 2. Plots of SNR of reconstructed CBF (A) and ATT (B) values obtained from 5000 Monte-Carlo simulations versus input perfusion tSNR in GM (top) and WM (bottom). SNR of single-delay ASL, 5-PLD model fitting and 5-PLD weighted-delay were shown as black, blue, and red traces, respectively. Black arrows indicate the tSNR calculated from 21 subjects.
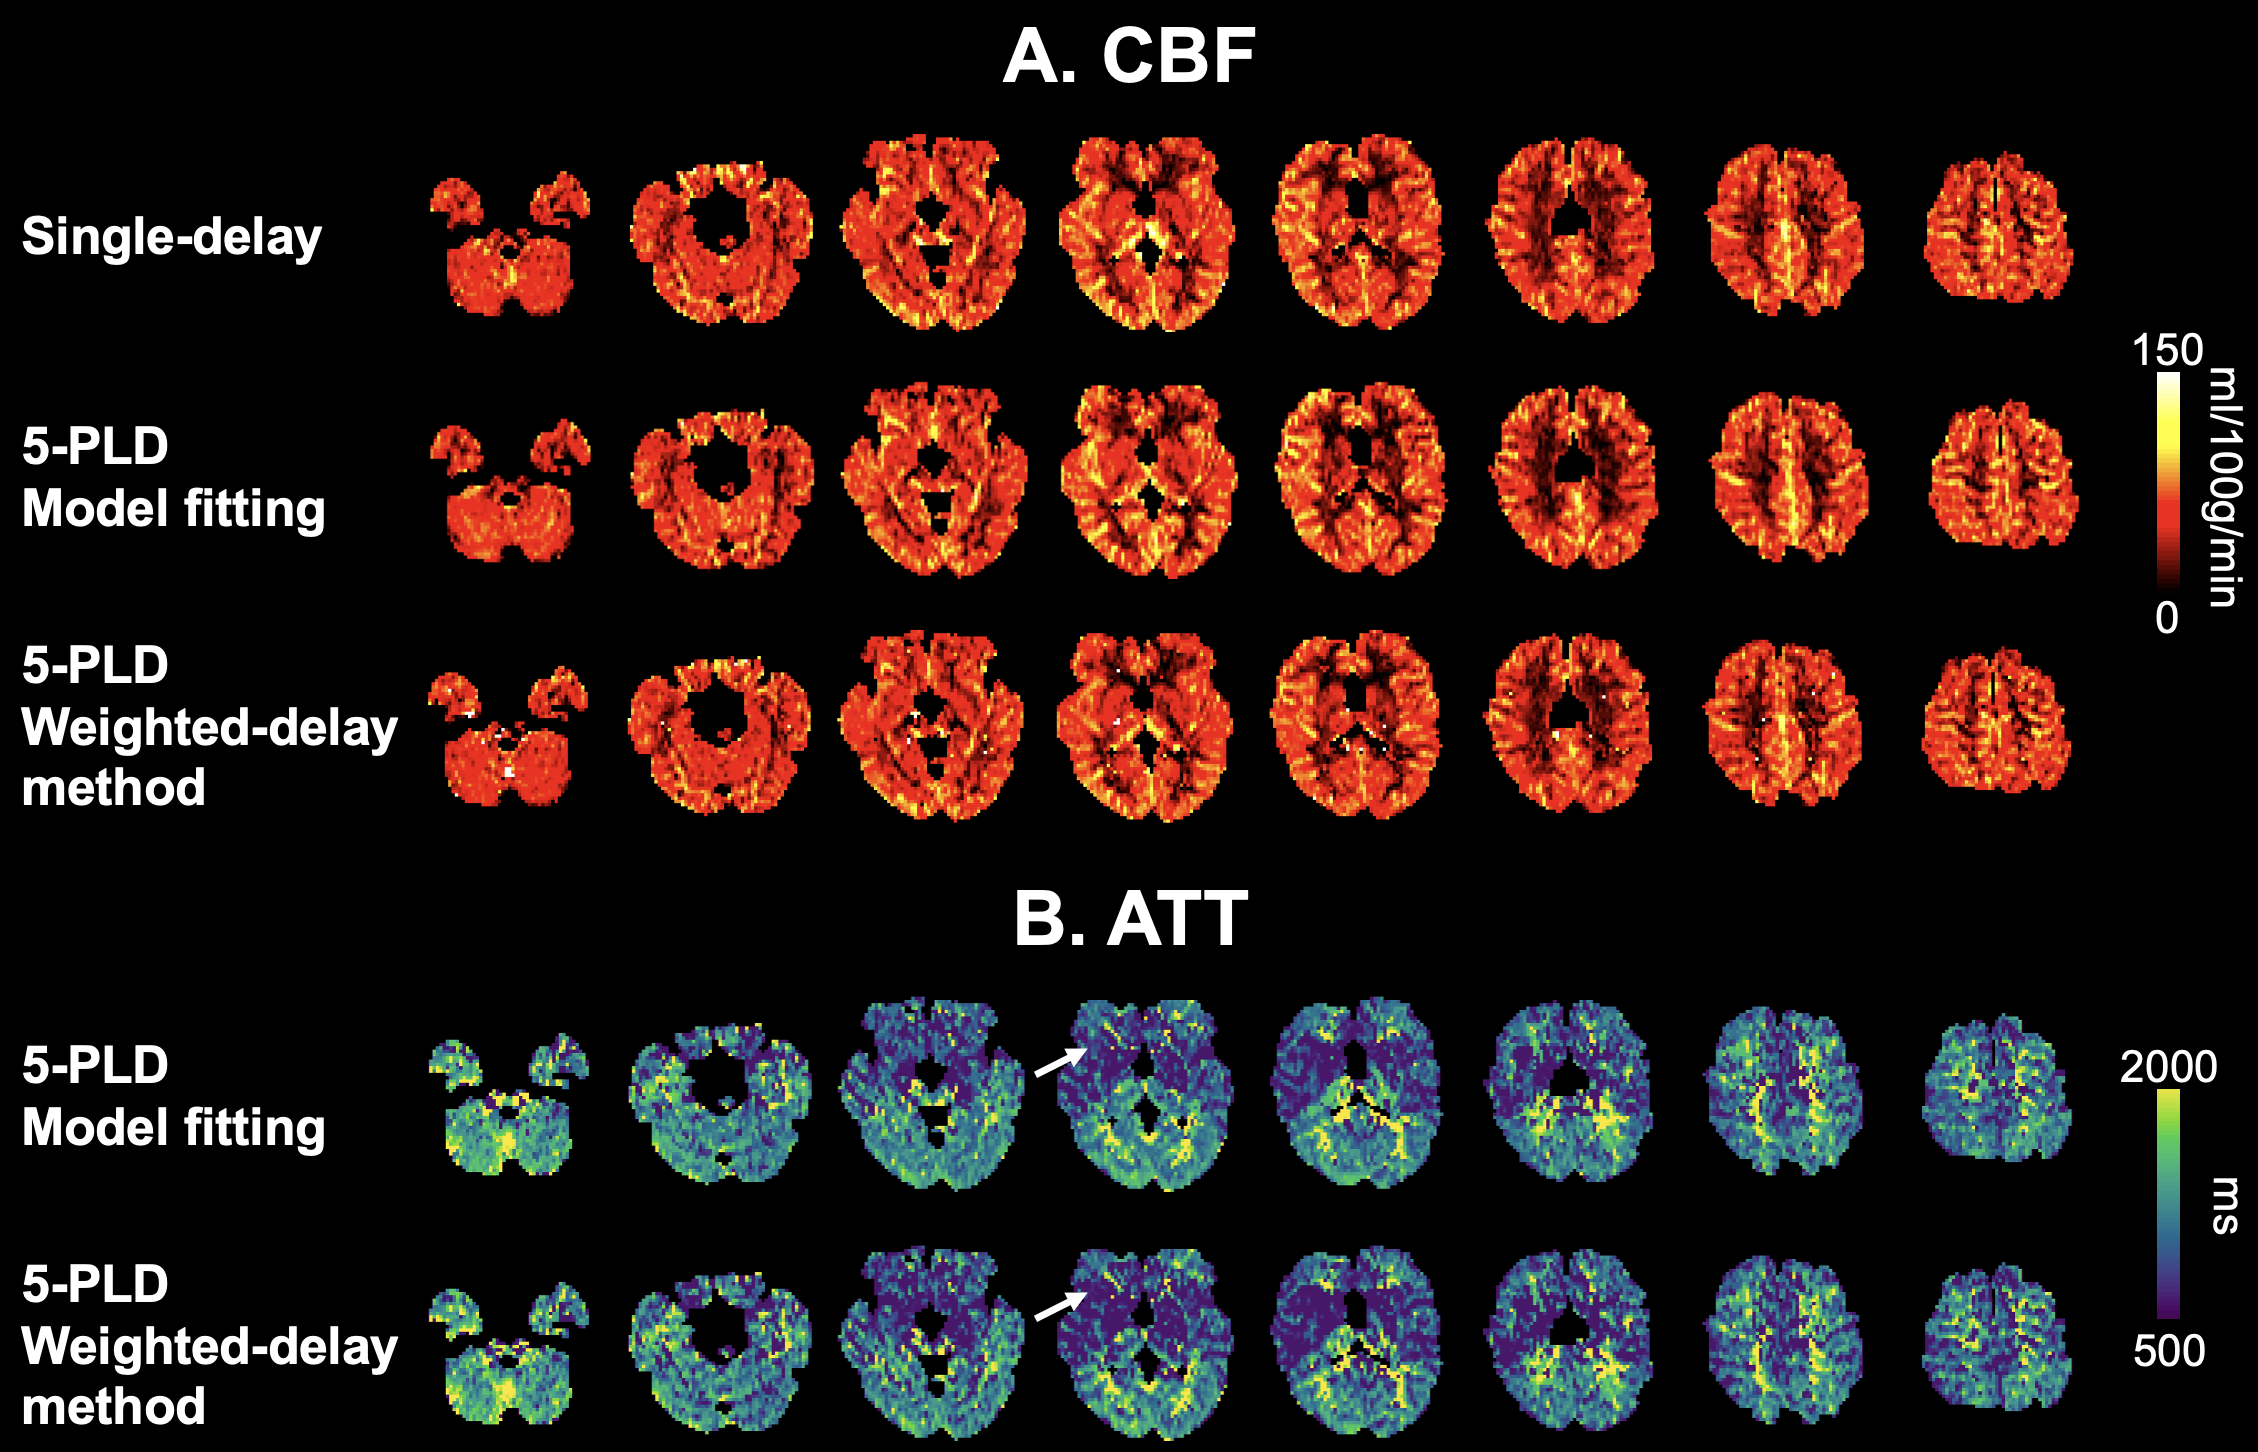
Figure 3. 8 representative slices of CBF (A) and ATT (B) maps from one subject calculated by single-delay and 5-PLD ASL. White arrows indicate WM regions where ATT was under-estimated by the weighted-delay approach.
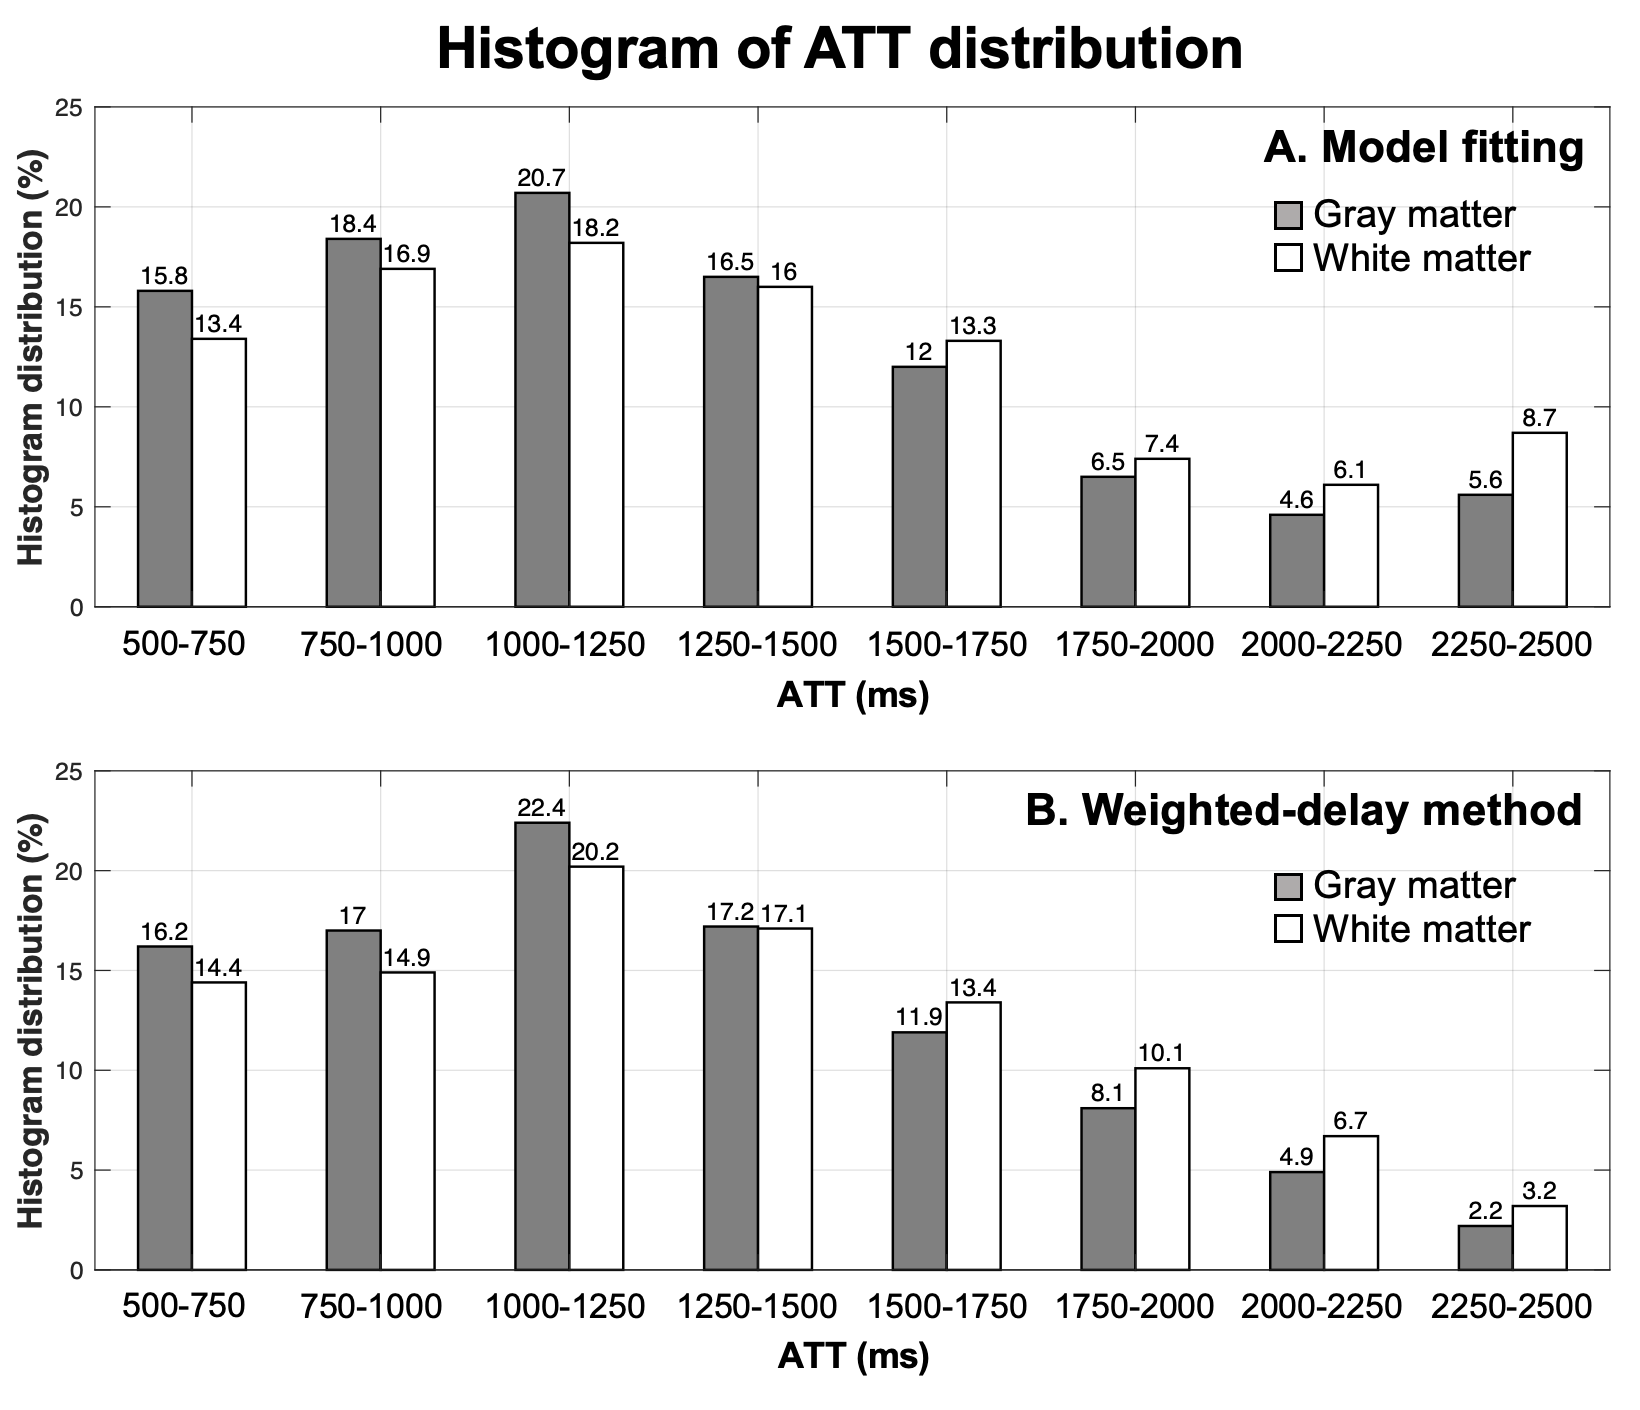
Figure 4. Histogram of ATT values calculated by 5-PLD model fitting (A) and weighted-delay method (B) across 21 subjects.
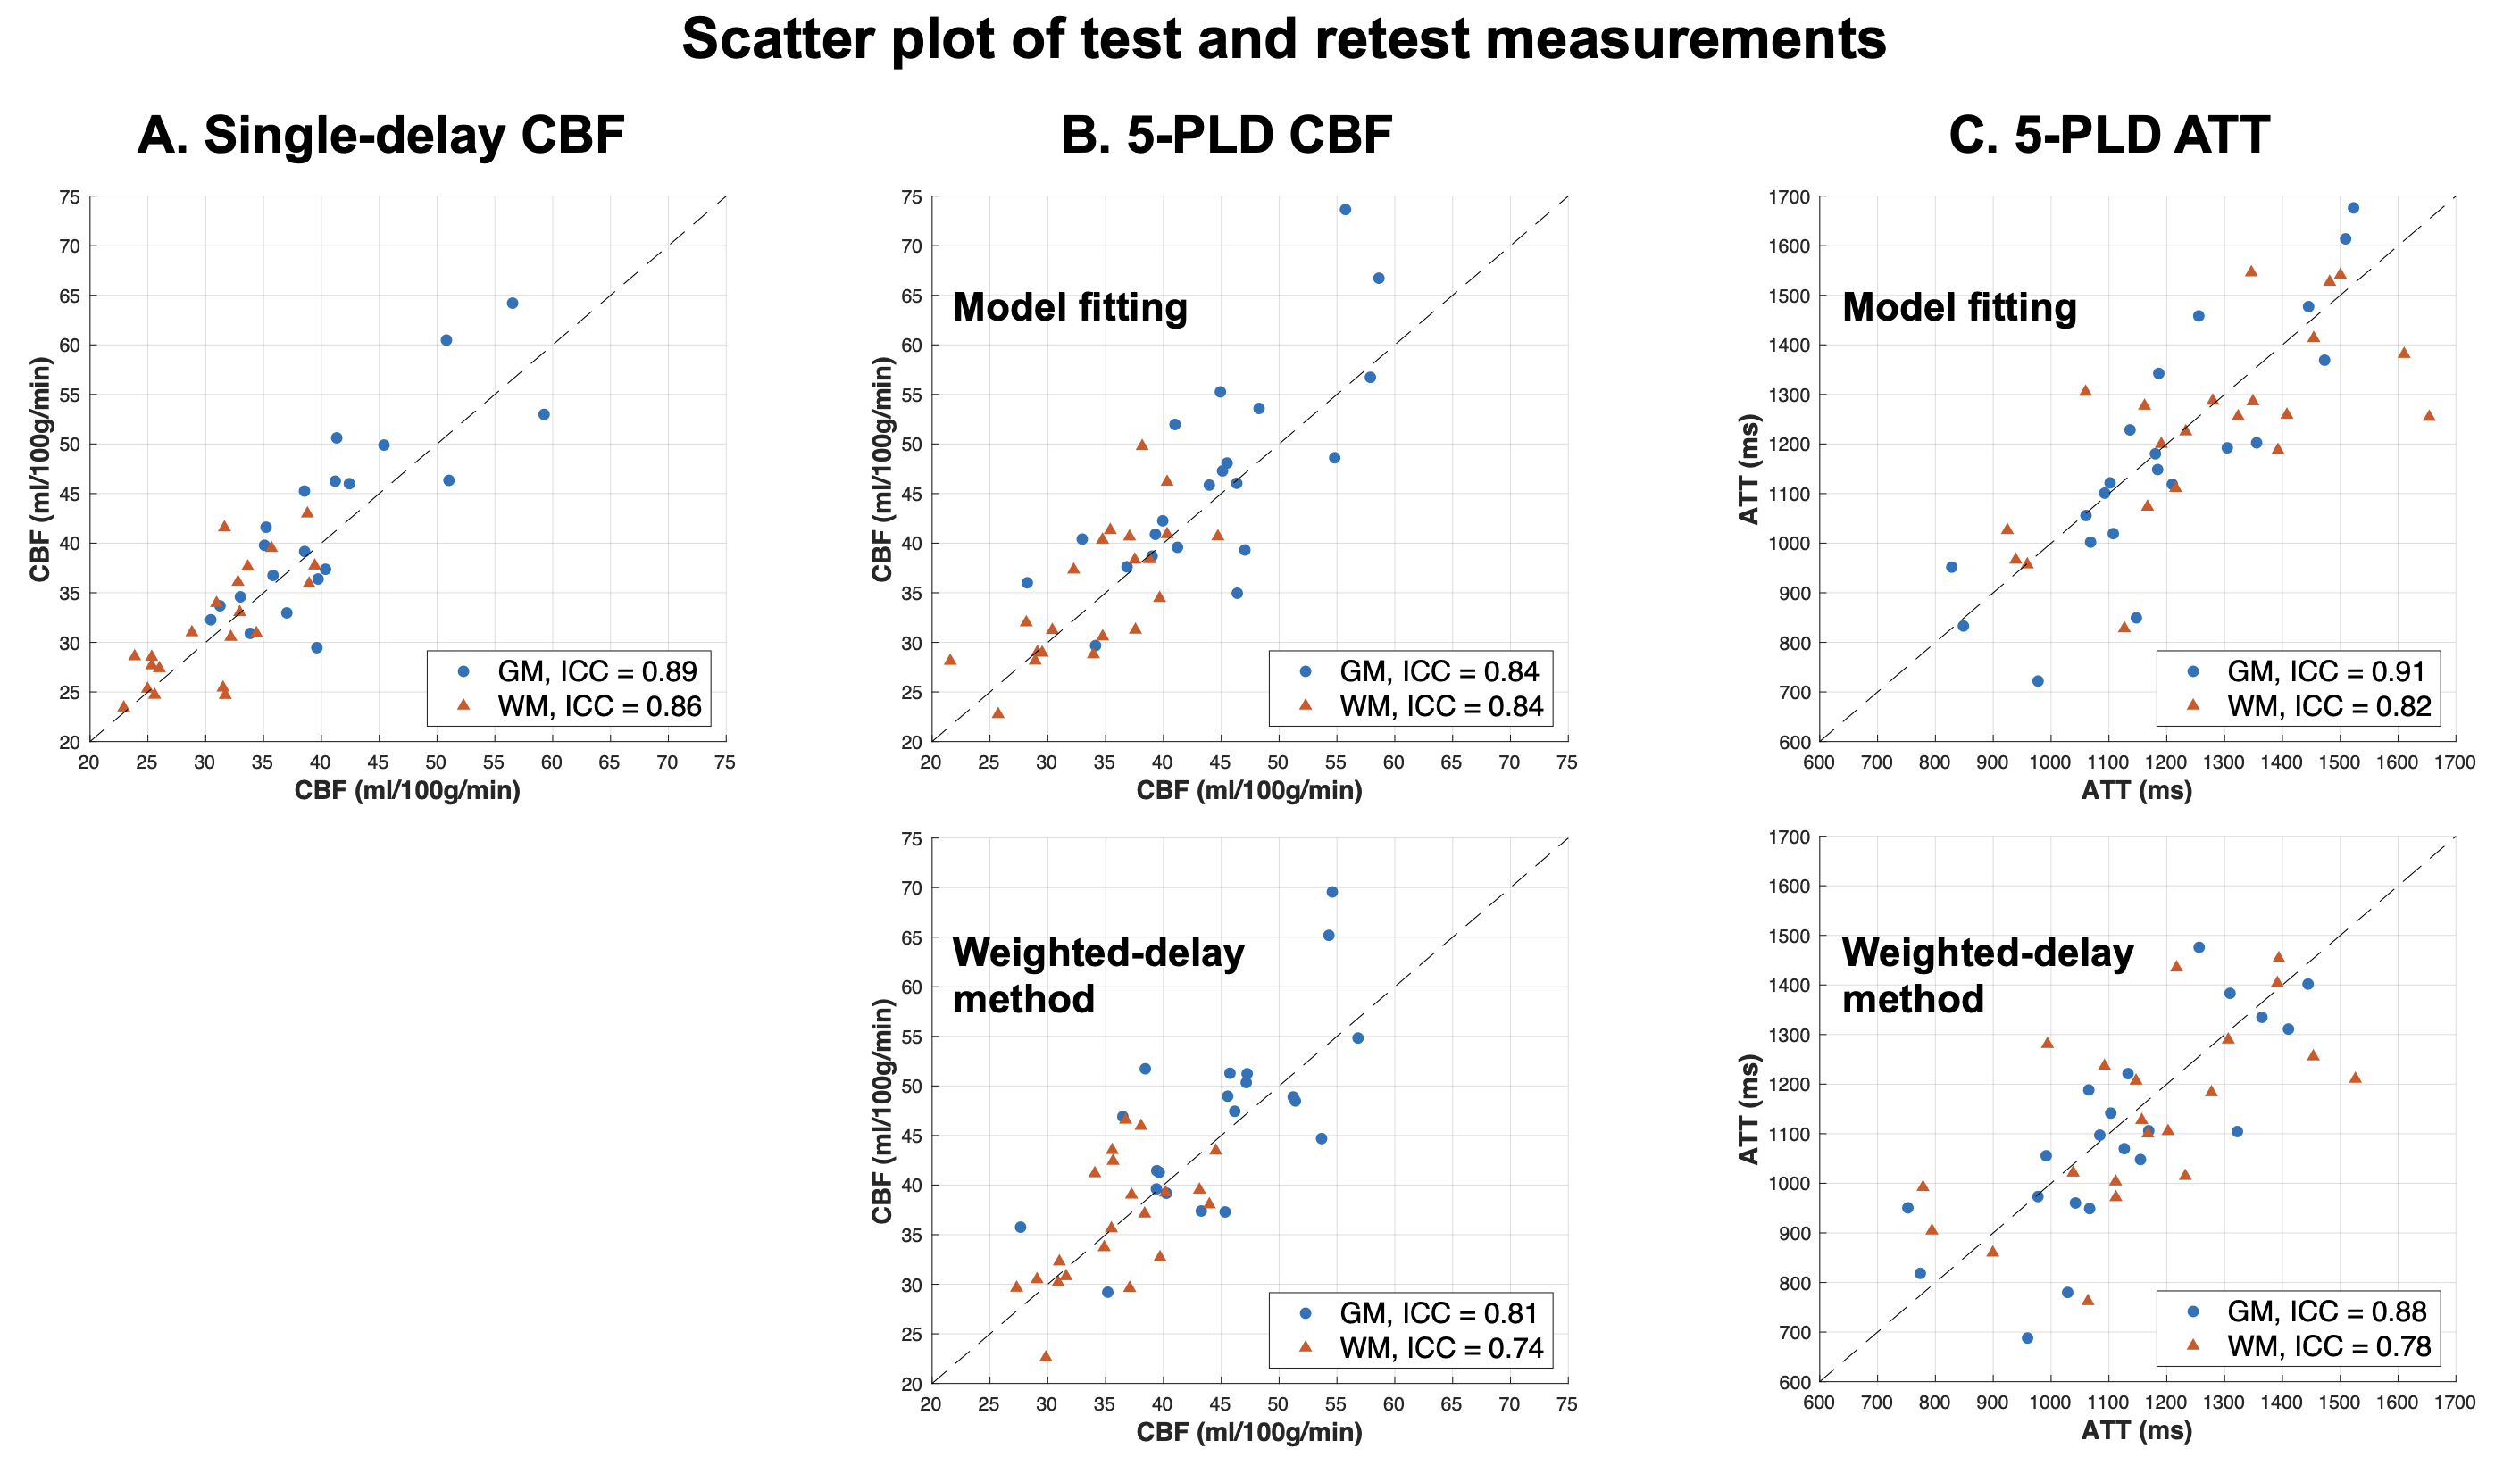
Figure 5. Scatter plots of test and retest CBF (A and B) and ATT (C) values across 21 subjects. GM and WM results were shown as blue and orange markers, respectively.
DOI: https://doi.org/10.58530/2023/2753