2752
Optimizing background suppression for dual-module velocity-selective ASL and characterizing the temporal noise1Bioengineering, University of California Riverside, Riverside, CA, United States
Synopsis
Keywords: Arterial spin labelling, Brain
Background suppression (BS) was optimized for dual-module velocity-selective arterials spin labeling (dm-VSASL) using VS inversion (dm-VSI). Compared with the Siemens product pulsed ASL (PASL) and pseudo-continuous ASL (PCASL) labeling, dm-VSI with optimized BS produced significantly higher temporal SNR; and a better suppression of the temporal noise from background tissues was observed with dm-VSI labeling by analyzing the temporal noise level with respect to the BS level. Further investigation is needed to verify and understand these findings to take full advantage of the improved SNR performance of dm-VSASL.Introduction
Dual-module velocity-selective ASL (dm-VSASL) 1 utilizes more balanced gradients in acquisition of label and control images to reduce labeling errors, and can provides superior SNR performance, while being immune to arterial transit time (ATT) artefacts. Compared to previous VSASL methods 2-4, dm-VSASL enables more flexible and efficient background suppression (BS) 1 with velocity-selective inversion (VSI) or velocity-selective saturation with built-in inversion (VSSinv) modules, and its optimization is needed.Methods
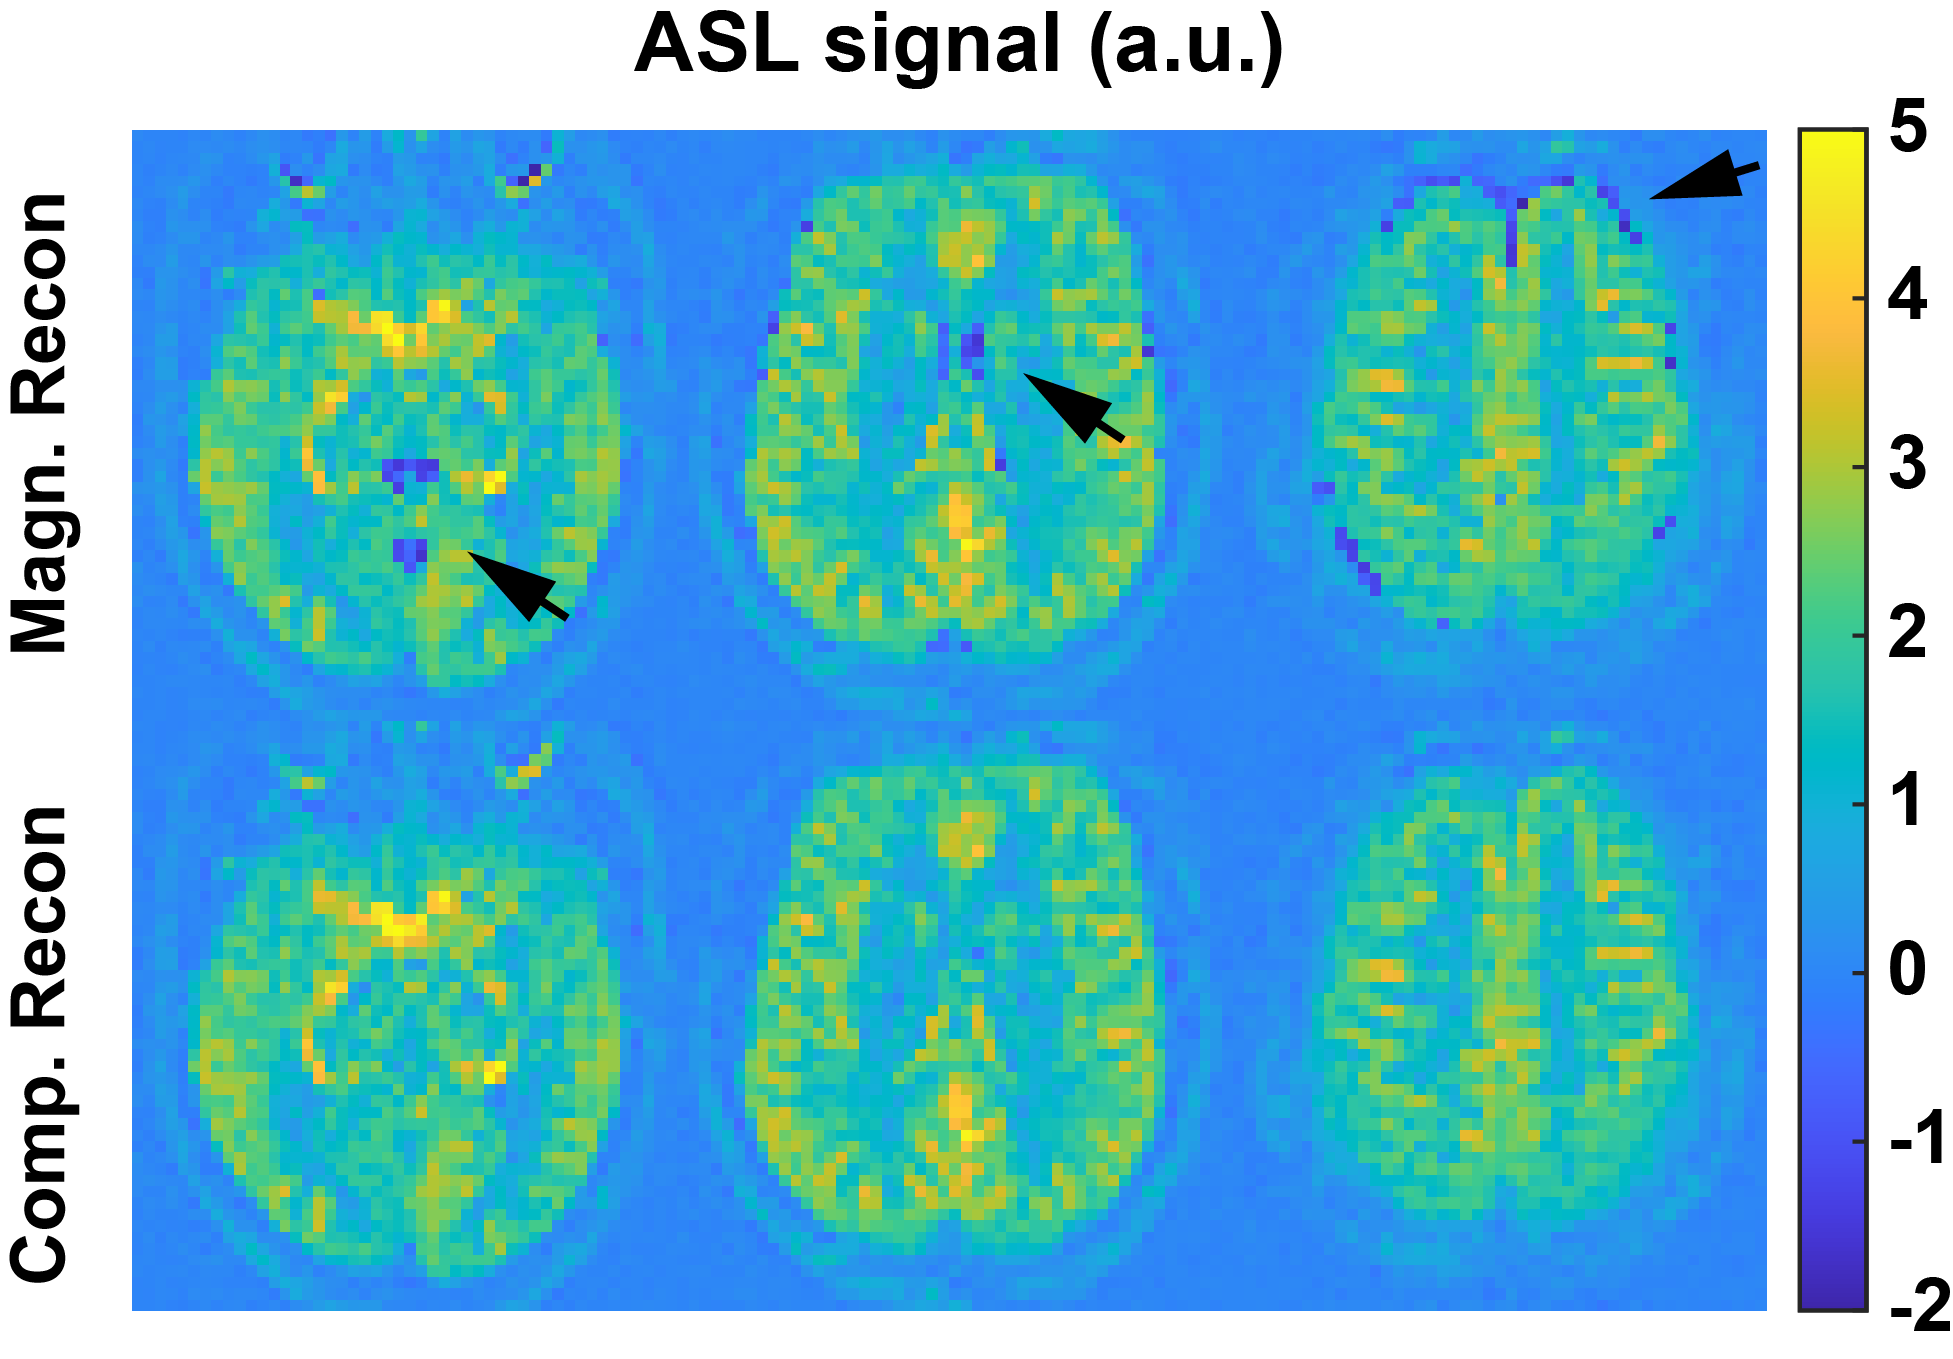
BS modeling. The inversion effect of the VSI and VSSinv modules can be used for BS and should be taken into account in its optimization. From the VSASL signal standpoint, the inversion in VSI or VSSinv is free and “perfect”, as it does not cause additional signal reduction nor increase SAR 3, 5. Compared to traditional BS pulses, the effective inversion efficiency of VSI or VSSinv pulses is reduced due to longer effective TE (eTE), i.e. by $$$exp(-eTE/T2,i)$$$, where T2,i is the T2 of the tissue of interest.BS design consideration. A few important criteria are to be consider: 1) the timing of BS pulses is based on the timing of VS modules for optimal ASL signal; 2) good suppression of CSF signal is desired; 3) using as few additional BS pulses as possible; 4) avoiding rectification errors associated with magnitude reconstruction, which can be relaxed if complex reconstruction is available.
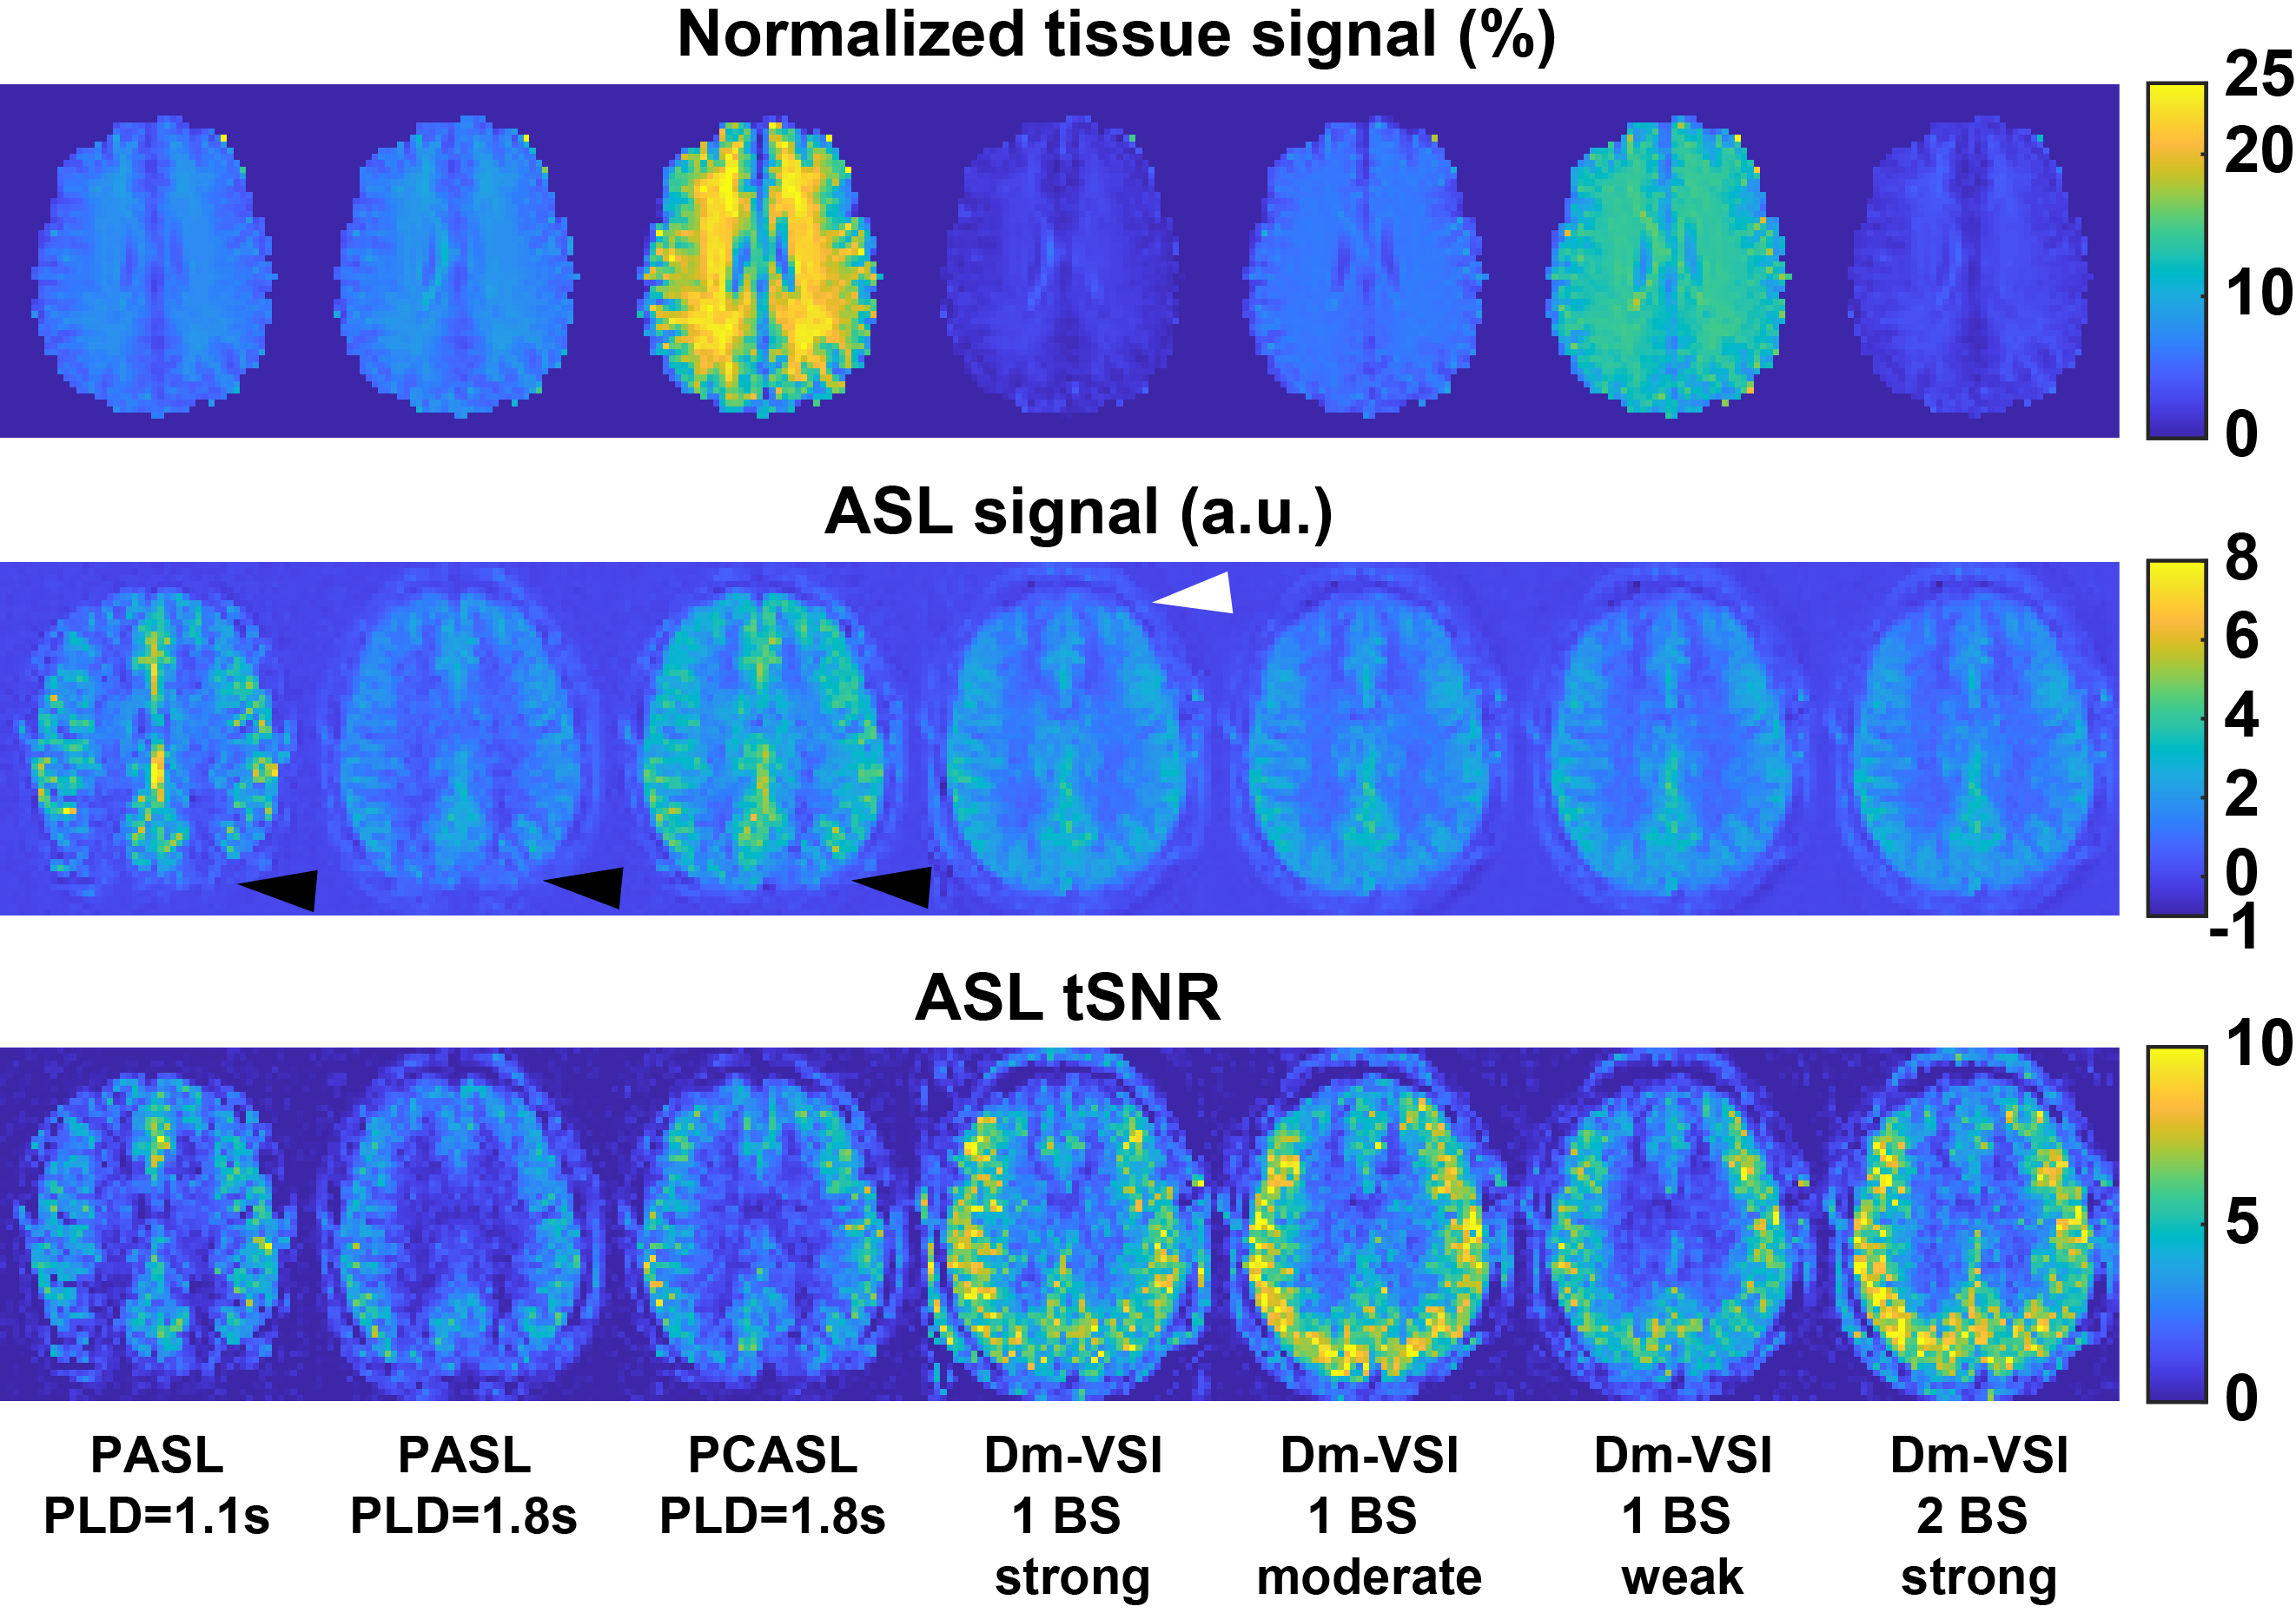
Four BS settings were considered for dm-VSI labeling with TI1/2=1.45/0.54s. Three with 1 BS pulse: 1) strong BS (BS1-strong), BS_TI=110ms; 2) moderate BS (BS1-moderate), BS_TI=260ms; 3) weak BS (BS1-weak), BS_TI=410ms; and one with 2 BS pulses: 4) strong BS (BS2-strong), BS_TI1/2=480/350ms.
In vivo experiment. Three healthy subjects (1 female, age 39) were scanned on a 3T scanner (Siemens Prisma, Erlangen, Germany) under an IRB approval. Sinc-VSI 5 was used for dm-VSI labeling with the BS timings above. For reference, the product PASL and PCASL sequences were scanned using default setting: 1) PASL: FAIR 6 with Q2Tips 7 and TI1/TI=0.7/1.8s (PLD=1.1s) and 2 BS pulses (BS_TI1/2=1150/370ms); 2) PCASL 8: LD/PLD=1.8/1.8s, 4 BS pulses after labeling (BS_TI1/2/3/4=1260/350/335/80ms); and 3) PASL with a longer delay: TI1/TI=0.7/2.5s (PLD=1.8s) and 2 BS pulses (BS_TI1/2=1400/420ms). Other imaging parameters included: single-shot 3D GRASE EPI readout with GRAPPA 9 (x2 PE acceleration), FOV=220x220mm (64x64), 24 slices, 4mm thickness, TR=4s (PASL) and 5s (PCASL/VSASL), TE=21.4ms, 2:40 minutes of acquisition time, cutoff velocity=2cm/s along S/I in VSASL. Fully relaxed reference and T1w anatomical images were acquired.
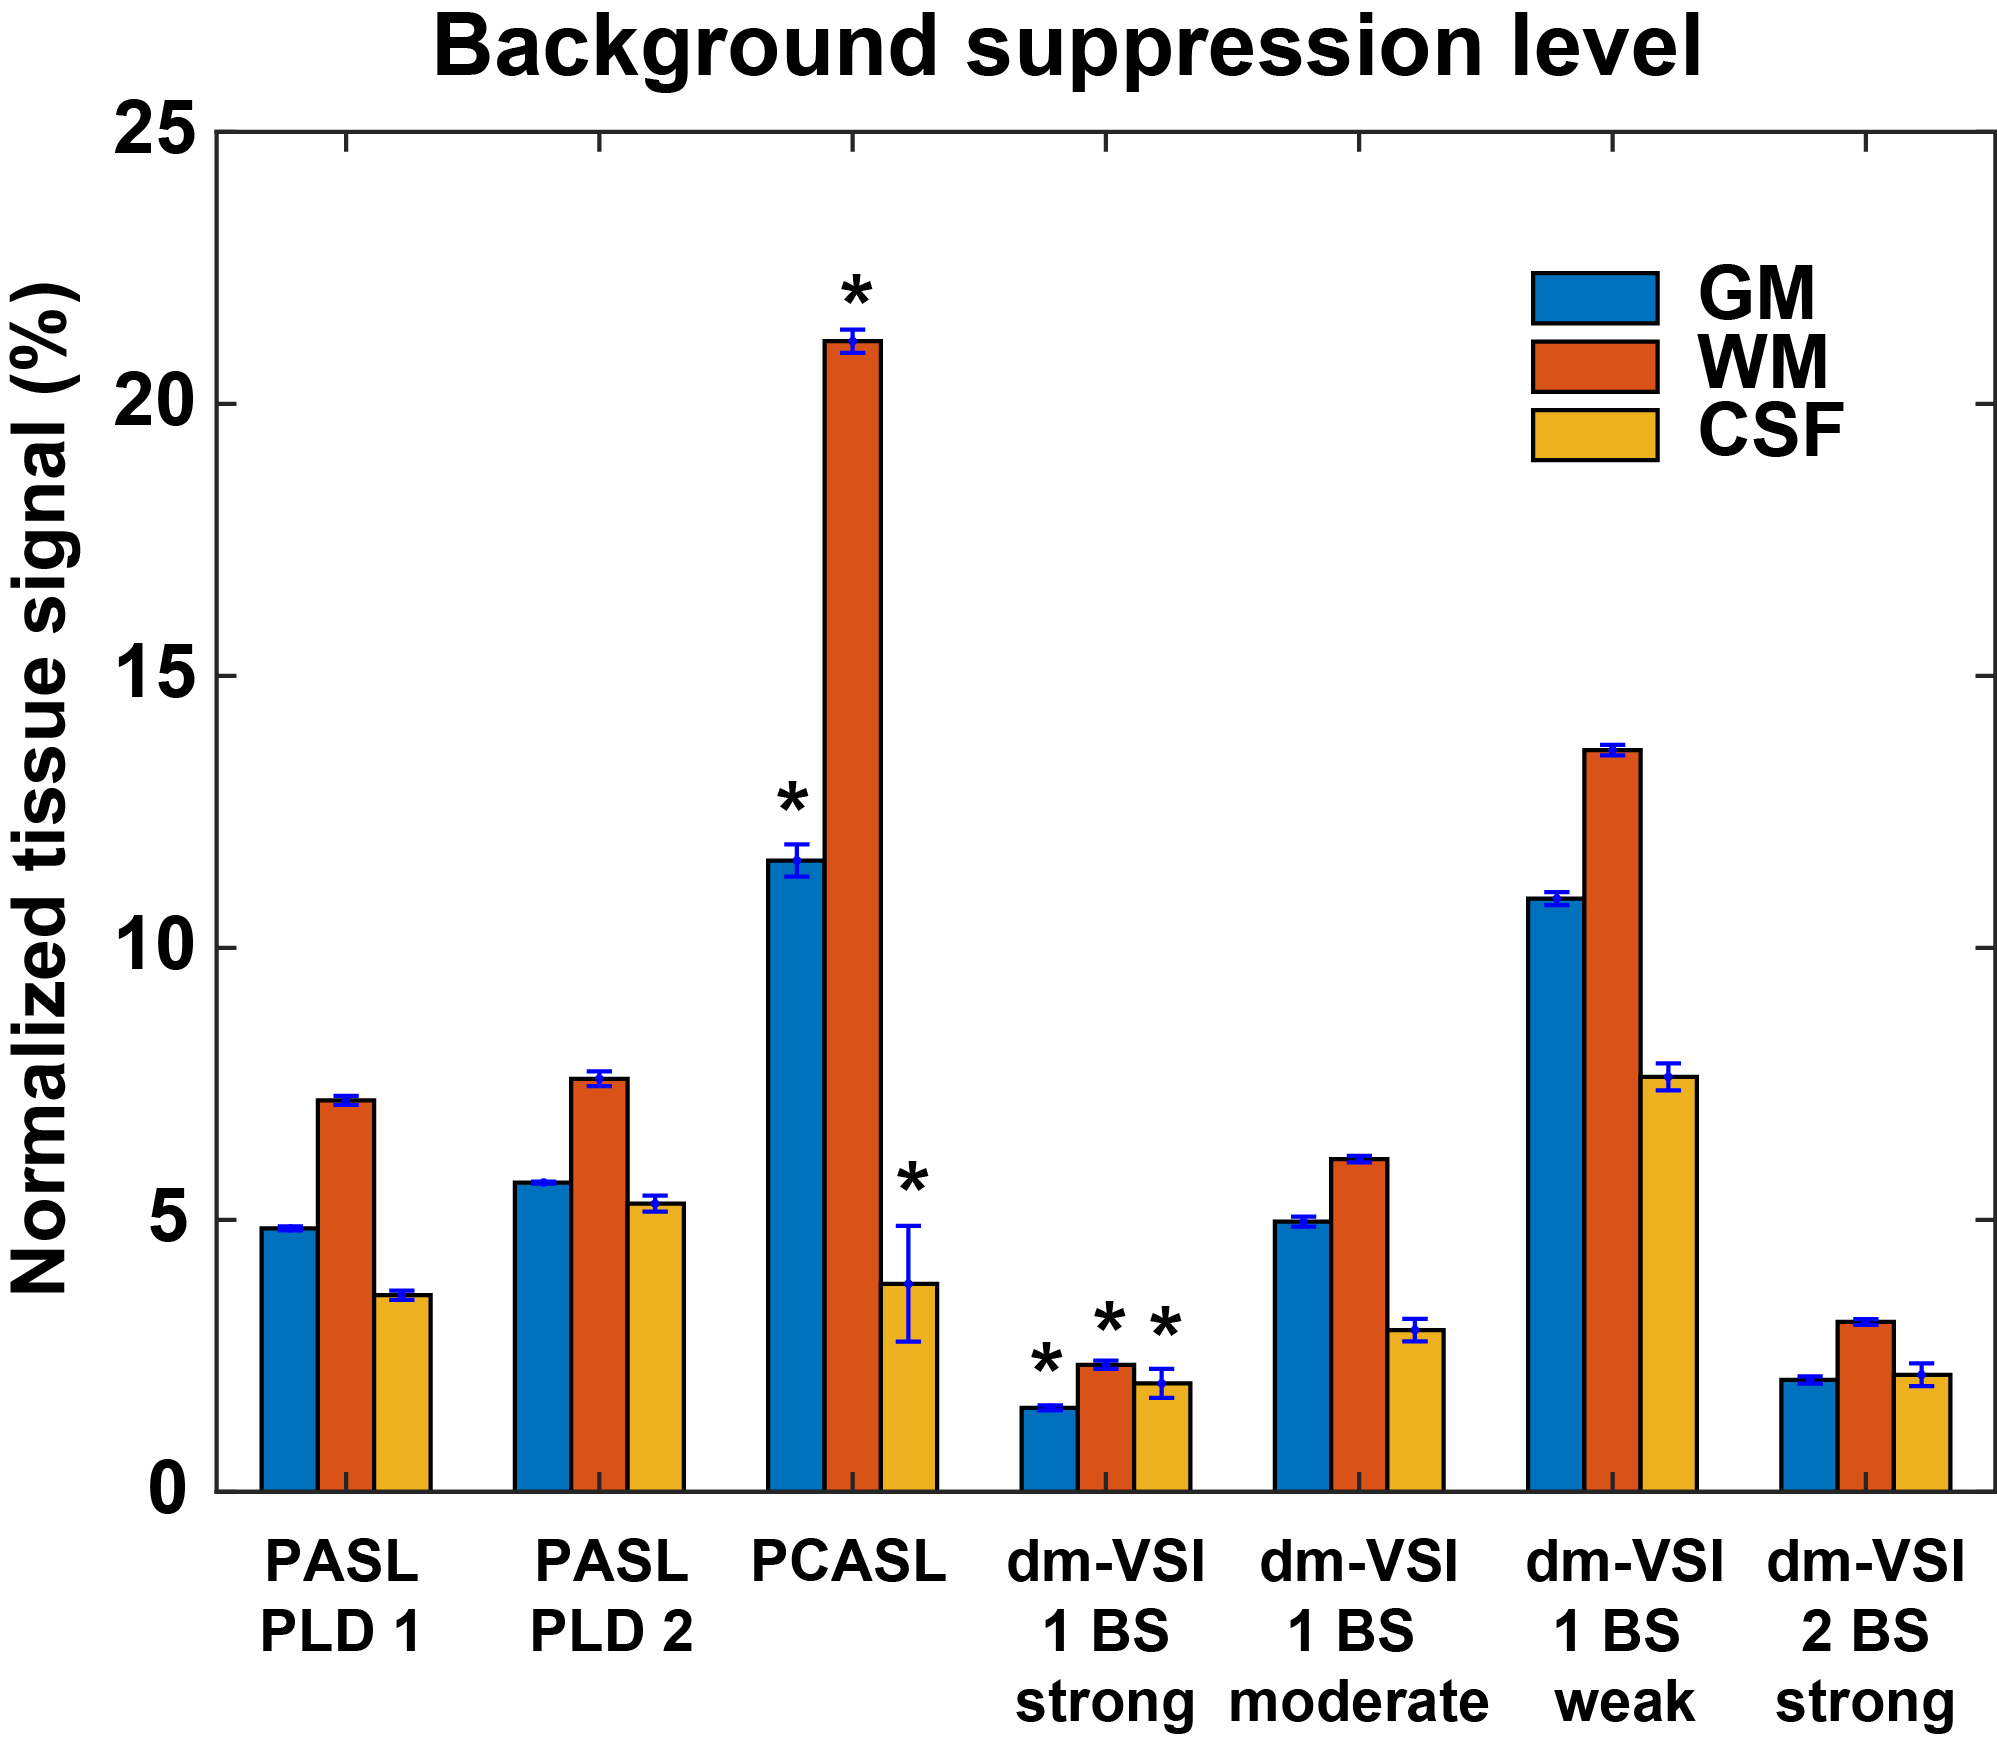
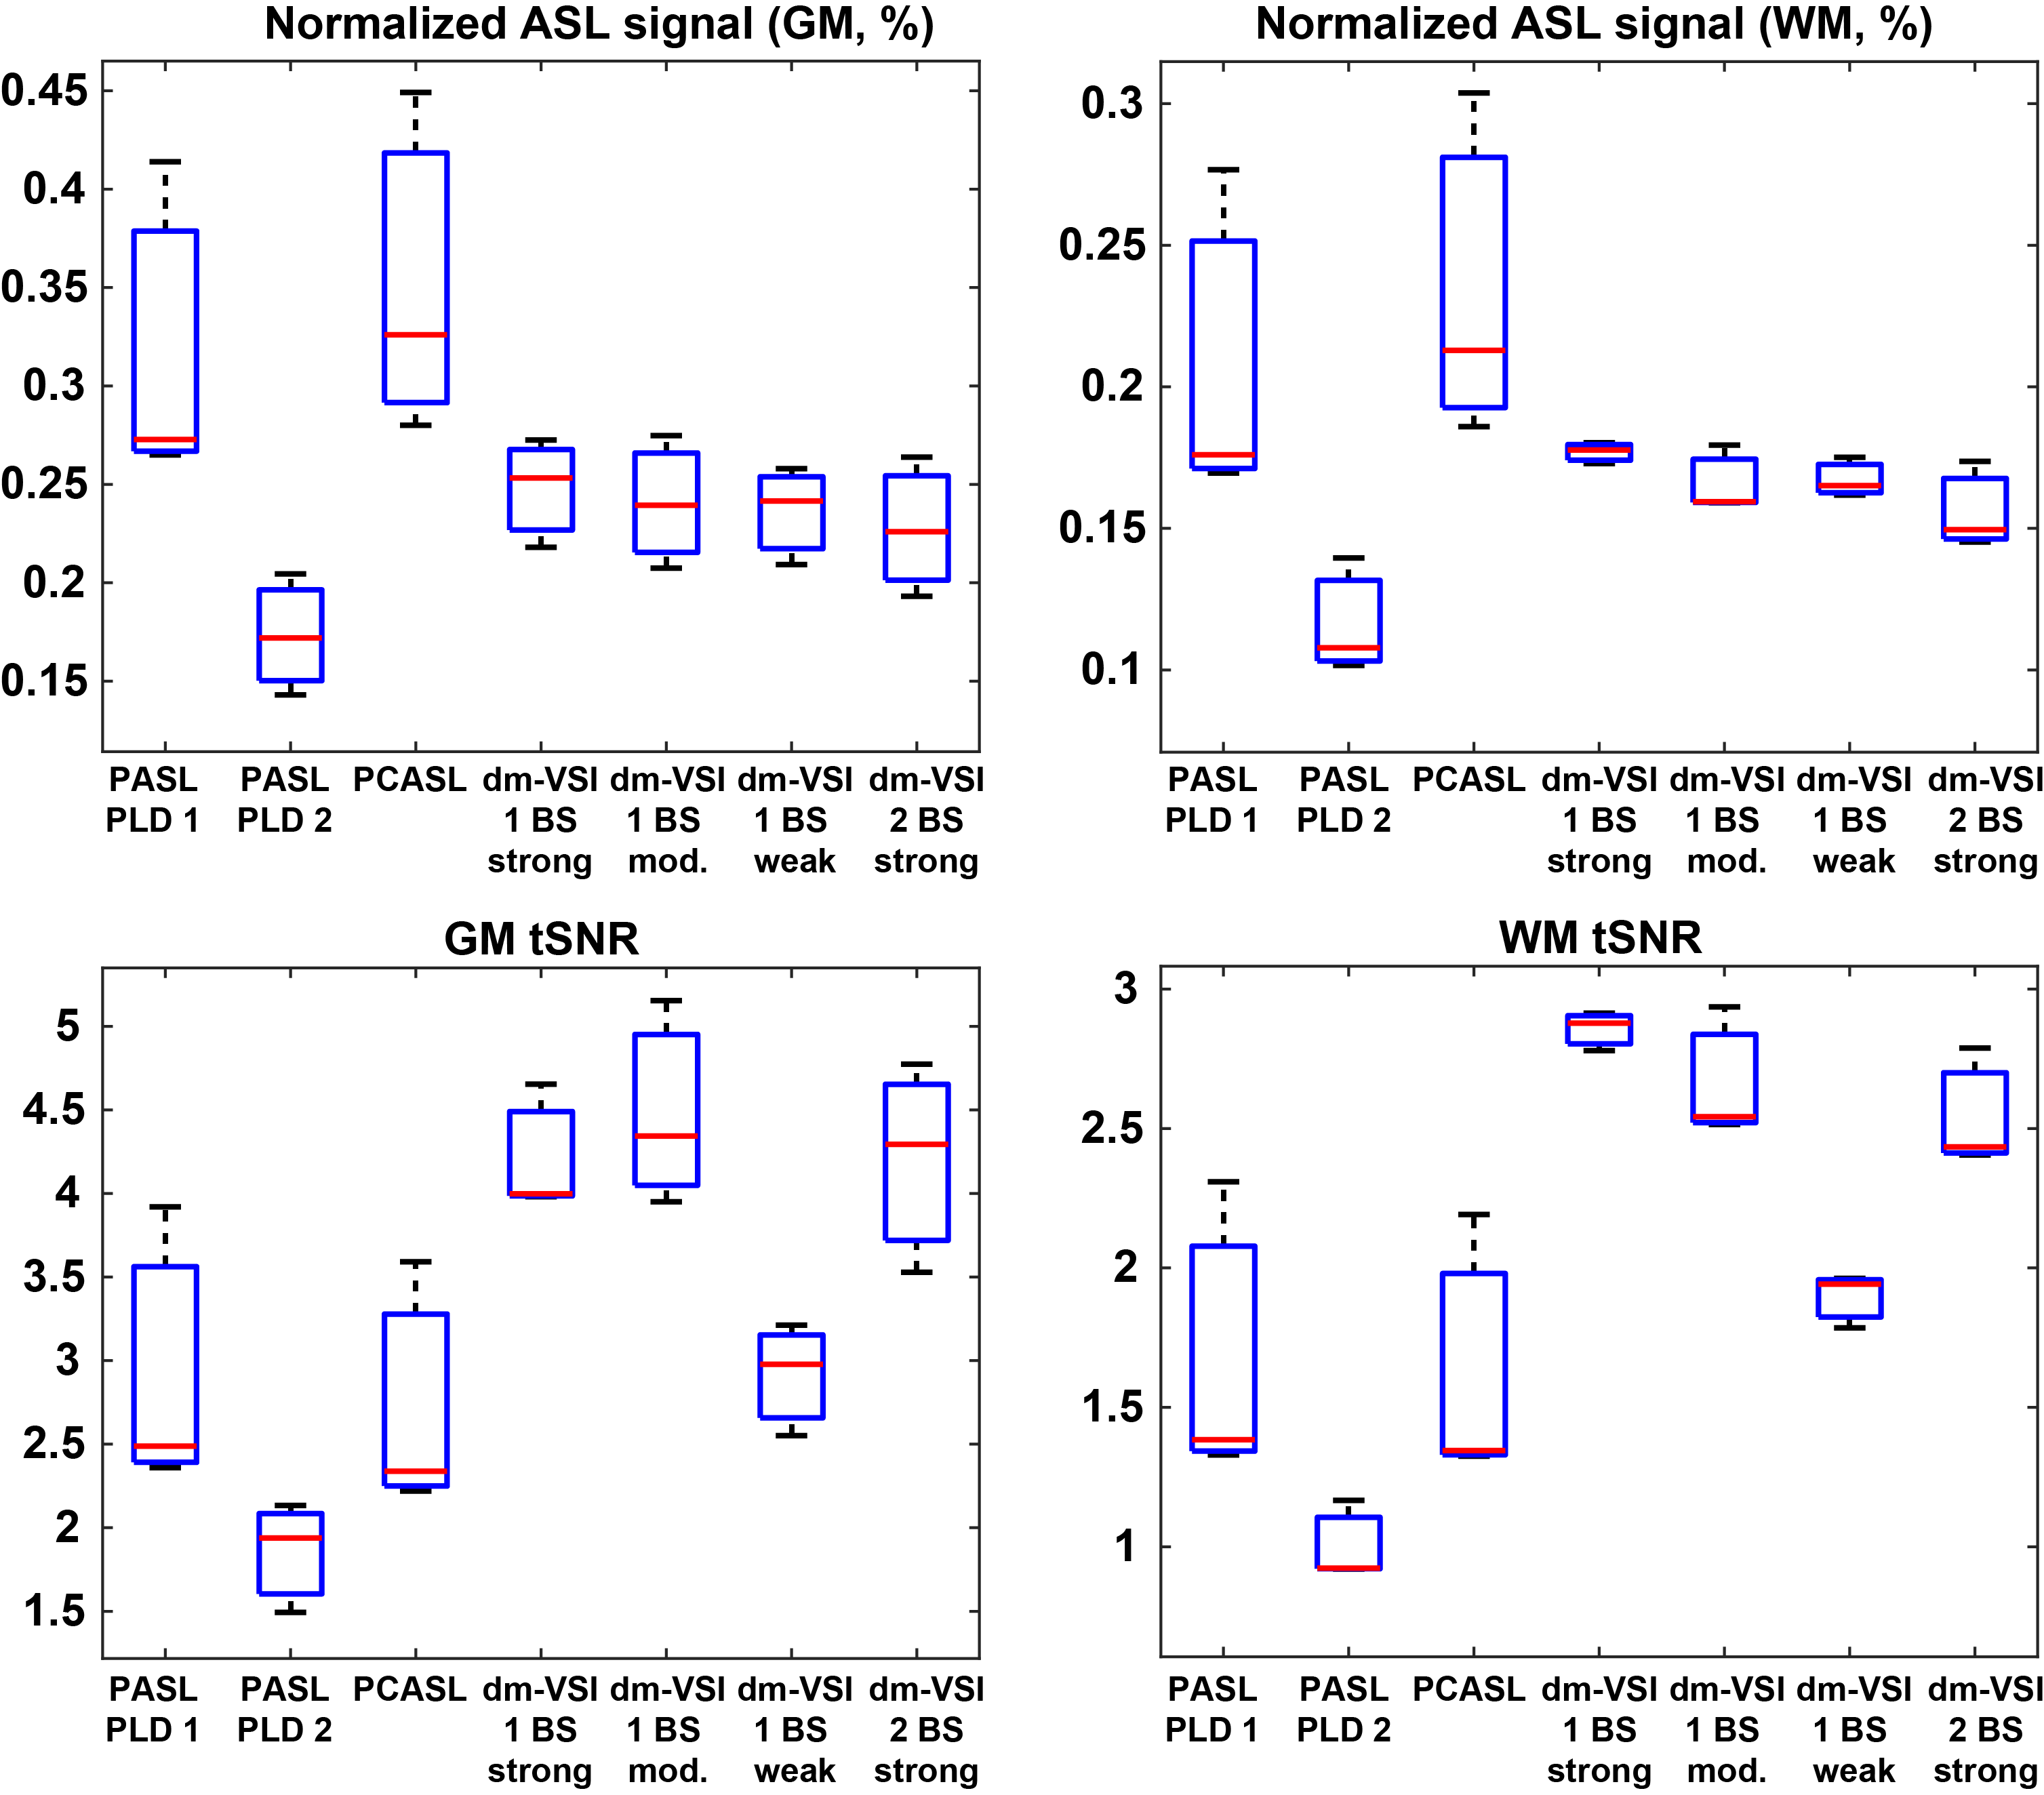
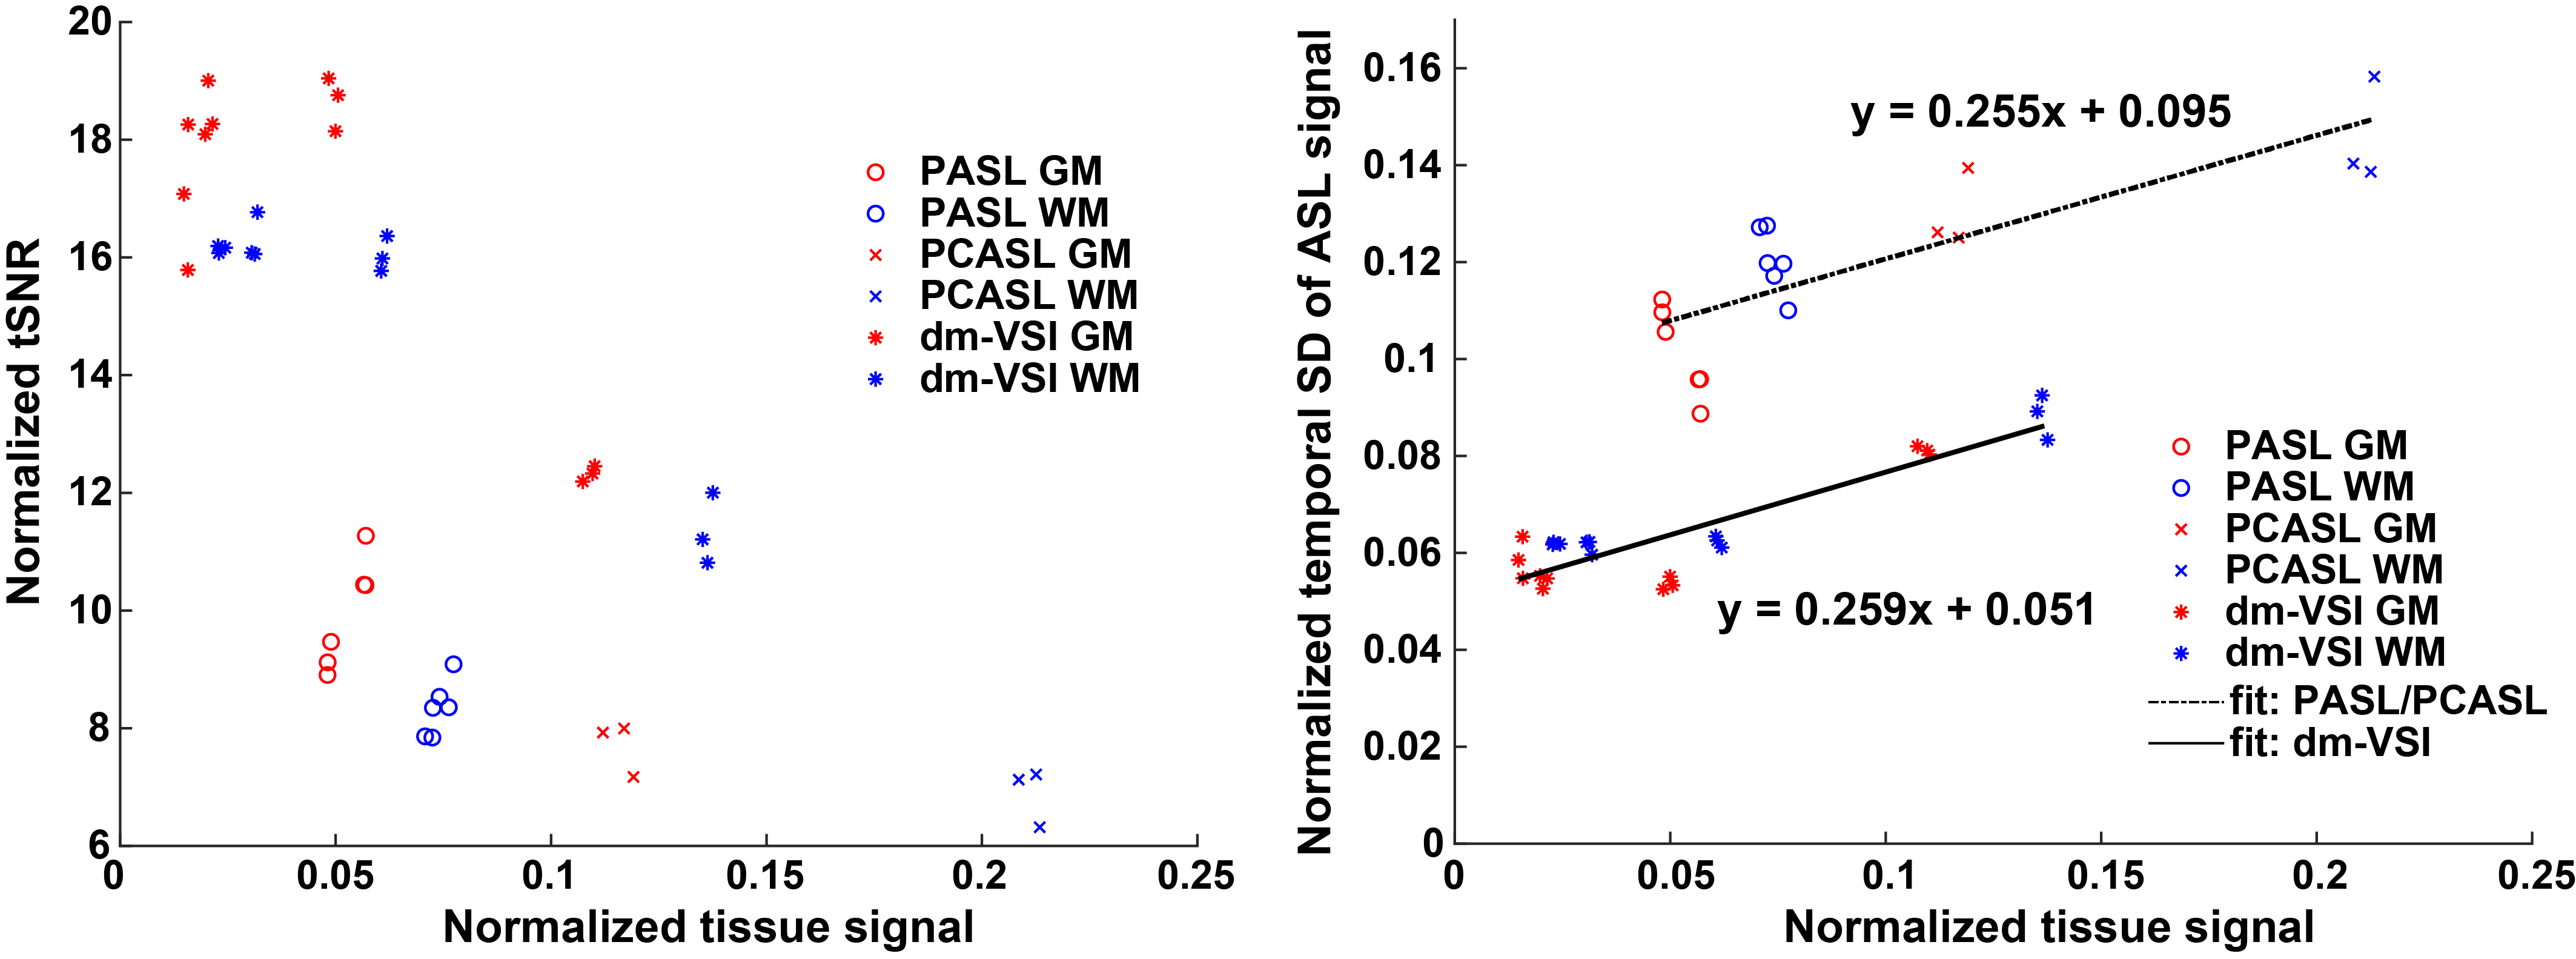
Data processing. The raw images were complex-reconstructed and pair-wise subtracted to obtain the ASL signal, which was then normalized by the reference image. Temporal SD (tSD) of the ASL signal was estimated, and used to calculate the temporal SNR (tSNR) 10. BS levels were estimated as percentage of the tissue signal in the reference image. GM, WM and CSF regions of interest (ROIs) were identified from the anatomical images and co-registered to the ASL images using FSL 11. The tSNR normalized by the ASL signal and the tSD with respect to BS levels were analyzed, and linear regression was performed.
Results
Examples in Figure 1 demonstrate improved accuracy using complex reconstruction compared to magnitude reconstruction. Examples of BS level, ASL signal and tSNR maps are shown in Figure 2. Averaged BS levels, normalized ASL signal and tSNR in different ROIs are summarized in Figures 3 and 4. The results from the noise analysis are shown in Figure 5.Desired BS levels (strong/moderate/weak) were achieved for dm-VSI labeling. Compared to dm-VSI with BS1-strong, the ASL signal remained relatively constant across different BS levels using 1 BS pulse (97.1% and 95.3% with BS1-moderate and BS1-weak), and lower (91.8%) with BS2-strong in GM; and similarly in WM (93.8%, 94.6% and 88.2%, respectively). The relative tSNR were 106.5%, 69.2% and 99.7% with BS1-moderate, BS1-weak and BS2-strong in GM, and 93.3%, 66.4% and 89.0% in WM, respectively. Overall, the best signal and tSNR performance were obtained with BS1-strong for dm-VSI. In comparison, PASL and PCASL had higher ASL signal (except PASL with longer TI) but lower tSNR (except dm-VSI with BS1-weak). The regression analysis showed a similar linear relationship between the noise and the BS levels, with different intercepts for PASL/PCASL and dm-VSI.
Discussion
Excellent BS of GM, WM and CSF can be achieved with dm-VSASL. Stronger BS in dm-VSI resulted in better SNR performance, consistent with findings with PASL 12 and PCASL 13. At a similar BS level, using fewer BS pulses preserved more signal and had higher tSNR.The BS in this PCASL implementation was suboptimal, and rectification errors were seen in all subjects, indicating a need for improvement. In contrast, dm-VSI with BS1-strong did not show rectification errors though the tissue signals were also negative.
Comparing PASL (TI=1.8s) and dm-VSI (BS1-moderate) at a similar BS level, it is interesting that PASL measured higher ASL signals but lower tSNR. Noise analysis also indicated higher temporal fluctuation in PASL (and PCASL). This requires verification and further investigation. Dm-VSI demonstrated immunity to ATT artefacts that were observed with PASL/PCASL, but its robustness to field inhomogeneities needs improvement 1, 4, 5.
Conclusion
With optimized BS, dm-VSI exhibits superb tSNR performance, outperformed the product PASL and PCASL with recommended timing.Acknowledgements
This work is partially supported by National Institutes of Health, R01EB033210. The author thanks Dr. Jason Langley for help with data collection.References
1. Guo, J. Robust dual-module velocity-selective arterial spin labeling (dm-VSASL) with velocity-selective saturation and inversion. Magn Reson Med. 2022; 1- 15. doi:10.1002/mrm.29513.
2. Wong EC, Cronin M, Wu W-C, Inglis B, Frank LR, Liu TT. Velocity-selective arterial spin labeling. Magn Reson Med. 2006;55(6):1334-41.
3. Guo J, Wong EC. Increased SNR efficiency in velocity selective arterial spin labeling using multiple velocity selective saturation modules (mm-VSASL). Magn Reson Med. 2015;74(3):694-705.
4. Qin Q, van Zijl PC. Velocity-selective-inversion prepared arterial spin labeling. Magn Reson Med. 2016;76(4):1136-48.
5. Guo J, Das S, Hernandez-Garcia L. Comparison of velocity-selective arterial spin labeling schemes. Magn Reson Med. 2021;85(4):2027-39.
6. Kim SG. Quantification of relative cerebral blood flow change by flow-sensitive alternating inversion recovery (FAIR) technique: application to functional mapping. Magn Reson Med. 1995;34(3):293-301.
7. Luh WM, Wong EC, Bandettini PA, Hyde JS. QUIPSS II with thin-slice TI1 periodic saturation: a method for improving accuracy of quantitative perfusion imaging using pulsed arterial spin labeling. Magn Reson Med. 1999;41(6):1246-54.
8. Dai WY, Garcia D, de Bazelaire C, Alsop DC. Continuous Flow-Driven Inversion for Arterial Spin Labeling Using Pulsed Radio Frequency and Gradient Fields. Magn Reson Med. 2008;60(6):1488-97.
9. Griswold MA, Jakob PM, Heidemann RM, Nittka M, Jellus V, Wang J, et al. Generalized autocalibrating partially parallel acquisitions (GRAPPA). Magn Reson Med. 2002;47(6):1202-10.
10. Murphy K, Bodurka J, Bandettini PA. How long to scan? The relationship between fMRI temporal signal to noise ratio and necessary scan duration. Neuroimage. 2007;34(2):565-74.
11. Smith SM, Jenkinson M, Woolrich MW, Beckmann CF, Behrens TEJ, Johansen-Berg H, et al. Advances in functional and structural MR image analysis and implementation as FSL. Neuroimage. 2004;23:S208-S19.
12. Ye FQ, Frank JA, Weinberger DR, McLaughlin AC. Noise reduction in 3D perfusion imaging by attenuating the static signal in arterial spin tagging (ASSIST). Magn Reson Med. 2000;44(1):92-100.
13. Maleki N, Dai W, Alsop DC. Optimization of background suppression for arterial spin labeling perfusion imaging. MAGMA. 2012;25(2):127-33.
Figures