2750
Investigating systematic error in pseudocontinuous Arterial Spin Labelling estimates of cerebrovascular reactivity1School of Life Sciences, University of Nottingham, Nottingham, United Kingdom
Synopsis
Keywords: Arterial spin labelling, Arterial spin labelling
New clinical tools are needed for the diagnosis and prognosis of cerebrovascular diseases. Cerebrovascular Reactivity (CVR) is a potential marker for brain health and can be induced using stressors to the brain like a hypercapnia challenge and quantitatively mapped using pseudocontinuous Arterial Spin Labelling (pCASL). However, measurements of CVR using pCASL have been shown to vary depending on the parameters of the unbalanced pCASL preparation scheme used. In this study the effect of a diminished B1 at the labelling plane and changes in B0 during hyperventilation were investigated as the origin of this discrepancy.INTRODUCTION
Clinical biomarkers are required for measuring brain health, particularly for diagnosing cerebrovascular diseases[1]. Pseudocontinuous Arterial Spin Labelling (pCASL)[2] is able to quantify tissue cerebral blood flow (CBF) and by using a vasoactive stimulus it can quantify the cerebrovascular reactivity (CVR); a measure of brain health and a potential clinical biomarker[3]. pCASL is a direct measure of CBF and has the potential to provide quantitative maps of CVR. However, measurements of CVR using pCASL have been shown to vary depending on the parameters of the unbalanced pCASL preparation scheme used[4]. Another study has suggested that reduced B1+ at the labelling plane could explain the observed change in labelling efficiency[5]. Hyperventilation also commonly occurs during a hypercapnic challenge and it is possible that changes in breathing frequency or depth may alter the B0 at the labelling plane.This study used a hyperventilation challenge that involved maintaining normal carbon dioxide (CO2) levels during both normal breathing and hyperventilation to investigate associated changes in B0. Furthermore, the B1 at the labelling plane was also measured during normal breathing. The long-term aim is to produce robust quantitative estimates of CVR for use in health (e.g. ageing) and disease (e.g. stroke)[1].
METHODS
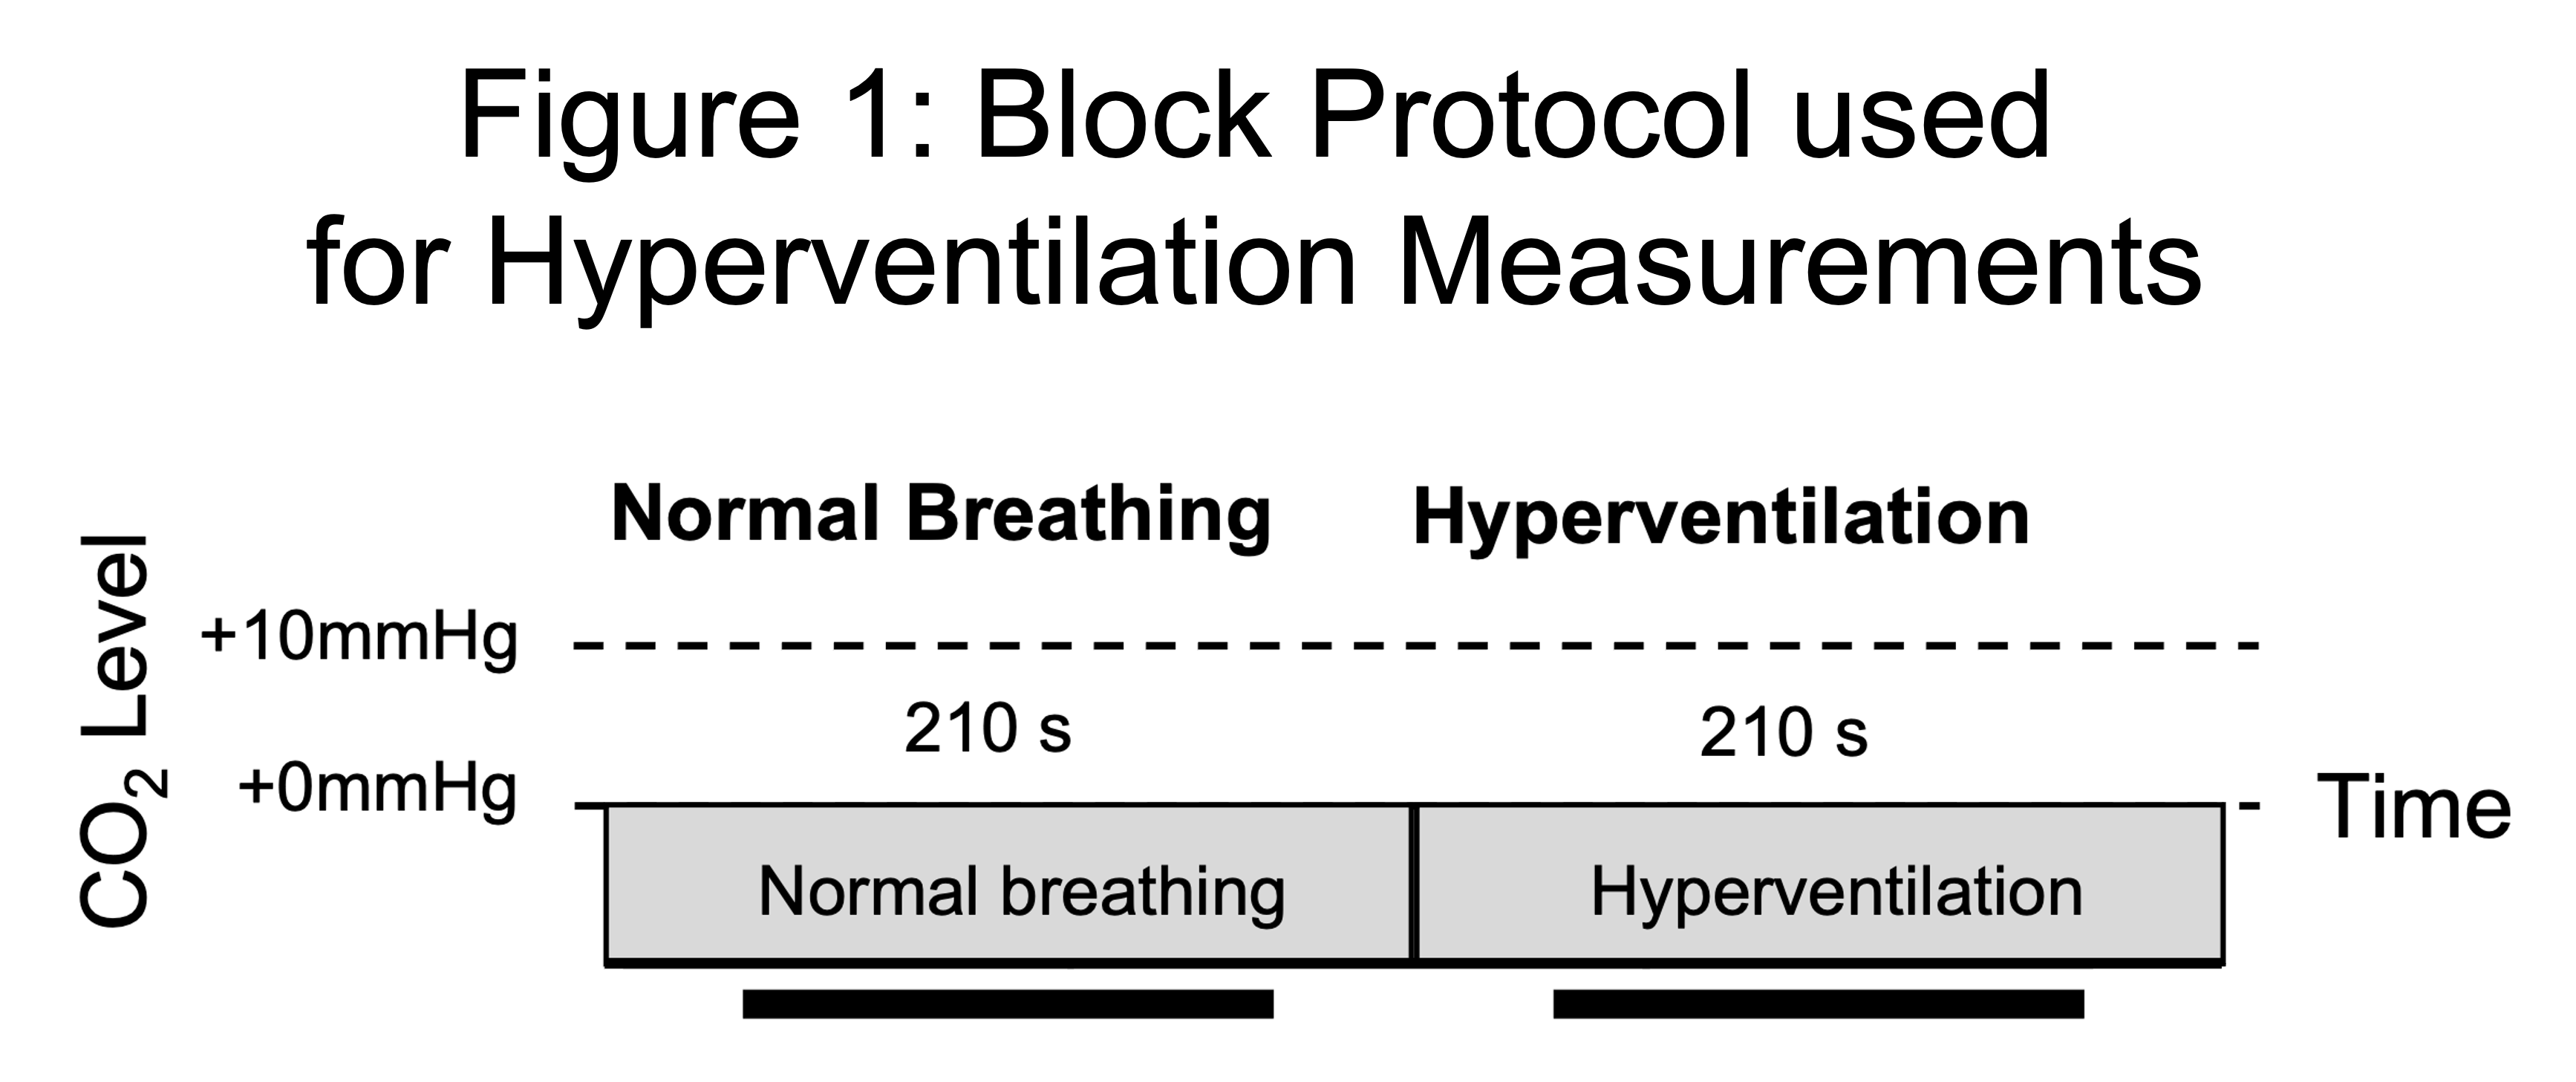
Participants: Written informed consent was obtained from healthy volunteers (N=7, F=2, 30.2±11.8 years (Mean±Standard Deviation)) following local ethics committee approval.Hyperventilation: Participants were fitted with a sequential gas delivery (SGD) mask to perform the hyperventilation protocol (Fig. 1). The flow of medical air into the mask was tailored to clamp the end-tidal partial pressure of CO2 (PETCO2)[6]. Participants were asked to breath normally for the first 210s of the protocol whilst their PETCO2 was passively monitored. Then they were asked to hyperventilate for a further 210s whilst the PETCO2 was maintained at their normocapnic level via the SGD mask.Imaging: Participants were scanned using a 3T Ingenia scanner (Philips Healthcare, Best, Netherlands) using the vendors 32-channel receive coil. The labelling plane for pCASL was planned using a TOF-MRA and located at the level of the V3 segment of the vertebral arteries. Multislice B1 mapping was performed during normal breathing centred on the labelling plane. Serial acquisition of B0 maps in a single slice located at the labelling plane was performed during the hyperventilation protocol (TR=1s, 420 repetitions).
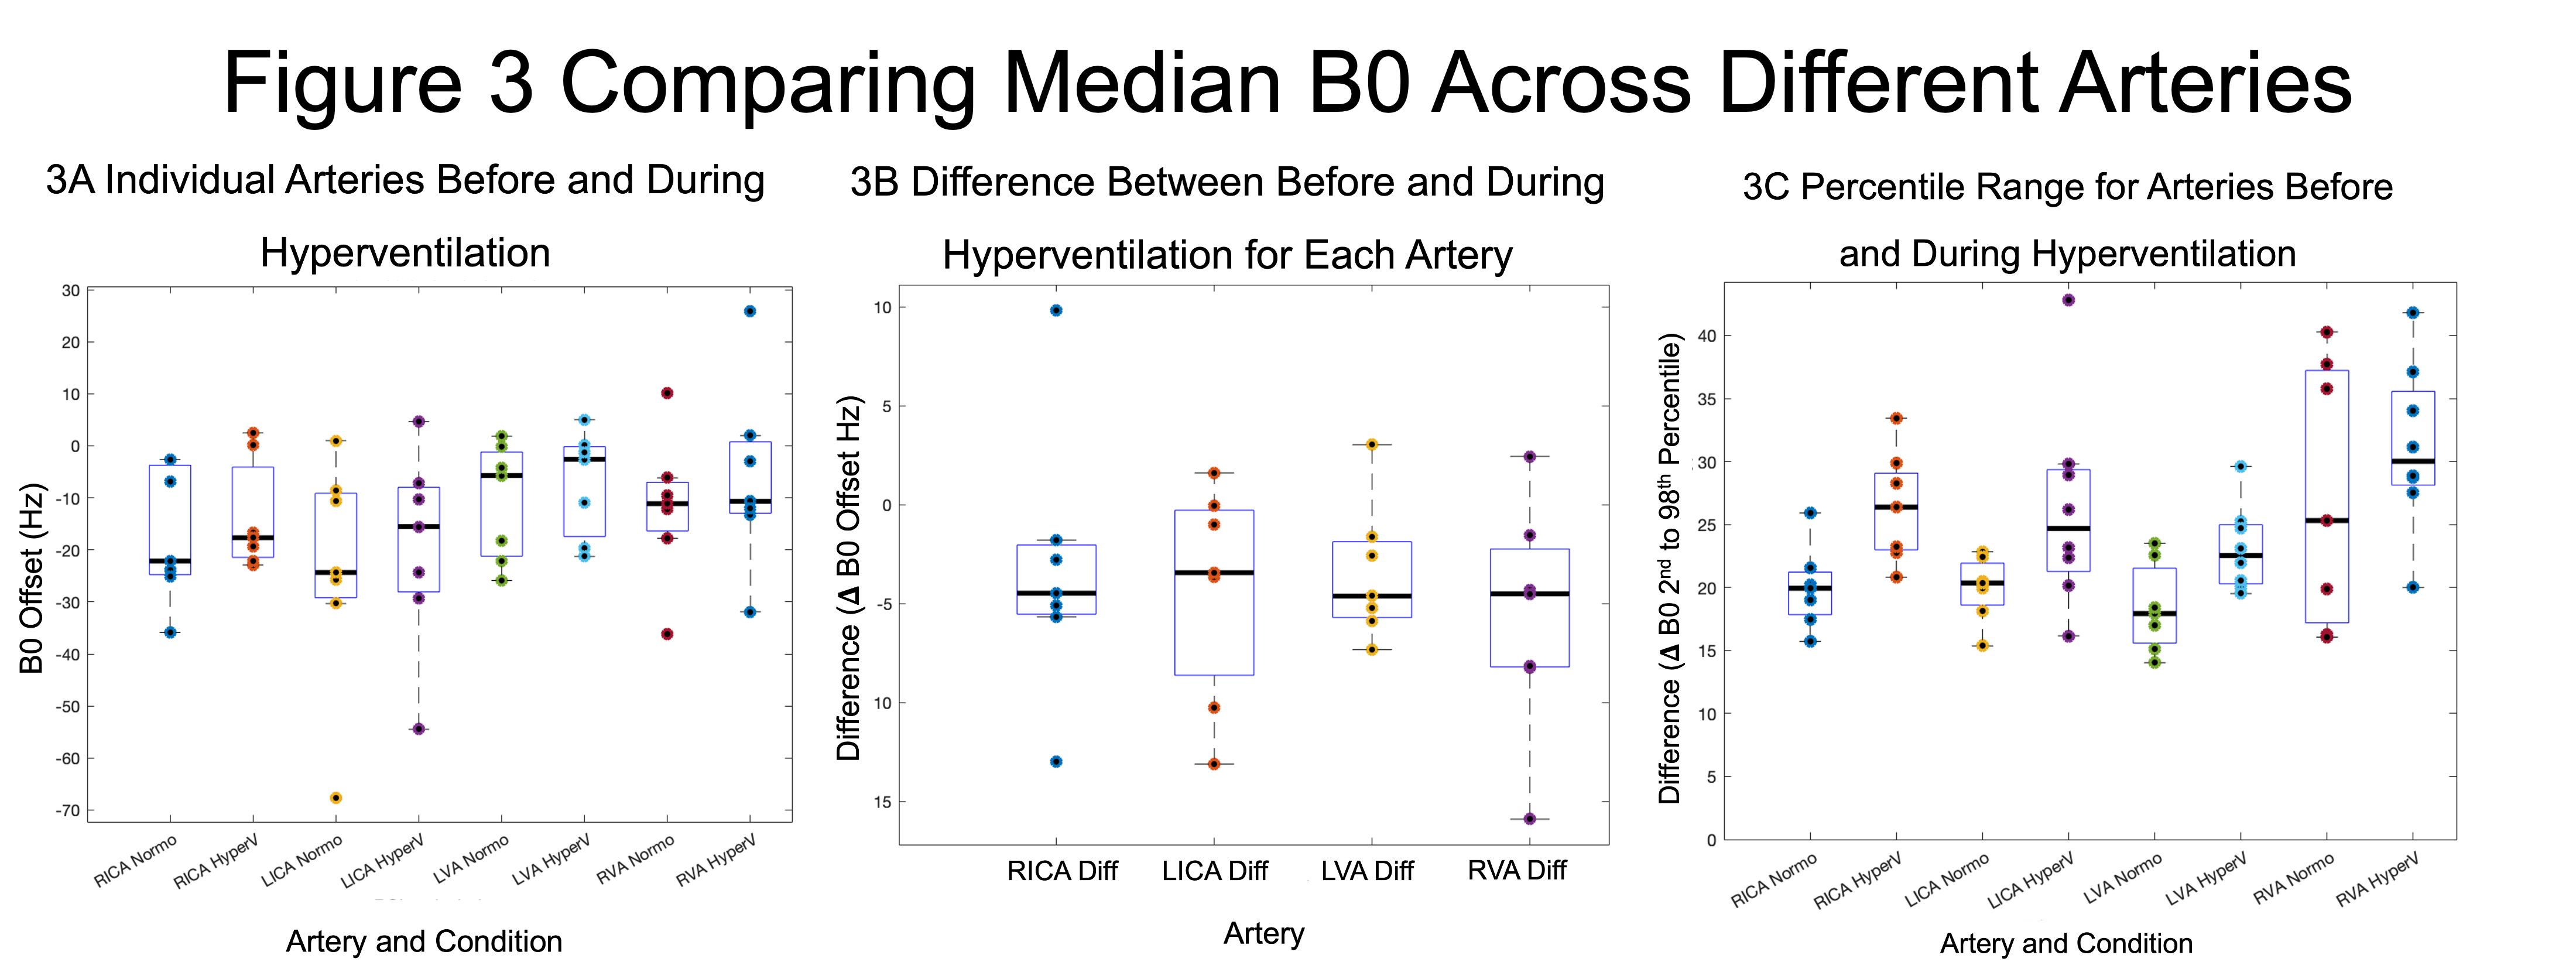
Analysis: Median values of B0 and B1 were extracted from four artery ROIs of 5x5 pixels (left (L) and right (R), internal carotid (ICA) and vertebral (VA) arteries) using FSLeyes[8] and in-house scripts (MATLAB, Mathworks, Natick, MA). The change in B0 was calculated as the B0 during normal breathing (first 200s) minus the B0 during hyperventilation (last 200s). The difference between the 2nd and 98th percentiles over time was also calculated for normal breathing and hyperventilation as a more robust measure of the range of B0 values during hyperventilation. The B1 was estimated as a percentage of the nominal flip angle.
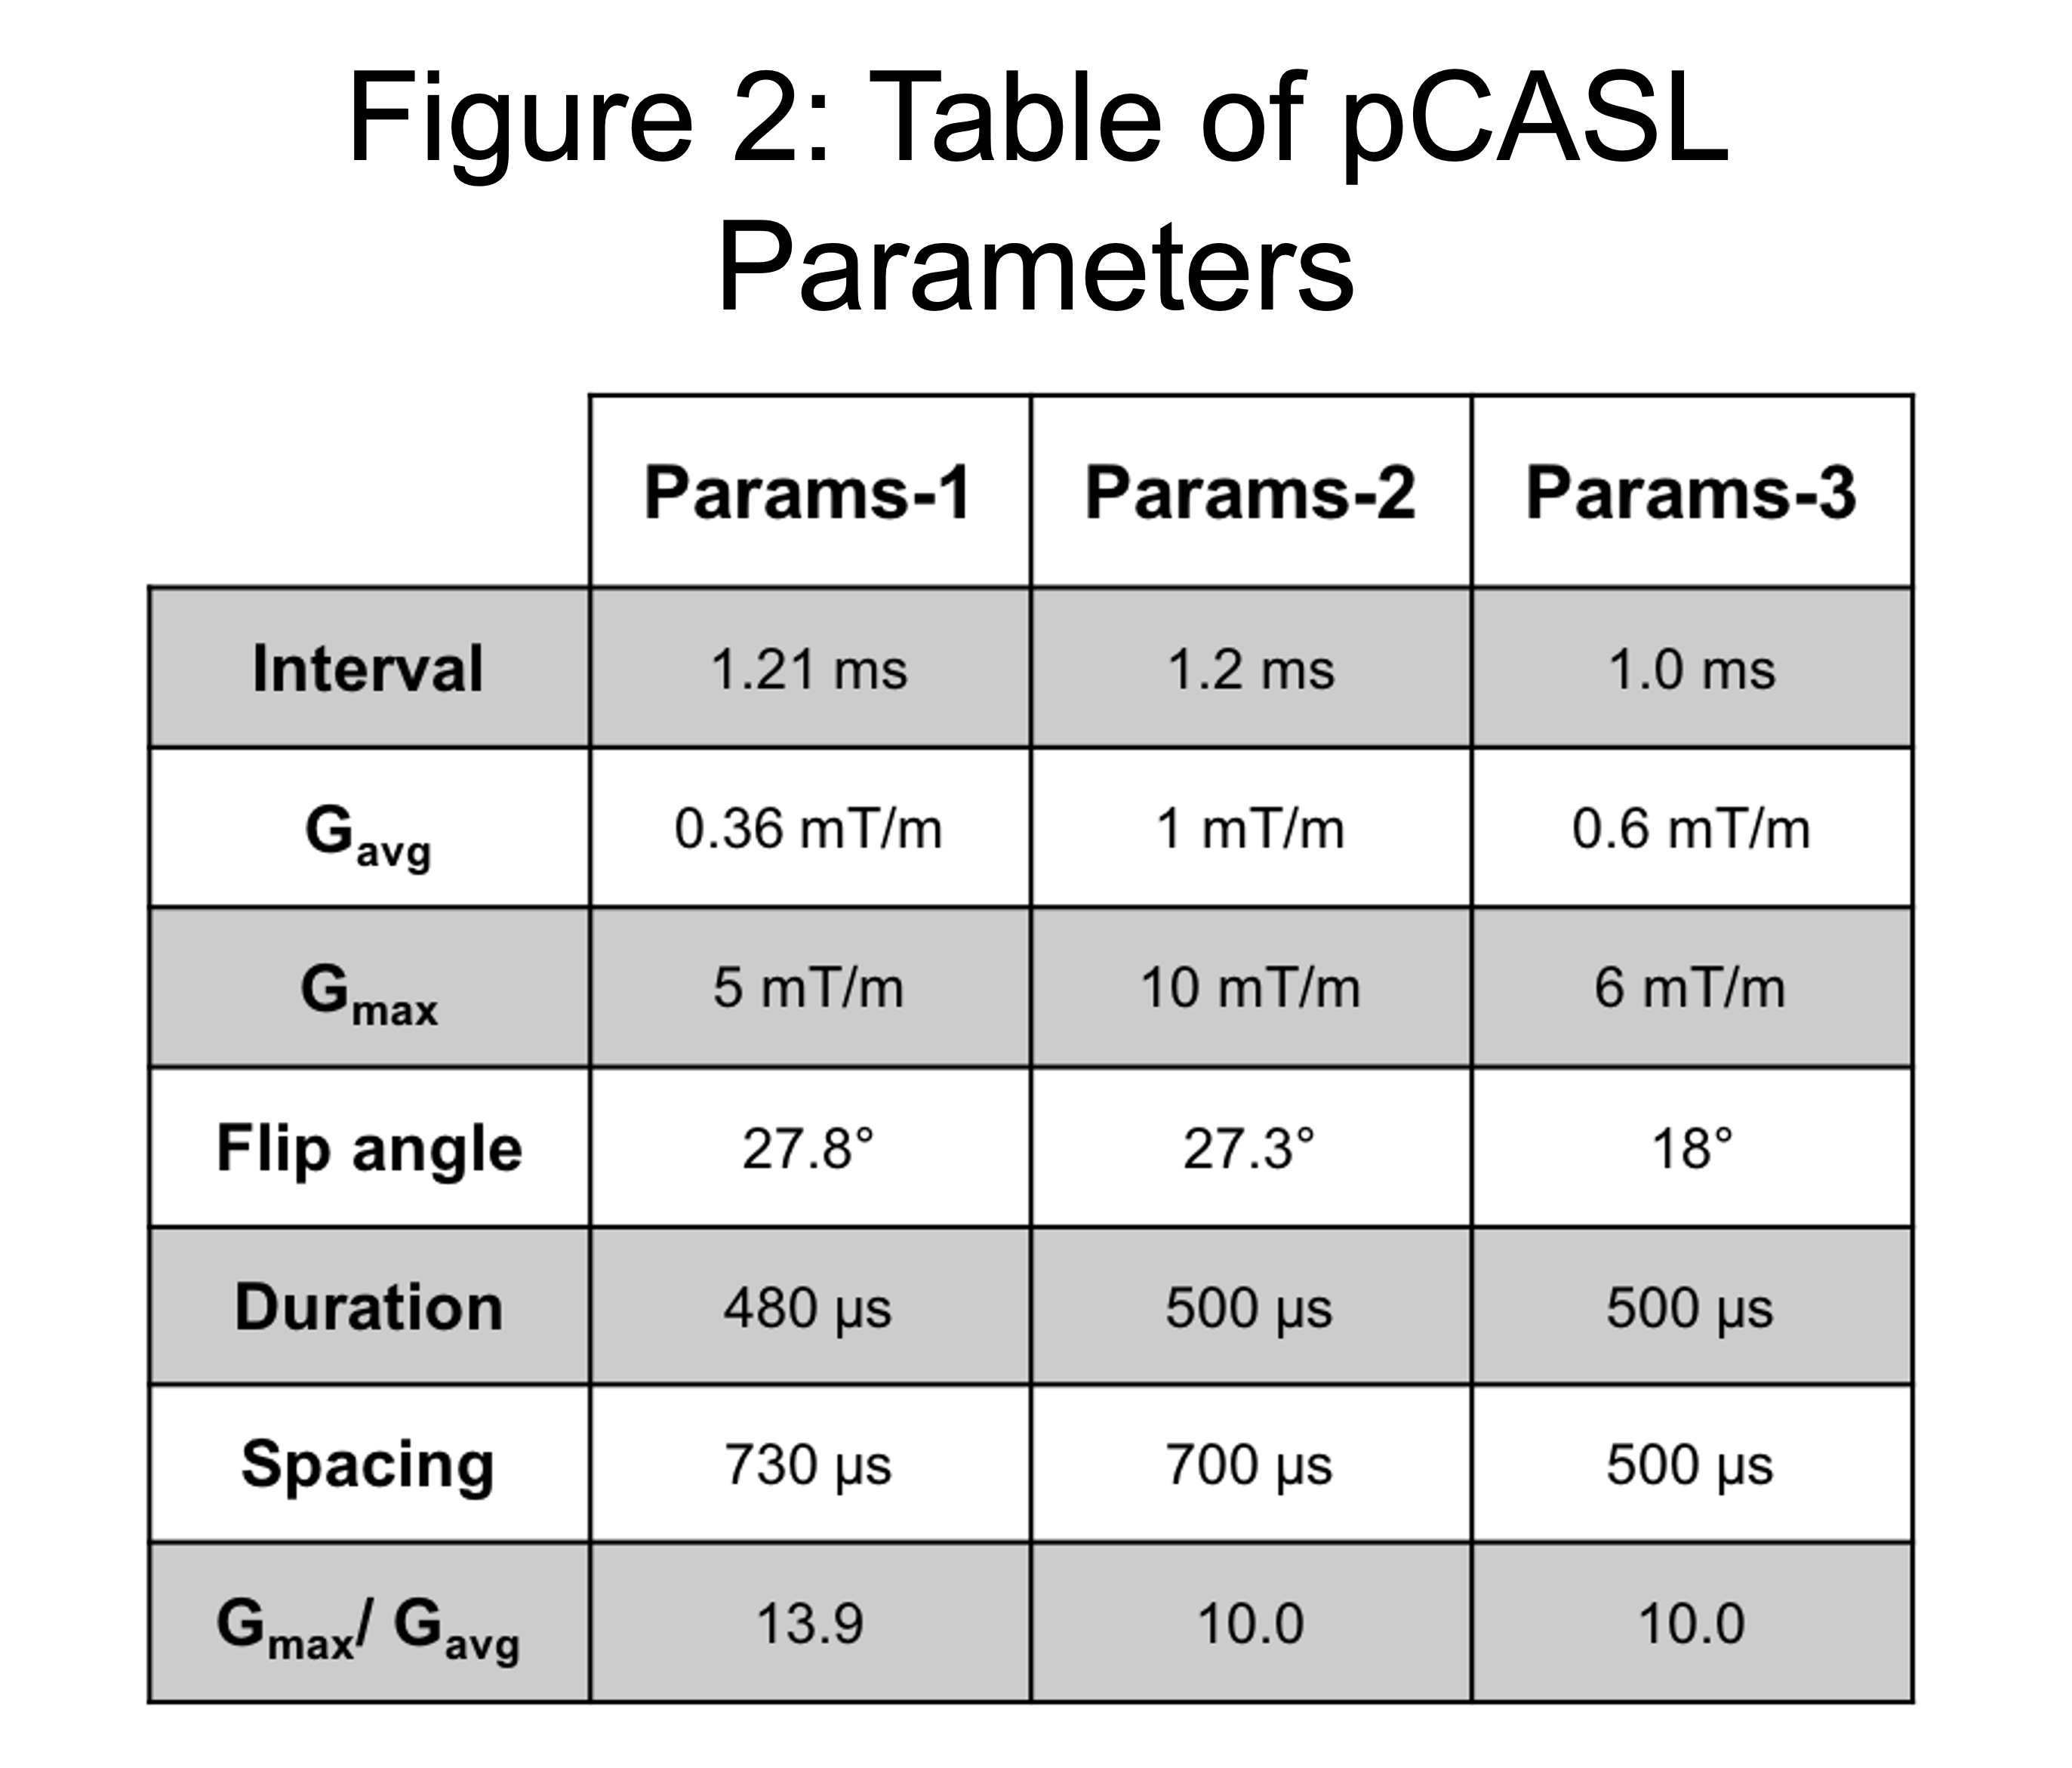
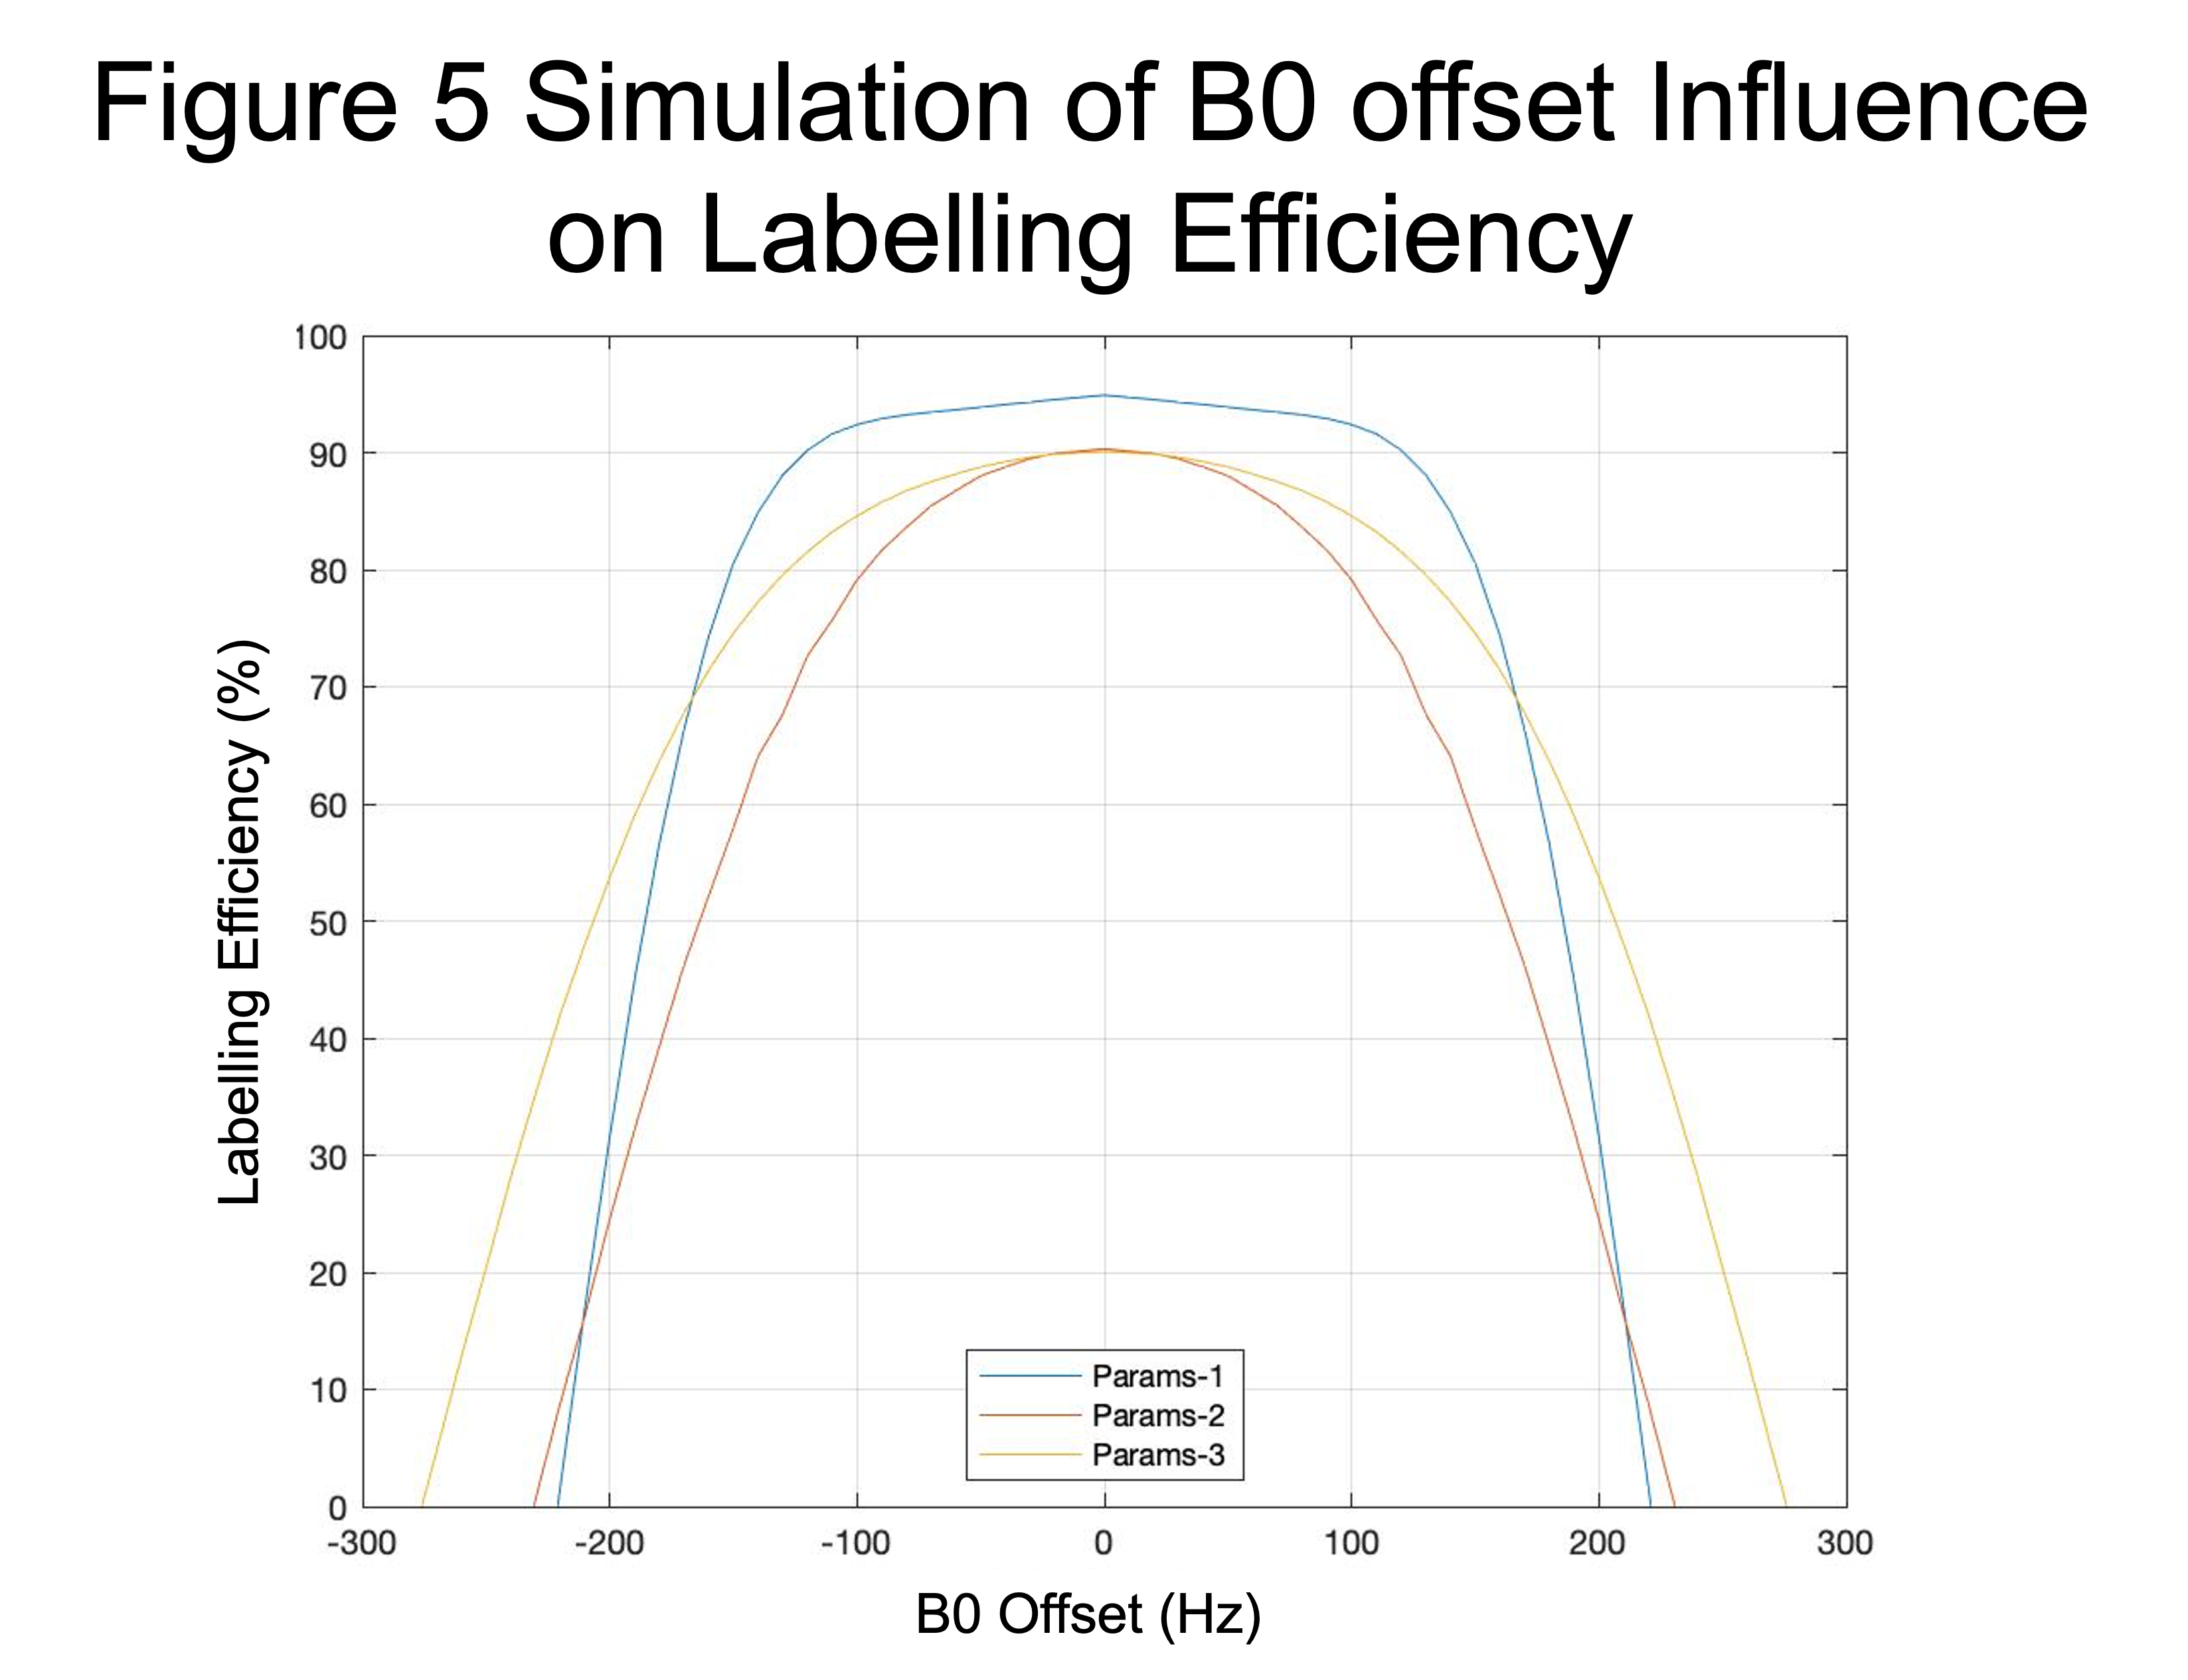
Simulations: Bloch simulations were performed using MATLAB for three common pCASL preparations (Fig. 2) to estimate the labelling efficiency as a function of the B0 offset.
RESULTS
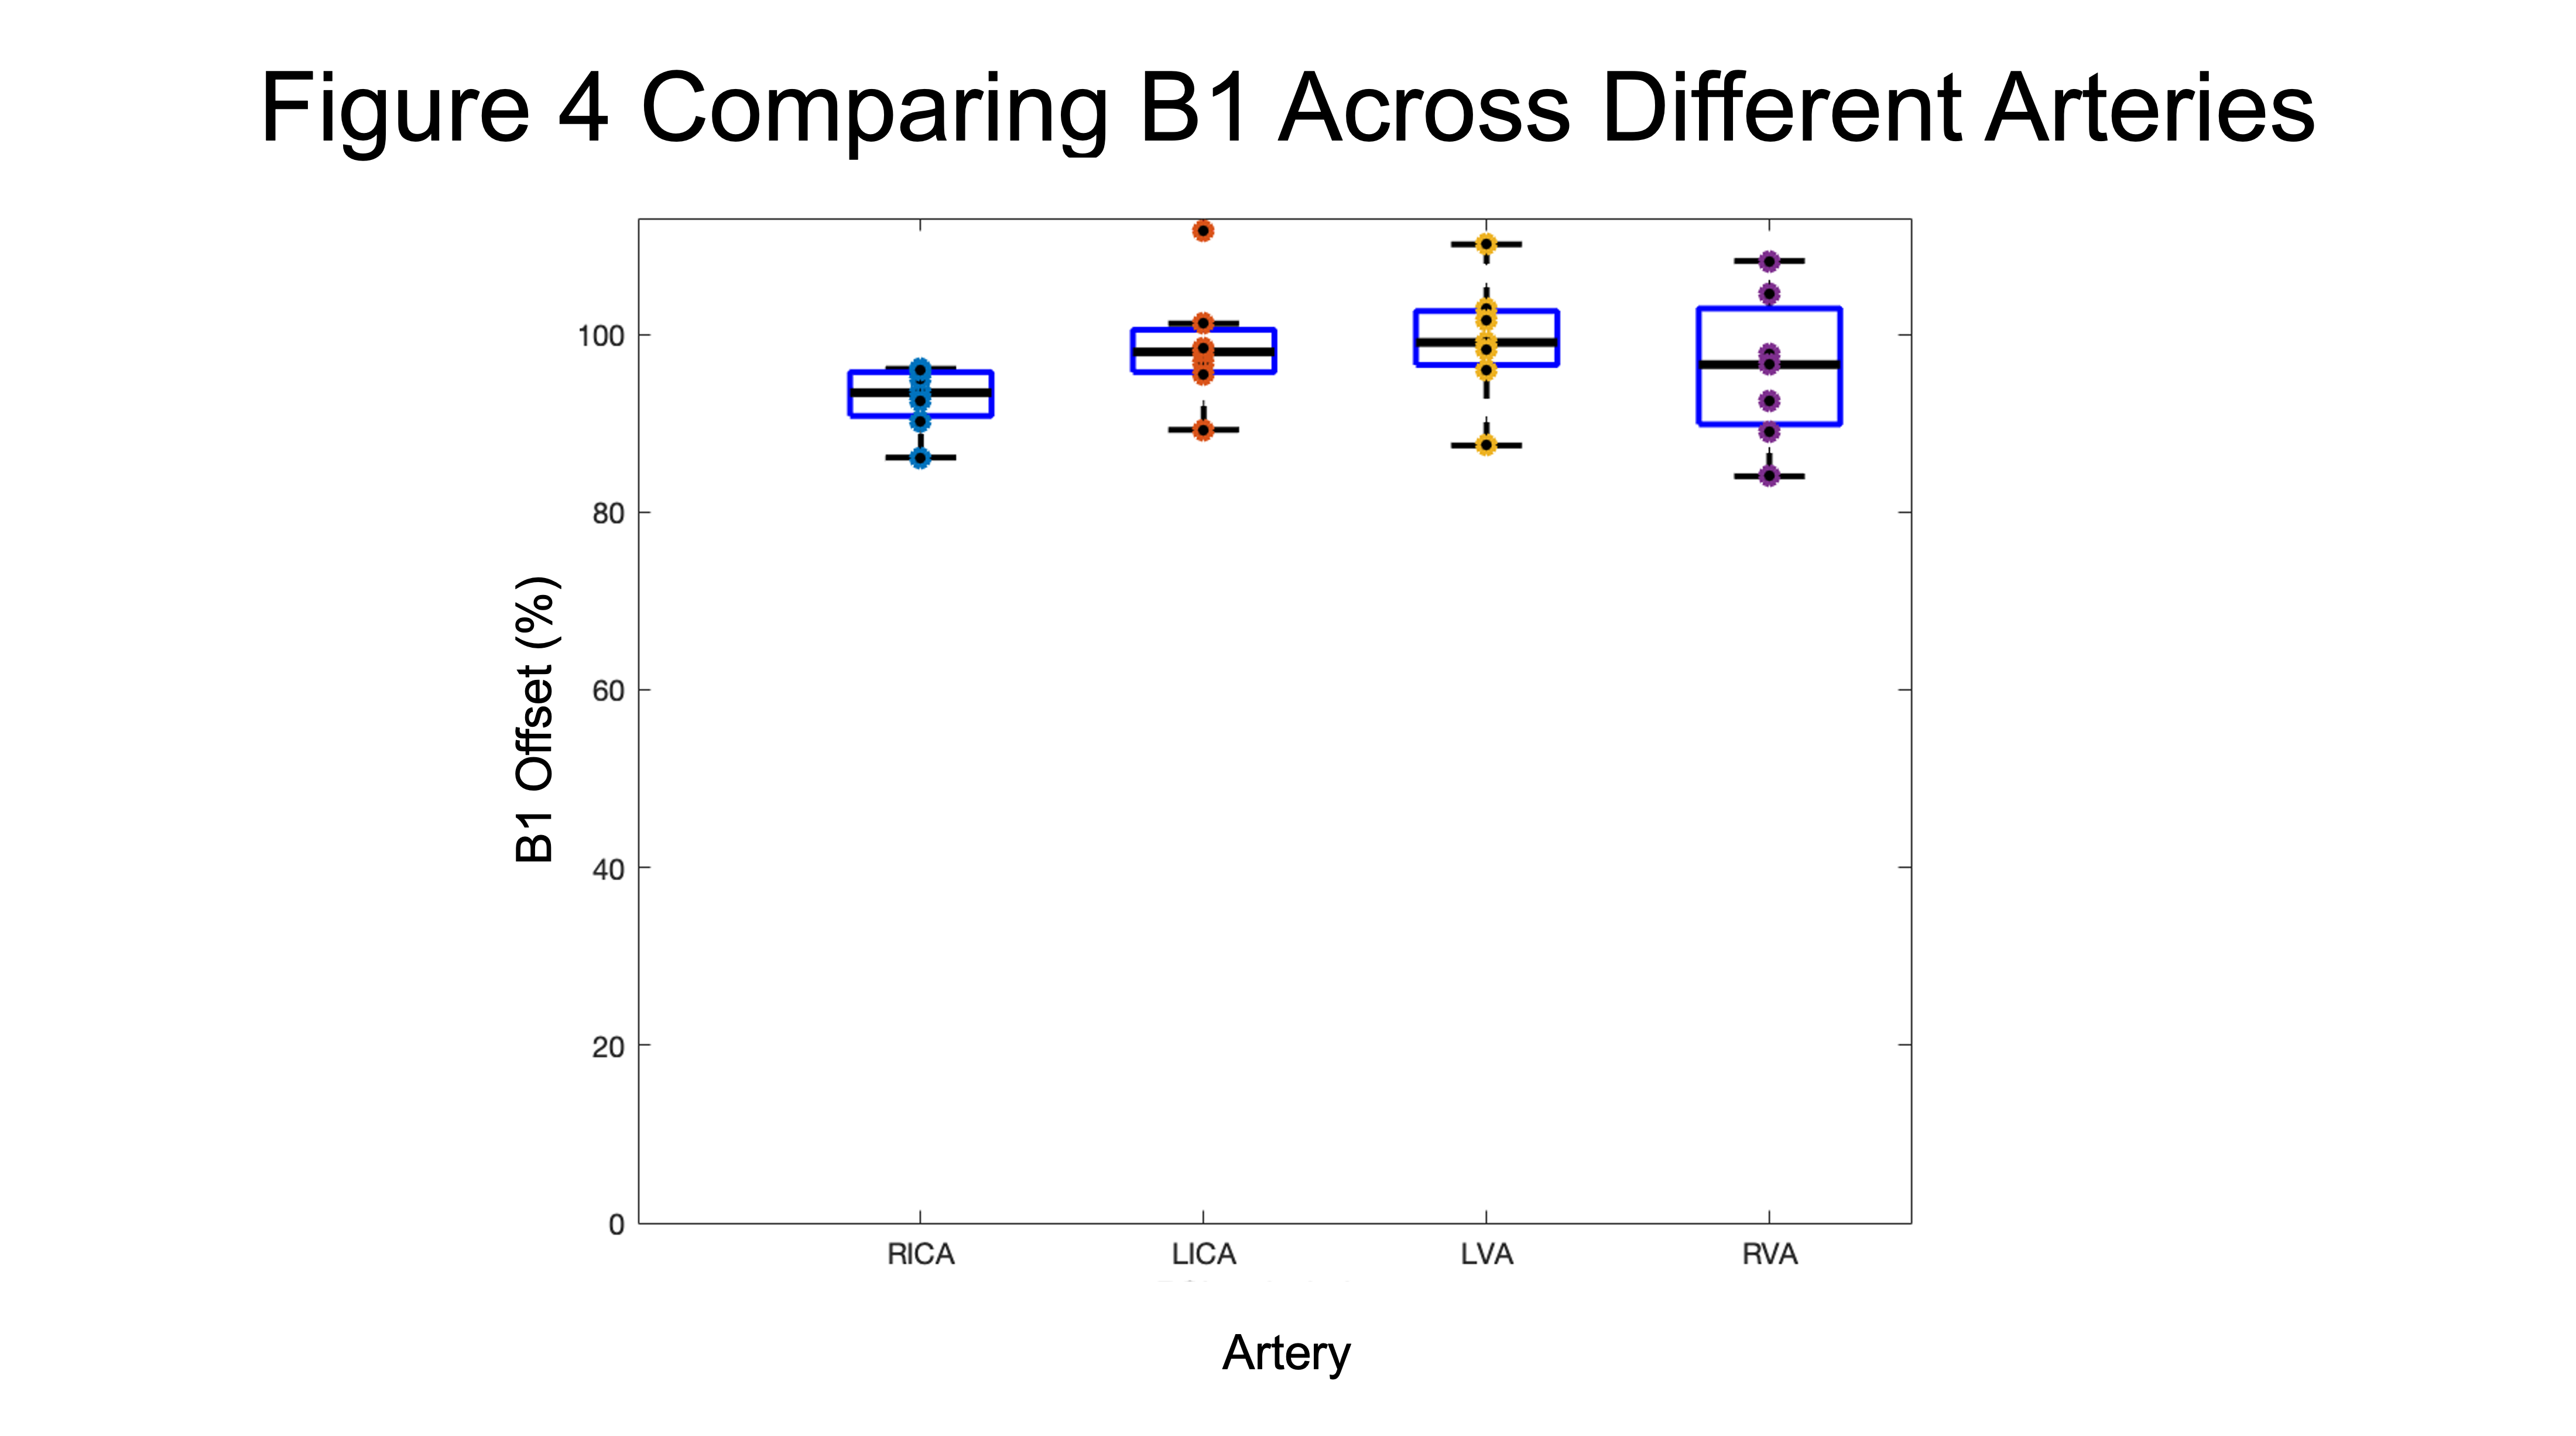
Figure 3 presents the variations in B0 for the four arteries including the absolute B0 offset during normal breathing and hyperventilation (Fig. 3a), the difference between the two conditions (Fig. 3b) and the range of B0 offsets between normal breathing and hyperventilation (Fig. 3c).Figure 4 shows the percentage of the nominal flip angle from the B1 map for the four arteries. The group mean values were RICA=92.8±3.6%, LICA=98.7±6.8%, LVA=99.3±6.9% and RVA=96.1±8.5%.
Figure 5 demonstrates the different profiles of labelling efficiency for the three sets of parameters. Params-1 has a wider plateau but drops off more rapidly than Params-2 and 3.
DISCUSSION
Experiments were performed to further investigate the origin of the variability in pCASL CVR estimates with different preparation parameters. In contrast to previous work, only a small reduction in B1 was observed of ~97% compared with ~83% seen previously[5]. The absolute change in B0 was relatively small although a 30% increase in the range of B0 values was observed. Given the relatively broad peak of the labelling efficiency predicted by simulations (Fig. 5) and the relatively low absolute B0 offset, changes in labelling efficiency are likely to be small for all three sets of pCASL parameters. However, in a pCASL measurement shimming is typically only performed on the imaging stack, which may result in a larger absolute B0 offset at the labelling plane. In which case the range of B0 values may reach the shoulder of the labelling efficiency curve in Fig. 5 resulting in a reduction in labelling efficiency between normal breathing and hyperventilation.Limitations include the relatively low temporal resolution of the B0 mapping, which may underestimate changes in B0 during rapid breathing. Further investigation is required to determine the source of the variation that was seen in the human data but not in simulations.
Acknowledgements
The authors would like to acknowledge funding for this study from the Biotechnology and Bioscience Research Council. Authors would also like to thank the volunteers who participated in this study.References
1. Haller S, Zaharchuk G, Thomas DL, et al. Arterial Spin Labeling Perfusion of the Brain: Emerging Clinical Applications. Radiology. 2016; 281:2
2. Aslop DC, Detre JA, Golay X, et al. Recommended implementation of arterial spin-labeled perfusion MRI for clinical applications: A consensus of the ISMRM perfusion study group and the European consortium for ASL in dementia, Magnetic Resonance in Medicine. 2015; 73(1), 102-106.
3. Aslan S, Xu F, Wang PL, et al. Estimation of labeling efficiency in pseudocontinuous arterial spin labeling, Magn. Reson. Med. 2010; 63(3), 765–771.
4. Vaclavu L, Sokolska M, Nederveen AJ, Thomas DL. Accounting for pCASL labelling efficiency variation in patients with low and high arterial blood flow velocities. Proc. Intl. Soc. Mag. Reson. Med. 2008; 26, #5530.
5. Bush A, Chai Y, Choi SY, Vaclavu L, Holland S, Nederveen A, Coates T, Wood J. Pseudo continuous arterial spin labeling quantification in anemic subjects with hyperemic cerebral blood flow. Magn. Reson. Imaging. 2018;47:137-146.
6. Banzett, RB, Garcia, RT, and Moosavi, SH, Simple contrivance “clamps” end-tidal PCO(2) and PO(2) despite rapid changes in ventilation. Journal of Applied Physiology: Respiratory, Environmental and Exercise Physiology. 2000;88:5: 1597–1600.
7. Blockley, NP, Driver, ID, Francis, ST, et al. An improved method for acquiring cerebrovascular reactivity maps. Magn. Reson. Med. 2011;65, 1278–1286.
8. McCarthy P. FSLeyes. Zenodo. 2022; https://doi.org/10.5281/zenodo.7038115
9. Zhang, Y, Brady, M & Smith, S. Segmentation of brain MR images through a hidden Markov random field model and the expectation- maximization algorithm. IEEE Trans Med Imag. 2001;20(1):45-57.
Figures