2749
Fast, isotropic, whole head perfusion imaging using a Spin Echo Rotating In-Out Spiral with velocity selective arterial spin labeling
David Joseph Frey1, Jeffrey A. Fessler2, Douglas C. Noll1, and Luis Hernandez-Garcia1
1Radiology, University of Michigan, Ann Arbor, MI, United States, 2Electrical Engineering and Computer Science, University of Michigan, Ann Arbor, MI, United States
1Radiology, University of Michigan, Ann Arbor, MI, United States, 2Electrical Engineering and Computer Science, University of Michigan, Ann Arbor, MI, United States
Synopsis
Keywords: Arterial spin labelling, New Trajectories & Spatial Encoding Methods
We investigate the performance of a new and efficient k-space sampling scheme that presents several advantages for velocity selective ASL imaging by rotating 2D spirals about the kx and ky axis. This paper compares the new readout to a traditional Stack-of-spirals readout by evaluating SNR for perfusion weighted images and the accuracy of z-scores for ASL FMRI experiments.Introduction
Perfusion weighted imaging using arterial spin labeling (ASL) can be used to map brain function. Although perfusion FMRI has important advantages over the more commonly used BOLD weighted images, such as greater intersubject stability and specificity to the parenchyma rather than draining veins, it is hampered by lower SNR and temporal resolution(1). This work presents a new ASL sequence leveraging velocity selective labeling pulses followed by a spherical k-space fast spin echo readout, referred to as Spin Echo Refocused In-out Spiral (SERIOS), which allows efficient coverage of k-space in a single echo train (~800 ms). We hypothesize that this readout presents several advantages over the commonly used Stack-Of-Spirals (SOS) fast spin echo readout, including oversampling the center of k-space, and reduced blurring along the z axis due to isometric voxel sizes.Methods
Pulse sequence design: Velocity selective ASL (VSASL) pulse sequences were designed with both SERIOS and SOS readout schemes. Fourier Transform Velocity Selective Inversion (FT-VSI) pulses(2,4) were used for labeling and eight-segment B1 insensitive rotation with symmetric radio frequency and gradient layouts (sym-BIR-8) pulses(3,4) were used for suppression of arteries. Both acquisition trajectories were designed with the same 2D spiral on the kx-ky plane. The spiral was then rotated about the kx and ky axes in the case of SERIOS trajectories for each slice (as shown in Figure 1), rather than being translated along the kz axis such as in the case of SOS trajectories. In the case of multi-shot imaging, the number of turns in the spiral was reduced by the number of shots, while the number of rotated (or translated in the SOS case) spirals was increased by the same factor.Image Reconstruction: Data was reconstructed using an iterative density compensated NUFFT reconstruction(5,6,7). Sensitivity maps were estimated from multi-shot images using ESPIRiT(8) and used to combine coil images for coil combination.
The following experiments were performed twice using both the SOS and SERIOS acquisition schemes to compare their performance and test-retest reproducibility.
Baseline CBF: A time series of four-shot images was collected while the participant was at rest. Temporal and spatial signal-to-noise ratios (tSNR, sSNR) per voxel volume were calculated from CBF time series using Equations 1 & 2.
FMRI experiments: FMRI data was collected on 4 healthy, right-handed adult subjects using a GE MR750 3T scanner. Subjects were asked to tap their fingers on their right hand sequentially whenever receiving a visual stimulus while a time series of single shot images were collected. Images in the time series were surround-subtracted(9) to preserve temporal resolution. Z-scores for FMRI activation were also calculated from single shot FMRI CBF time series using general least squares with baseline and stimulus response regressors. Ellipsoidal region of interest (ROI) masks were manually fit to each subject’s motor and visual cortex. Mean and standard deviation of z-scores within each ROI were calculated for each subject and compared between the SOS and SERIOS trajectories. The Bland-Altman method for repeatability(10) was used to calculate repeatability coefficients of z-scores between iterations of SERIOS and SOS FMRI data for all subjects, as shown in Equation 3.
Results
Table 1 shows calculated SNR per voxel volume values, ROI activation z-scores, and z-score repeatability coefficients. Figure 2 shows example multi-shot and single shot CBF images, as well as multi-shot spin density (M0) images with overlaid activation z-scores for each trajectory. Figure 3 shows Bland-Altman plots. SERIOS CBF time series exhibit higher mean and lower variance of SNR per voxel volume due to reduced blurring along the z axis. SERIOS CBF images also appear to have much finer detail along the z axis. SERIOS activation z-scores exhibit lower activation but also less variance in the regions of interest than SOS activation z-scores. The Bland-Altman repeatability coefficient is slightly higher in the SERIOS case than the SOS case, but the Bland-Altman plot for SOS shows more unexpected coherence than the SERIOS Bland-Altman plot.Discussion
The SERIOS readout scheme allows for 3D isotropic sampling of the whole brain during the passage of a single labeling bolus. Our preliminary data suggest that this approach can outperform stack of spirals readouts in terms of voxel isotropy, image quality and stability. These advantages can be beneficial for functional imaging as well as MR fingerprinting applications. SERIOS data presents slightly less test-retest reliably based on the Bland-Altman repeatability coefficients, but we suspect there may be some systematic error in repeatability for SOS data due to the unexpected coherence in the Bland-Altman plot.Acknowledgements
This work is supported NIH grant R01 NS 112233References
- Aguirre GK, et Al. (2002) Experimental design and the relative sensitivity of BOLD and perfusion fMRI. Neuroimage 15:488–500, 2002. https://doi.org/10.1006/nimg.2001.0990.
- Qin, Q, et Al. (2019) Cerebral blood volume mapping using Fourier-transform–based velocity-selective saturation pulse trains. Magn Reson Med 81:3544–3554. https://doi.org/10.1002/mrm.27668
- Guo, J, et Al. (2014), An optimized design to reduce eddy current sensitivity in velocity-selective arterial spin labeling using symmetric BIR-8 pulses. Magn Reson Med 73:1085–1094, 2015. https://doi.org/10.1002/mrm.25227
- Qin, Q, et. Al. (2022), Velocity-selective arterial spin labeling perfusion MRI: A review of the state of the art and recommendations for clinical implementation. Magn Reson Med 88:1528–1547, 2022. https://doi.org/10.1002/mrm.29371
- Fessler, JA, et Al. (2003), Nonuniform fast Fourier transforms using min-max interpolation. IEEE Transactions on Signal Processing 51:560–574, 2003. https://doi.org/10.1109/TSP.2002.807005.
- Pipe, JG, et Al. (1999), Sampling density compensation in MRI: rationale and an iterative numerical solution. Magn Reson Med 41:179–186, 1999. https://doi.org/10.1002/(sici)1522-2594(199901)41:1%3C179::aid-mrm25%3E3.0.co;2-v
- Fessler, JA, et Al. Michigan Image Reconstruction Toolbox https://github.com/JeffFessler/mirt, downloaded 2022.
- Uecker, M, et Al. (2013), ESPIRiT—an eigenvalue approach to autocalibrating parallel MRI: Where SENSE meets GRAPPA. Magn Reson Med 71:990–1001, 2014. https://doi.org/10.1002/mrm.24751
- Wong, EC, et Al. (1997), Implementation of quantitative perfusion imaging techniques for functional brain mapping using pulsed arterial spin labeling. NMR Biomed 10:237–249, 1997. https://doi.org/10.1002/(sici)1099-1492(199706/08)10:4/5%3C237::aid-nbm475%3E3.0.co;2-x
- Bland, et Al. (1986), Statistical methods for assessing agreement between two methods of clinical measurement, Lancet 327:307-310, 1986. https://doi.org/10.1016/S0140-6736(86)90837-8
Figures
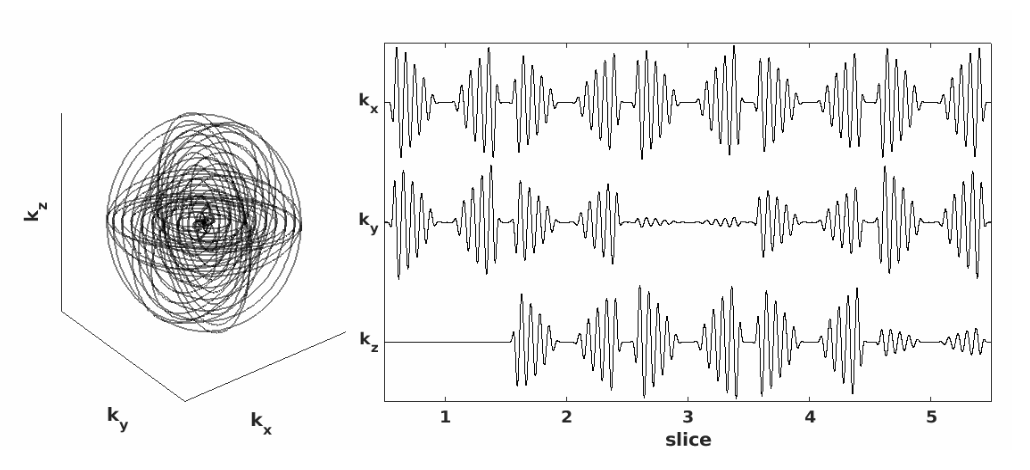
Figure 1: 3D plot of five-slice SERIOS readout trajectory (left) and plot of corresponding vector components (right)
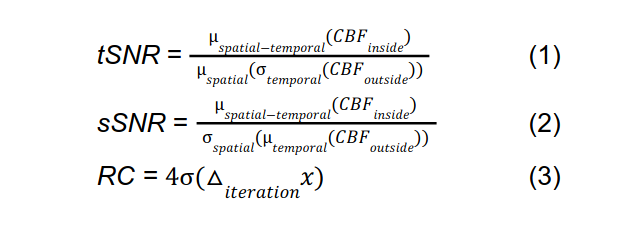
Equations 1-3: Calculation of tSNR, sSNR, and RC, where CBF = cerebral blood flow image, μ(x) = mean of x, σ(x) = standard deviation of x
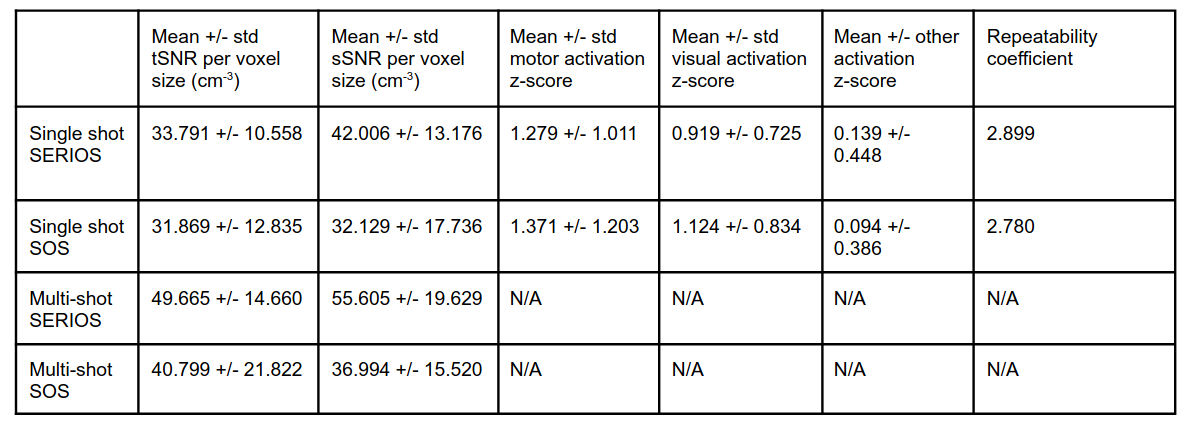
Table 1: Result statistics for collected data; multi-shot data does not have z-score calculations since no FMRI was performed with multi-shot readouts
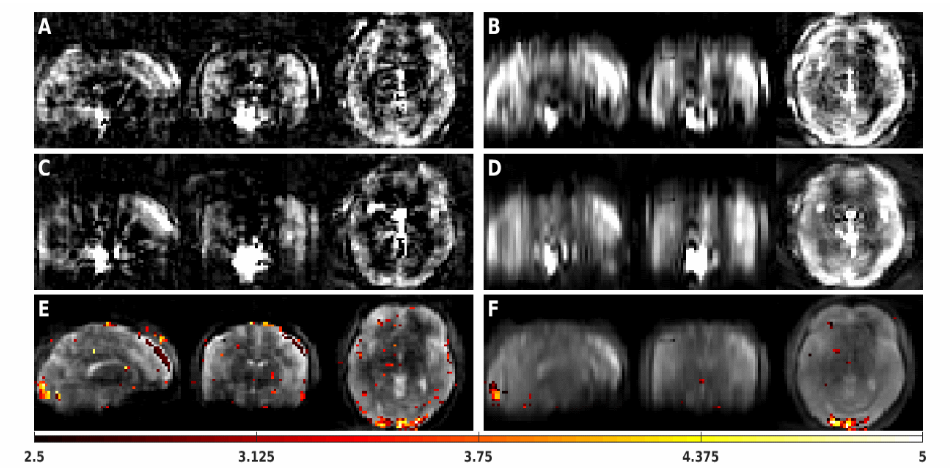
Figure 2: Perfusion weighted images obtained with (A) four shot SERIOS, (B) four shot SOS, (C) single shot SERIOS, (D) single shot SOS; and FMRI activation z-scores overlayed onto four shot spin density images obtained with (E) SERIOS and (F) SOS. Slices were selected to show visual cortex activation. Z-scores are thresholded to the range [2.5 5]
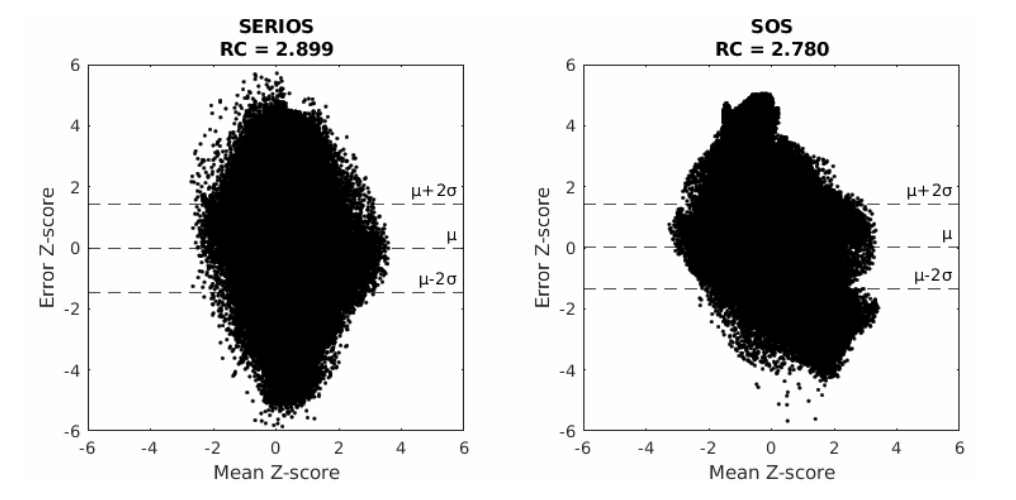
Figure 3: Bland-Altman plots of z-scores for SERIOS (left) and SOS (right), showing mean against difference between trials across all subjects and voxels. SOS data has some unexpected coherence based on its shape.
DOI: https://doi.org/10.58530/2023/2749