2747
Towards Look-Locker encoding as an arterial spin labeling mechanism: T1/B1+/perfusion mapping with MR Multitasking1Biomedical Imaging Research Institute, Cedars-Sinai Medical Center, Los Angeles, CA, United States, 2Bioengineering, University of California, Los Angeles, Los Angeles, CA, United States, 3Siemens Medical Solutions, Los Angeles, CA, United States
Synopsis
Keywords: Arterial spin labelling, Arterial spin labelling, multitasking, Look-Locker, B1+, spin history, T1, blood, brain, IR-FLASH, inversion efficiency, white matter, gray matter
We hypothesized that the Look-Locker (LL) effect can label arterial spins without the need for subtraction between different inversion schemes. We developed a multiple-flip-angle, non-selective-inversion MR multitasking brain scan to produce co-registered T1, B1+, and perfusion-weighted maps. Flow-sensitive LL fitting homogenized B1+ maps and produced flow maps combining features of time-of-flight angiography images and PCASL perfusion-weighted images. GM/WM flow ratios were similar to PCASL and the literature range.Introduction
T1 quantification can help clinicians diagnose, treat, and assess response to treatments in various diseases. Look-Locker (LL) acquisition allows fast T1 mapping, but reliable interpretation of T1 requires accurately assessing the confounder of effective transmit magnetic field (B1+), especially at higher field strengths. Complementary to T1, blood flow assessment can also help clinicians, and increasingly, flow quantification is sought after. Arterial spin labeling (ASL) methods extract perfusion information, typically by isolating the different effects of flow on apparent T1 stemming from different inversion schemes. Several ASL methods use LL sequences for speed [1-3] also introducing interactions with B1+ inhomogeneity. Interactions between T1, flow, and B1+ in LL T1 mapping sequences thus deserve attention: not only to attempt mitigating the undesirable influence of each parameter on measuring the other, but also to explore extracting clinically useful information from the interactions. Previous work on LL T1-B1+ mapping [4,5] did not directly map B1+, but rather a spin history map $$$\beta$$$ reflecting B1+ modulated by the ‘residence time’ of the constituent spins in the excitation slice. We previously hypothesized that through-slice flow would reduce $$$\beta$$$ due to fewer excitations of flowing spins [4], in which case the LL effect may itself be labeling arterial spins without the need for subtraction between different inversion schemes. Here we explore differentiating $$$\beta$$$ into separate B1+ and flow components, a step toward high-resolution simultaneous T1, ASL, and B1+ mapping.Methods
Signal ModelWe modeled flow-sensitive, non-selective inversion-recovery (IR)-FLASH z-magnetization (M) evolution with alternating flip angles, starting from the flow-modified Bloch equations [6-8]. We obtained a closed-form analytical expression for M, with fit parameters inversion efficiency, equilibrium magnetization M0, flow (F), T1, and B1+ efficiency factor. With perfect inversion efficiency and absent FLASH readouts, in the limit of infinitesimal increments, M approaches that in Eq. 8 of [8]. When flow is excluded from our model, M approaches Mz in Eq. 5 of [9].
Experiments
On a Siemens VIDA 3T scanner, we scanned n=5 healthy consented (Cedars-Sinai IRB protocol) volunteers once each with three flip angle (3FA) multitasking (MT) (a 3FA extension of [4]), pseudo-continuous arterial spin labeling (PCASL) [11], time of flight (TOF) angiography, and reference B1+ mapping sequences, summarized in Figure 1. Time did not allow gold standard IR spin echo or IR turbo spin echo T1 mapping.
Fitting and analysis
We fit the MT signal curves twice: once without flow, fitting for T1, flow-sensitive apparent B1+ [β], inversion efficiency, and M0; and once for T1, B1+, inversion efficiency, M0, and flow F. To determine the effects of fitting for flow on T1 and apparent B1+, we calculated Pearson correlation of the flow maps to the change in T1 and B1+ between fits with and without flow. We evaluated the flow maps by calculating the intensity ratio between gray matter (GM) and white matter (WM) regions of interest (ROIs) of PCASL flow-weighted results and MT flows, comparing mean values with paired t-tests.
Results and Discussion
As seen in Figure 2, lower-intensity features in MT spin history $$$\beta$$$ maps fit without flow (B) become less conspicuous in MT B1+ maps fit with flow (E). MT flow-weighted maps (F) have some features co-registered with blood vessels in TOF maximum intensity projection (MIP) images (C) and some with high-perfusion, presumably gray matter, features in PCASL images (I). The map F appears to carry information about both arterial and perfusion flow.Mean±SD T1 values before and after fitting for flow were, respectively 1536±72 ms and 1491±69 ms for GM and 972±34 ms and 951±32 ms for WM. The impact of flow fitting on both T1 values and apparent B1+ (B1+ vs. $$$\beta$$$) are quantified in Figures 3 and 4. Fitting for flow impacted both maps, but the change in apparent B1+ was more correlated to flow maps (ρ=0.81) than was the change in T1 (ρ=–0.32). Between MT and PCASL scan results, a 2-tailed paired t-test of the mean GM/WM pixel intensity ratios of the 5 subjects returned a value of 0.06. Population mean ± standard deviation for the ratios were 2.93 ± 0.38 for PCASL and 2.38 ± 0.31 for MT (Figure 5), both in the range of literature values [12-14].
Conclusions
Blood flow is in-part encoded in a voxel’s history of exposure to the Look–Locker effect. Separating spin history into B1+ and flow terms homogenizes B1+ maps and produces flow maps combining features of TOF angiography images and PCASL perfusion-weighted images. GM/WM flow ratios were similar to PCASL and the literature range. This new approach to ASL may be a starting point for a higher-resolution, subtraction-free perfusion imaging method which also produces co-registered T1 and B1+ maps.Acknowledgements
The authors acknowledge with gratitude the support of Cedars-Sinai Medical Center Research Imaging Core staff, and in particular Ms. Irene Lee, MRI Technologist, for adding TOF angiography to the protocol. This work was supported by the National Institutes of Health grant nos. R01 EB028146 and R01 HL156818.References
References
1. Günther M, Bock M, and Schad LR. Arterial spin labeling in combination with a look-locker sampling strategy: inflow turbo-sampling EPI-FAIR (ITS-FAIR). Magn Reson Med. 2001 Nov; 46(5):974-84. https://doi.org/10.1002/mrm
2. Keith GA, Rodgers CT, Chappell MA, Matthew D. Robson MD. A look‐locker acquisition scheme for quantitative myocardial perfusion imaging with FAIR arterial spin labeling in humans at 3 tesla. Magn Reson Med. 2017 Aug; 78(2): 541–549. https://doi.org/10.1002/mrm.26388
3. Zhang K, Yun SD, 1 and Shah NJ. Tripled Readout Slices in Multi Time-Point pCASL Using Multiband Look-Locker EPI. PLoS One. 2015; 10(11): e0141108. https://doi.org/10.1371/journal.pone.0141108
4. Serry FM, Ma S, Mao X, Han F, Xie Y, Han H, Li D, Christodoulou AG. Dual flip-angle IR-FLASH with spin history mapping for B1+ corrected T1 mapping: Application to T1 cardiovascular magnetic resonance multitasking. Magn Reson Med. 2021 Dec; 86(6):3182-3191. https://doi.org/10.1002/mrm.28935
5. Zhou R, Weller DS, Yang Y, Wang J, Jeelani H, Mugler III JP, and Salerno M. Dual excitation flip angle simultaneous Cine And T1 mapping using SPiral Acquisition with Respiratory and Cardiac Self-gating (CAT-SPARCS). Magn Reson Med. 2021 Jul; 86(1): 82–96. https://doi.org/10.1002/mrm.28675
6. Detre JA, Leigh JS, Williams DS, Koretsky AP. Perfusion imaging. Magn Reson Med. 1992 Jan; 23(1):37-45. https://doi.org/10.1002/mrm.1910230106
7. Williams DS, Detre JA, Leigh JS, Koretsky AP. Magnetic resonance imaging of perfusion using spin inversion of arterial water. Proc Natl Acad Sci USA. 1992 Jan 1; 89(1):212-6. https://doi.org/10.1073/pnas.89.1.212
8. Schwarzbauer C, Morrissey SP, Haase A. Quantitative magnetic resonance imaging of perfusion using magnetic labeling of water proton spins within the detection slice. Magn Reson Med. 1996 Apr; 35(4):540-6. https://doi.org/10.1002/mrm.1910350413
9. Lauzon ML. A Beginner's Guide to Bloch Equation Simulations of Magnetic Resonance Imaging Sequences. https://doi.org/10.48550/arXiv.2009.02789
10. Alsop DC, Detre JA, Golay X, Günther M, Hendrikse J, Hernandez-Garcia L, et al. Recommended implementation of arterial spin-labeled perfusion MRI for clinical applications: A consensus of the ISMRM perfusion study group and the European consortium for ASL in dementia. Magn Reson Med. 2015 Jan; 73(1):102-16. arXiv:2009.02789, https://doi.org/10.1002/mrm.25197
11. Wu W-C, Lin S-C, Wang DJ, Chen K-L, and Li Y-D. Measurement of cerebral white matter perfusion using pseudocontinuous arterial spin labeling 3T magnetic resonance imaging--an experimental and theoretical investigation of feasibility. PLoS One. 2013 Dec 6; 8(12):e82679. https://doi.org/10.1371/journal.pone.0082679
12. Schidlowski M, Stirnberg R, Stöcker T, and Rüber T. Reliability of quantitative transverse relaxation time mapping with T2‑prepared whole brain pCASL. Scientifc Reports | (2020) 10:18299 | https://doi.org/10.1038/s41598-020-74680-y
13. Parkes LM, Rashid W, Chard WT, and Tofts PS. Normal Cerebral Perfusion Measurements Using Arterial Spin Labeling: Reproducibility, Stability, and Age and Gender Effects. Magn Reson Med. 2004 Apr; 51(4):736-43. https://doi.org/10.1002/mrm.20023
Figures
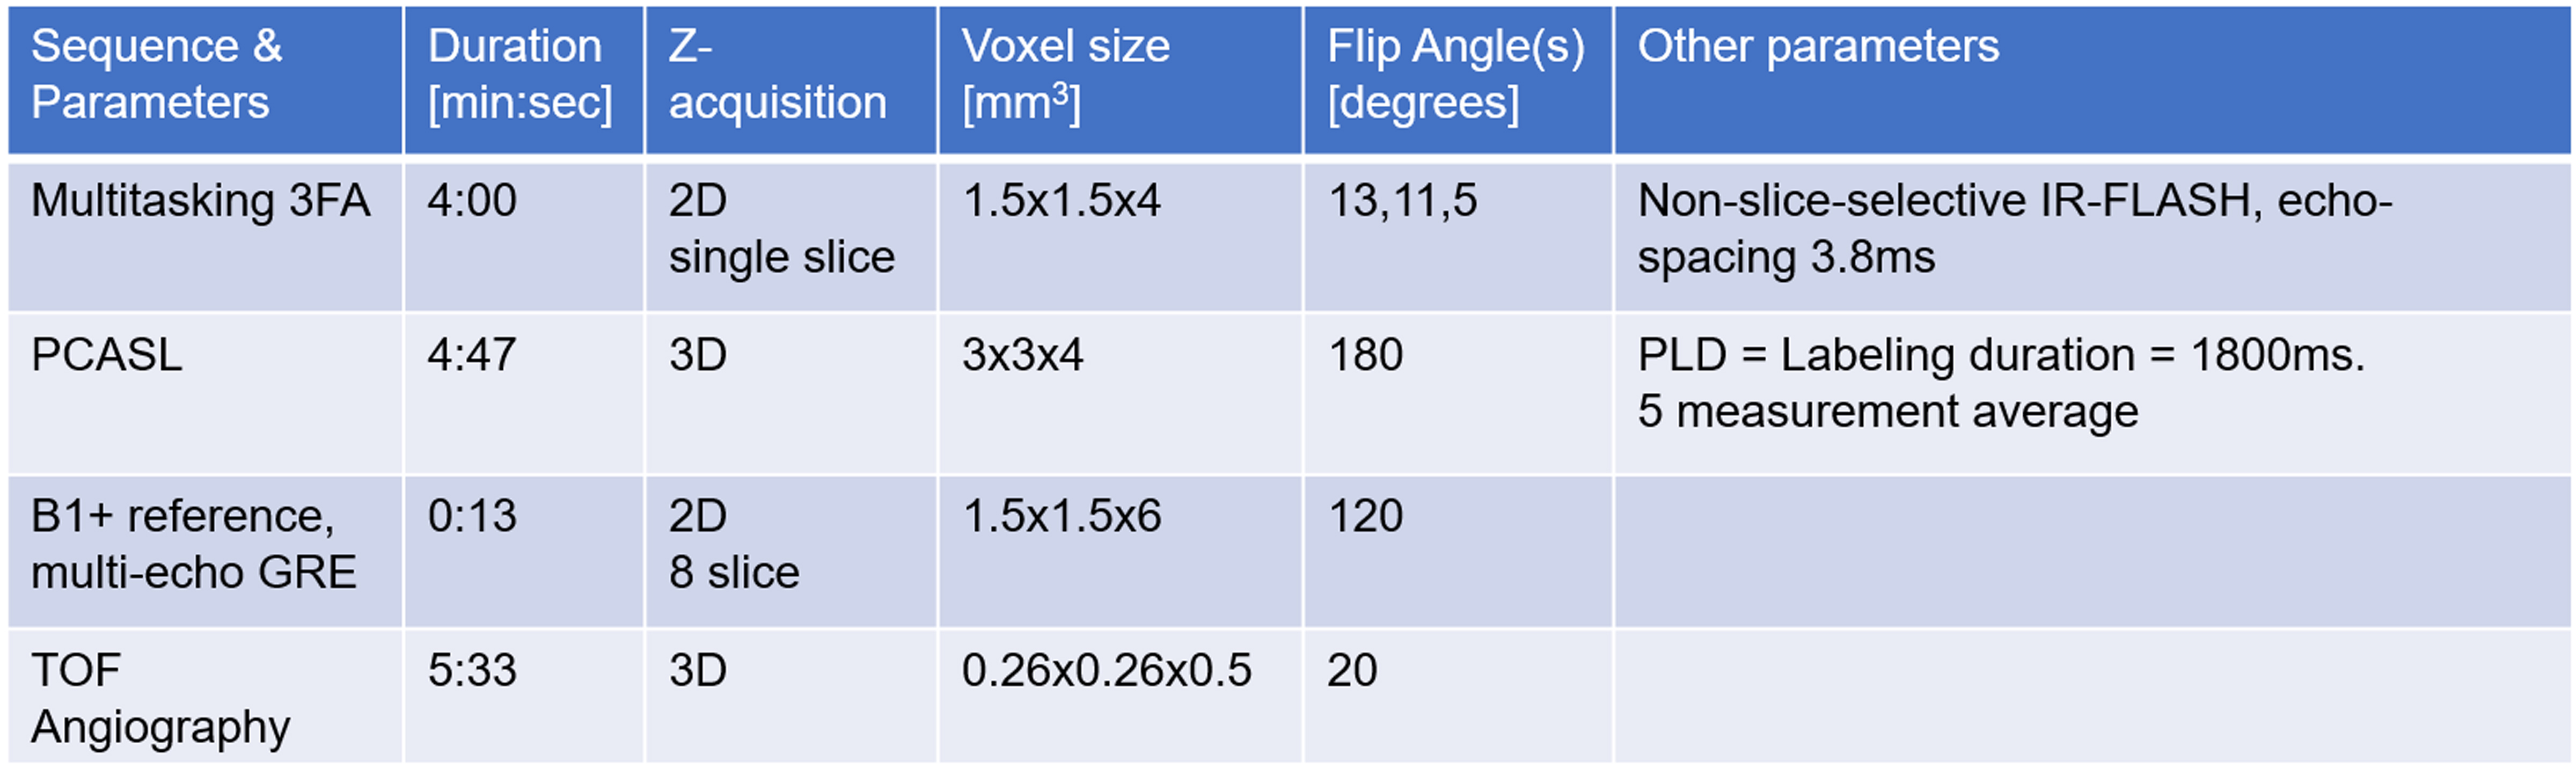
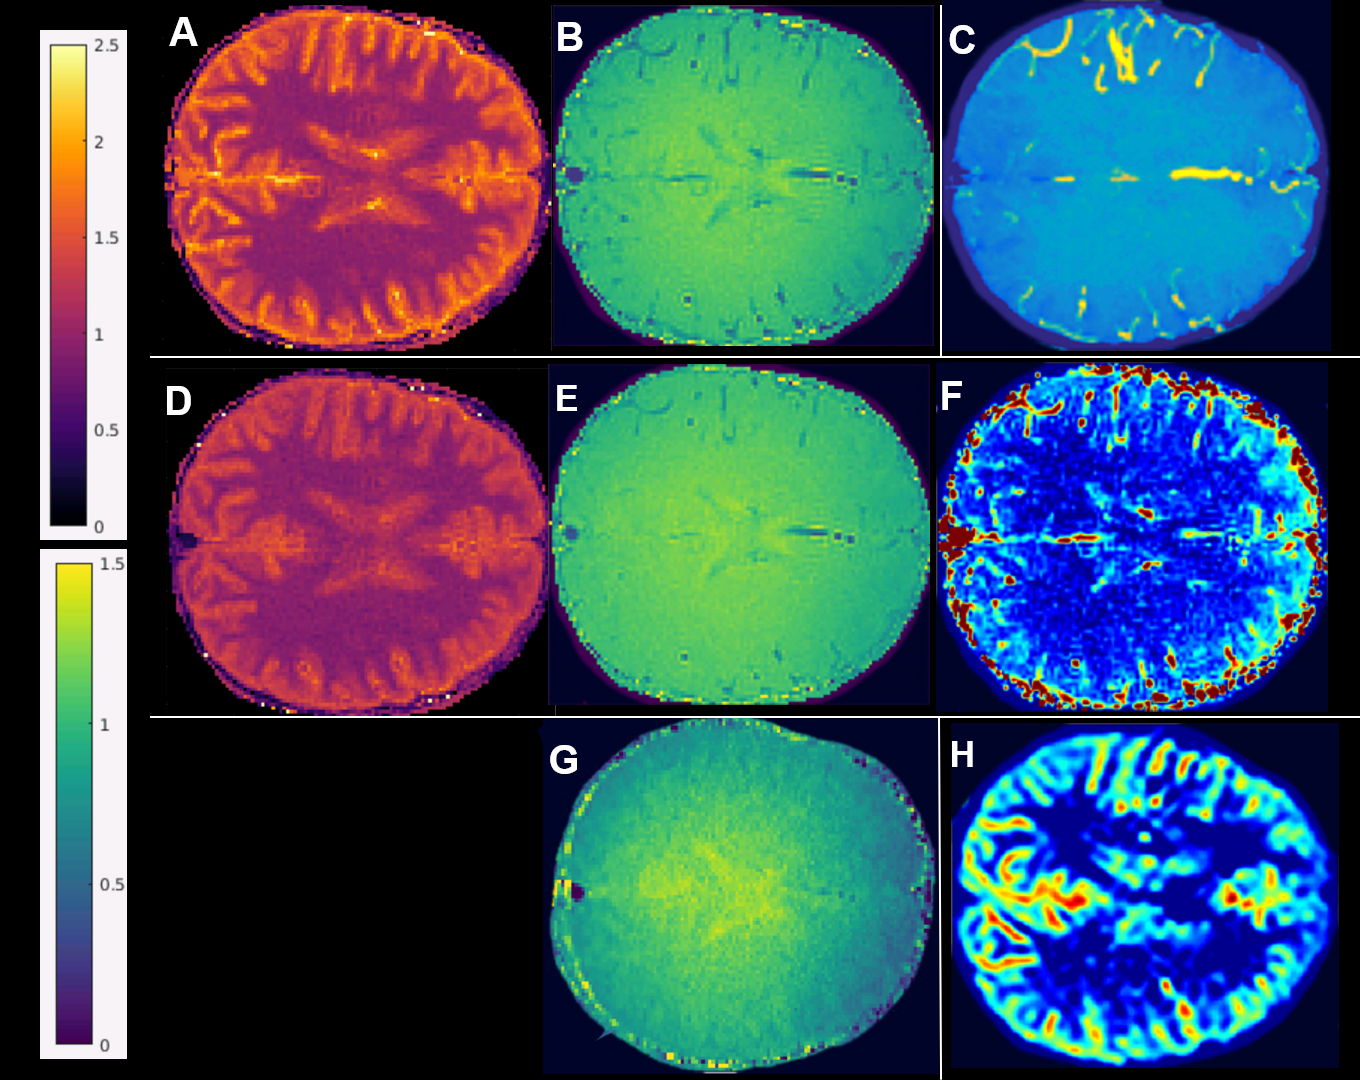
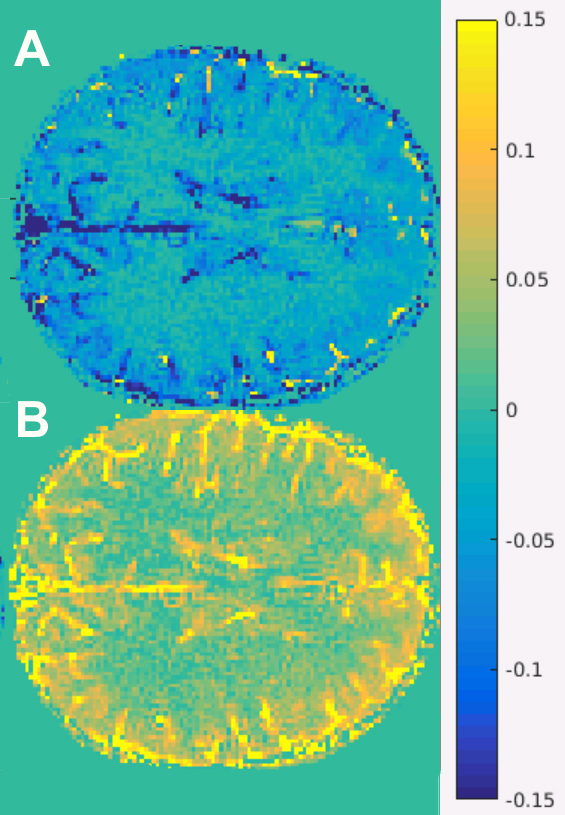
Figure 3. Difference-of-map-value maps. Difference (\(\Delta\) ) T1 map: T1 map fitted for flow minus T1 map not fitted for flow (A); difference (\(\Delta\) ) transmit field map: B1+ map minus spin history map \(\beta\) (B).
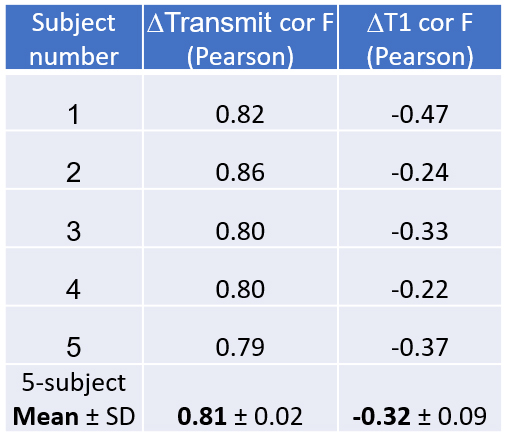
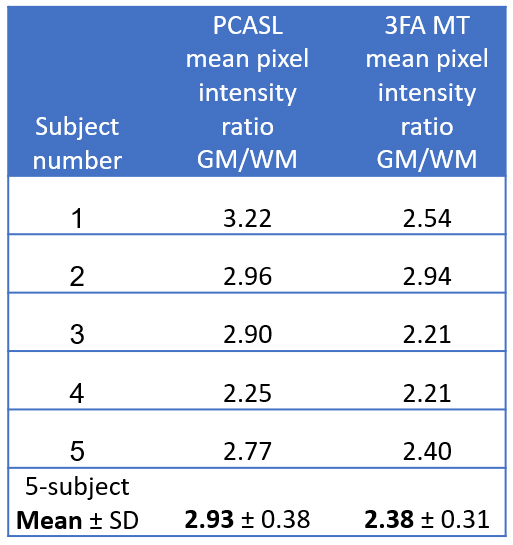
Figure 5. Flow metrics summary for 3FA MR Multitasking method and reference PCASL method.