2734
The application of multiband acceleration technique in temporal diffusion spectroscopy for breast tumor imaging
Jie Ding1,2,3, Zhen Zhang3, Yajia Gu1,2, Yishi Wang4, Xiuzheng Yue4, Dazhi Chen3, Rongrong Zhu3, and Ruoshui Ha3
1Department of Radiology, Fudan University Shanghai Cancer Center, Shanghai, China, 2Department of Oncology, Shanghai Medical College, Fudan University, Shanghai, China, 3People's Hospital of Ningxia Hui Autonomous Region, Yinchuan, China, 4Philips Healthcare, Beijing, China
1Department of Radiology, Fudan University Shanghai Cancer Center, Shanghai, China, 2Department of Oncology, Shanghai Medical College, Fudan University, Shanghai, China, 3People's Hospital of Ningxia Hui Autonomous Region, Yinchuan, China, 4Philips Healthcare, Beijing, China
Synopsis
Keywords: Breast, Diffusion/other diffusion imaging techniques
Both the IMPULSED and MRI-cytometry approaches are based on temporal diffusion spectroscopy (TDS), which connotes the acquisitionof dMRI data with a range of diffusion times expressed in terms of components of a diffusion spectrum.MR cell size imaging is possible with IMPULSED and MRI-cytometry using the theory of TDS. In this study, we proposed to use multiband to accelerate the data acquisition for TDS and compared the IMPULSED quantitative parameters and derivative ADC spectrum for two protocols. Our results showed the consistency in IMPULSED quantitative parameters and ADC calculation for the multiband accelerated protocol with the results without using multiband.Introduction
Cell size is a fundamental characteristic of all tissues, and changes in cell size in cancer reflect tumor status and response to treatments. Recently, a diffusion imaging based technique called temporal diffusion spectroscopy was reported for cell size imaging on a clinical 3T scanner[1]. The data acquisition protocol for time-dependent diffusion imaging consists of oscillating gradient spin echo (OGSE) and pulsed gradient spin echo (PGSE) sequences using different diffusion times. Both OGSE and PGSE usually require a long TR, hence long scan time for the acquisition of multiple b values, diffusion times and large spatial coverage. In this study, we propose to use Multiband (MB) SENSE to accelerate the TDS protocol for breast tumor imaging.Methods
Data acquisitionBoth OGSE and PGSE sequences were implemented and data were acquired on a Philips 3T scanner (Ingenia CX, Best, The Netherlands). 17 consecutive female patients (mean age, 48.43 years) suspected of breast tumor were recruited between Feb 2021 to Oct 2021. The study was approved by the IRB of People's Hospital of Ningxia Hui Autonomous Region and written informed consent was obtained from all the patients. The breast imaging protocol consisted of routine sequences (T1w, T2w,DWI, DCE) and two protocols, one using MB=2(N1MB,N2MB,PGMB) and the other without MB (N1,N2,PG). The common sequence parameters for the two protocols were: two OGSE sequences of 25Hz(N1)and 50 Hz(N2)and one PGSE sequence as reported in a previous study . FOV =340×255 mm2 , in-plane resolution = 3×3 mm2 , 16 slices with 5 mm slice thickness and 1 mm gap. The detailed parameters for the TDS protocols were listed in Table 1.
Data analysis
The IMPULSED quantitative parameters and derivative ADC values were calculated for two protocols using MATLAB. Regions of interest (ROIs) were drawn on each lesion by a radiologist with 5 years of experience, referring to the DCE images, with necrosis, hemorrhage and cyst excluded. Bland-Altman and Paired t test were used to compare the consistency and differences of IMPULSED quantitative parameters and ADC of the two protocols. A p value < 0.01 was considered to be statistically significant. Image quality was scored by two radiologists using a 5-point scale based on the image artifacts, deformation, graininess, and anatomical structure details. Image SNR and CNR were calculated as SNR=SIlesion/SDgland, CNR=(SIlesion-SIgland)/SDlung (SIlesion and SIgland were the signal intensity of lesions and normal glands;SDgland and SDlung were the standard deviation of the image intensity of normal glands and lung). All statistical analyses were performed using the SPSS software package (version 25, IBM SPSS, USA) and Graphpad prism 9.0.
Results
The results of the statistical analyses were shown in figure1-2 and table2. Bland-Altman results show that the closer these values are from zero, the smaller the average difference in measurements between two protocols. 95% of the differences of IMPULSED quantitative parameters and the value of derived ADC between the two protocols fall within these confidence limits.IMPULSED quantitative parameters and the derived ADC values follow a normal distribution, the Paired t-tests show no differences in all parameters between groups in the two protocols, (P>0.01). There was a clear pattern that the ADC of shorter diffusion times was larger than those from long diffusion times. The total scan time of the protocol using MB=2 was 5 minutes shorter than that without using MB. The image subjective score showed that the scores of the MB protocol group were slightly higher than those of non-MB, but there was no statistically significant difference, and the MB technique could eliminate or reduce image artifacts. The SNR and CNR of the MB group were lower than those in the non-MB group.Discussion and conclusion
OGSE and PGSE are typically gradient performance draining sequences although recently made available on clinical 3T scanners by a few research facilities. The Multiband technique can reduce the need for frequent gradient switching and the scan time. Our results showed that the IMPULSED quantitative parameters and ADC for the two TDS protocols were highly consistent, which may lay the foundation for reliable model fitting using MB accelerated data, such as cell imaging.Acknowledgements
Ningxia Natural Science Foundation, Project No.2022A0194Science and Technology Development Project of Ningxia People's Hospital,Project No.201924References
1.Jiang X, Li H, Devan SP, Gore JC, Xu J. MR cell size imaging with temporal diffusion spectroscopy. Magn Reson Imaging. 2021;77:109-123. 2. Xu J, Jiang X, Li H, et al. Magnetic resonance imaging of mean cell size in human breast tumors. Magnetic resonance in medicine 2020;83(6):2002-2014.Figures
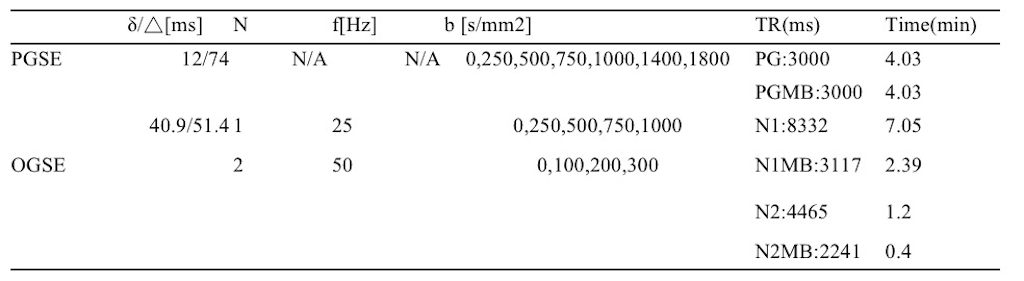
Table 1, The detailed parameters and scan time for the TDS protocols
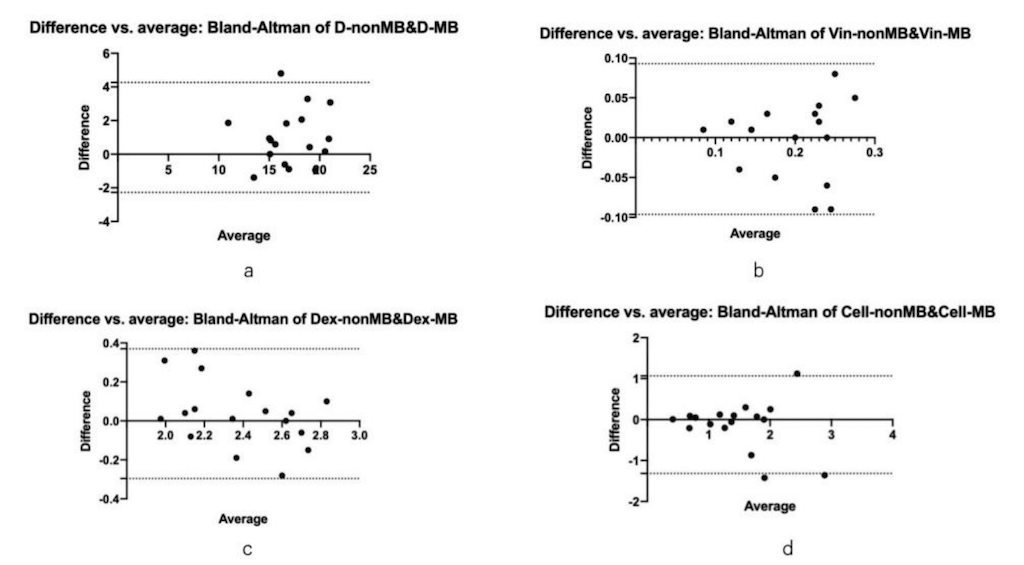
Figure1,Bland-Altman test of IMPULSED quantitative parameters from two protocols
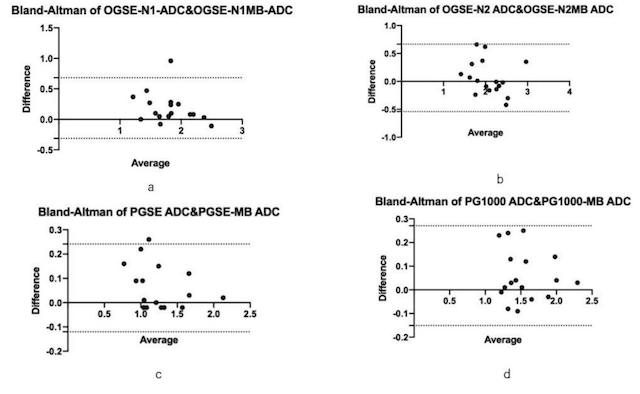
Figure2,Bland-altman test of ADC values from two protocols
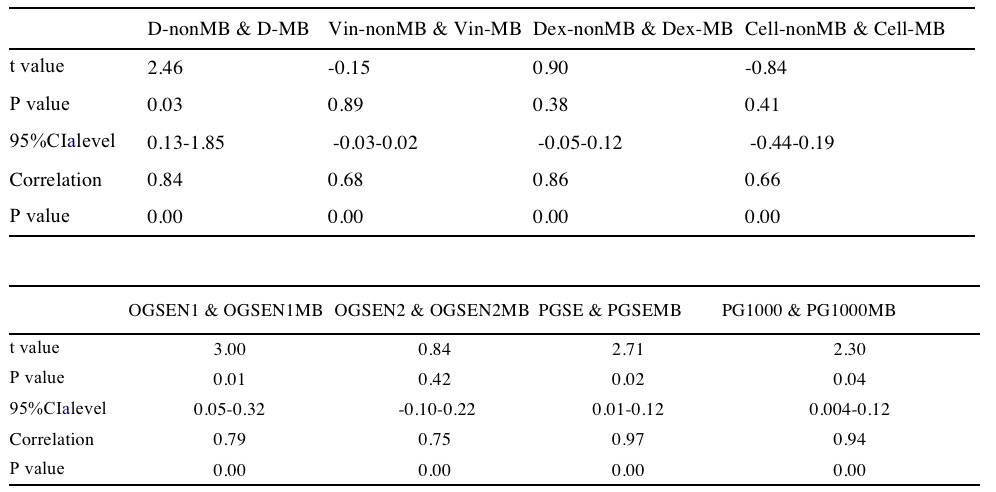
Table2, Paired t test of IMPULSED quantitative parameters and derivative ADC values from the two protocols.
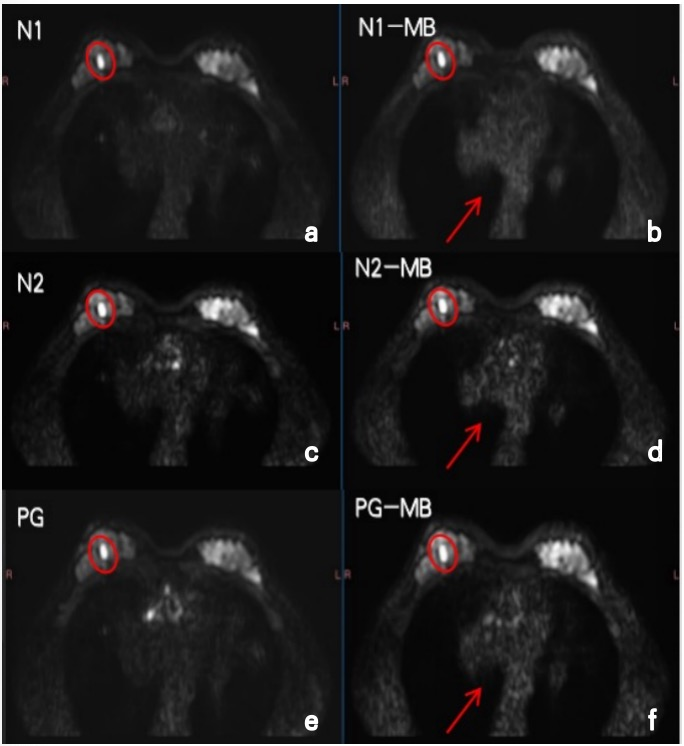
Figure3,A 54-year-old female,(a,c,e) were from non-MB protocol, (b,d,f) were from MB protocol. A benign nodule was shown on the right breast (red circle). The anatomical structure of the lesion was clearly shown by the two scanning protocols. Image from the MB protocol showed sharper edge of the heart than that of non-MB protocol (red arrow).
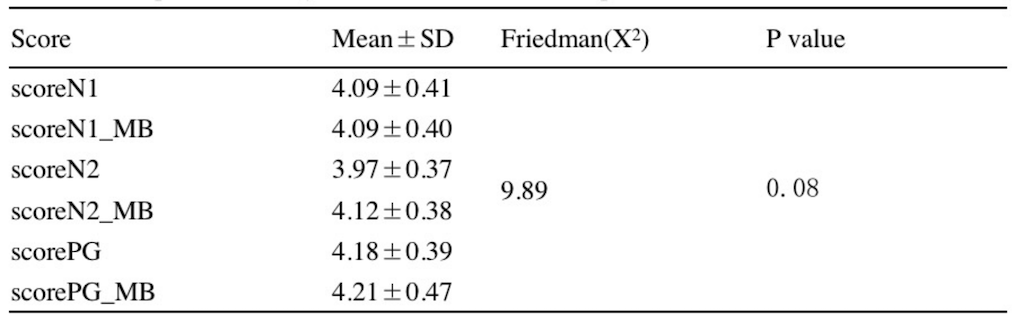
Table3,Comparison of subjective scores between the two protocols
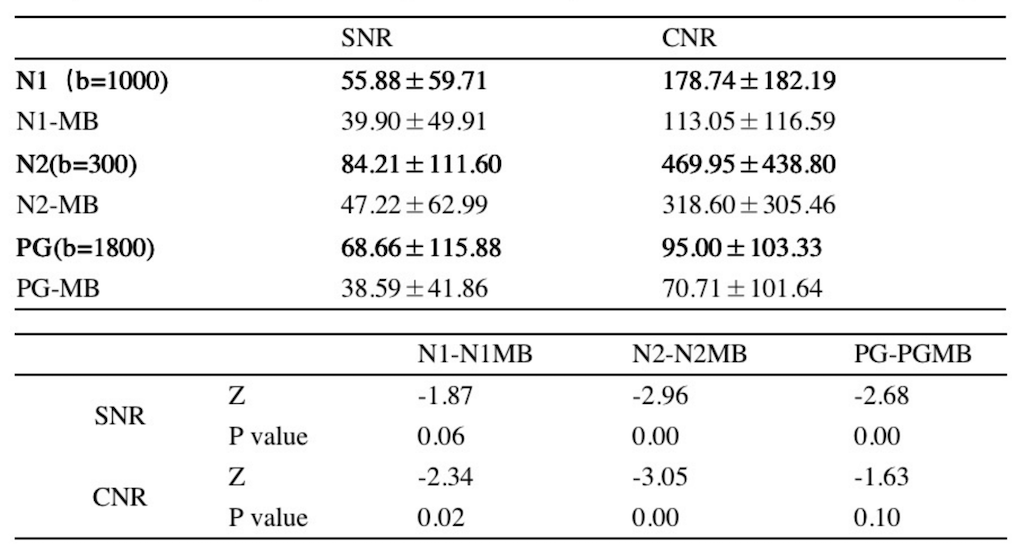
Table4,The mean of SNR and CNR and statistical differences were compared of two protocols.
DOI: https://doi.org/10.58530/2023/2734