2732
Quantitative calculation of breast density with proton density fat fraction enables distinction between latest subjective BI-RADS categories1Nuffield Department of Women's and Reproductive Health, University of Oxford, Oxford, United Kingdom, 2Perspectum Ltd., Oxford, United Kingdom, 3Stoke Mandeville Hospital, Buckinghamshire Healthcare NHS Trust, Aylesbury, United Kingdom, 4Department of Oncology, University of Oxford, Oxford, United Kingdom
Synopsis
Keywords: Breast, Fat, Breast density
Breast density is a well-established risk factor for breast cancer but conventional visual assessment using mammography has high operator variability. Proton density fat fraction (PDFF) derived from chemical shift encoded (CSE)-MRI has recently been proposed as a quantitative, non-ionising, operator-independent tool for the calculation of breast density. This study demonstrates that breast density derived from PDFF maps which account for a breast-specific fat spectrum can distinguish between the latest density categorisations used in clinical practise and thereby may have use in cancer risk assessment and as a determinant of clinical pathways.
Introduction
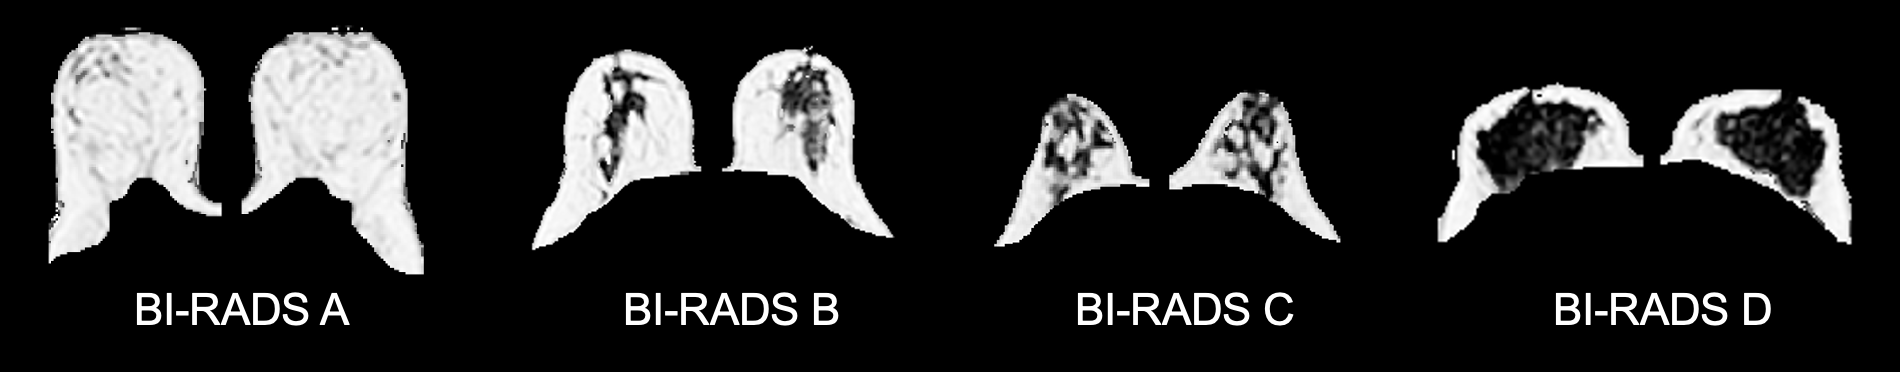
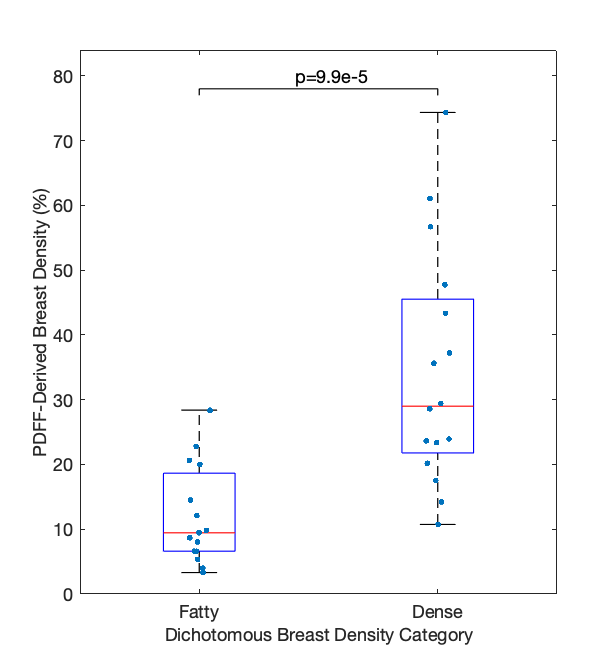
Breast density is a mammographic measure of the relative proportion of fibroglandular to fatty tissue. Elevated breast density is a strong risk factor for breast cancer1 and decreases the sensitivity of mammography in cancer detection2; accurate quantification of breast density is therefore vital for both risk assessment and to inform the clinical pathway.In clinical practice, breasts are classified into one of four categories defined by the Breast Imaging-Reporting and Data System (BI-RADS)3. The latest edition of BI-RADS eliminated quartile ranges of percentage fibroglandular tissue from the categories; a significant difference in density classification was found when clinicians employed the updated and previous guidelines4. A dichotomous classification between ‘fatty’ (categories A-B) and ‘dense’ (categories C-D) breasts can be used to define different screening protocols5.
Conventional visual categorisation of breast density with mammography has high operator variability6. An automated breast density measurement with quantitative, non-ionising MRI would reduce radiologist burden and eliminate operator variability. Such methods have been explored7,8 but rely on thresholding and are sensitive to the partial volume effect.
Proton density fat fraction (PDFF) is a robust, quantitative measure of tissue fat concentration9. Recent studies discovered a negative correlation between whole-breast PDFF and BI-RADS density categories10 and found high reproducibility in the volume of fibroglandular tissue derived from proton density water fraction (PDWF) maps11. However, there has not yet been comparison of PDFF-derived density to the most recent BI-RADS categorisations. Furthermore, the ability of this biomarker to distinguish between dichotomous breast density classifications has not yet been assessed. Moreover, previous performance analysis of PDFF-derived density did not incorporate a breast-specific fat spectrum and was performed at 3T.
This study aims to assess whether a PDFF-derived breast density calculation at 1.5T which accounts for the specific composition of breast fat can distinguish between the latest BI-RADS categorisations.
Methods
Thirty-three healthy women (mean age 37 years, range 22-77 years) gave informed consent and were imaged on a Siemens Magnetom Aera 1.5T scanner with an 18-channel breast coil (Siemens Healthineers AG, Erlangen, Germany). A 3D axial 6-echo gradient echo scan was performed with the following parameters: TE1/$$$\Delta$$$TE/TR = 1.81ms/1.95ms/15ms, flip angle 5°, reconstructed in-plane resolution 1.7×1.7mm2, slice thickness 2.0mm, acquired matrix size 128×128, FOV 440×399mm2, bandwidth 1560Hz/Px. Typically, 80 slices were sampled and scan time was 2min19s. Standard T1-weighted and T2-weighted images were also acquired.Three-dimensional PDFF maps were generated using a magnitude-only approach12 with additional refinement of the solution using field map smoothing13. A fat spectrum derived from healthy breast fat was incorporated into the signal model14. Pixels were capped between 0-100%.
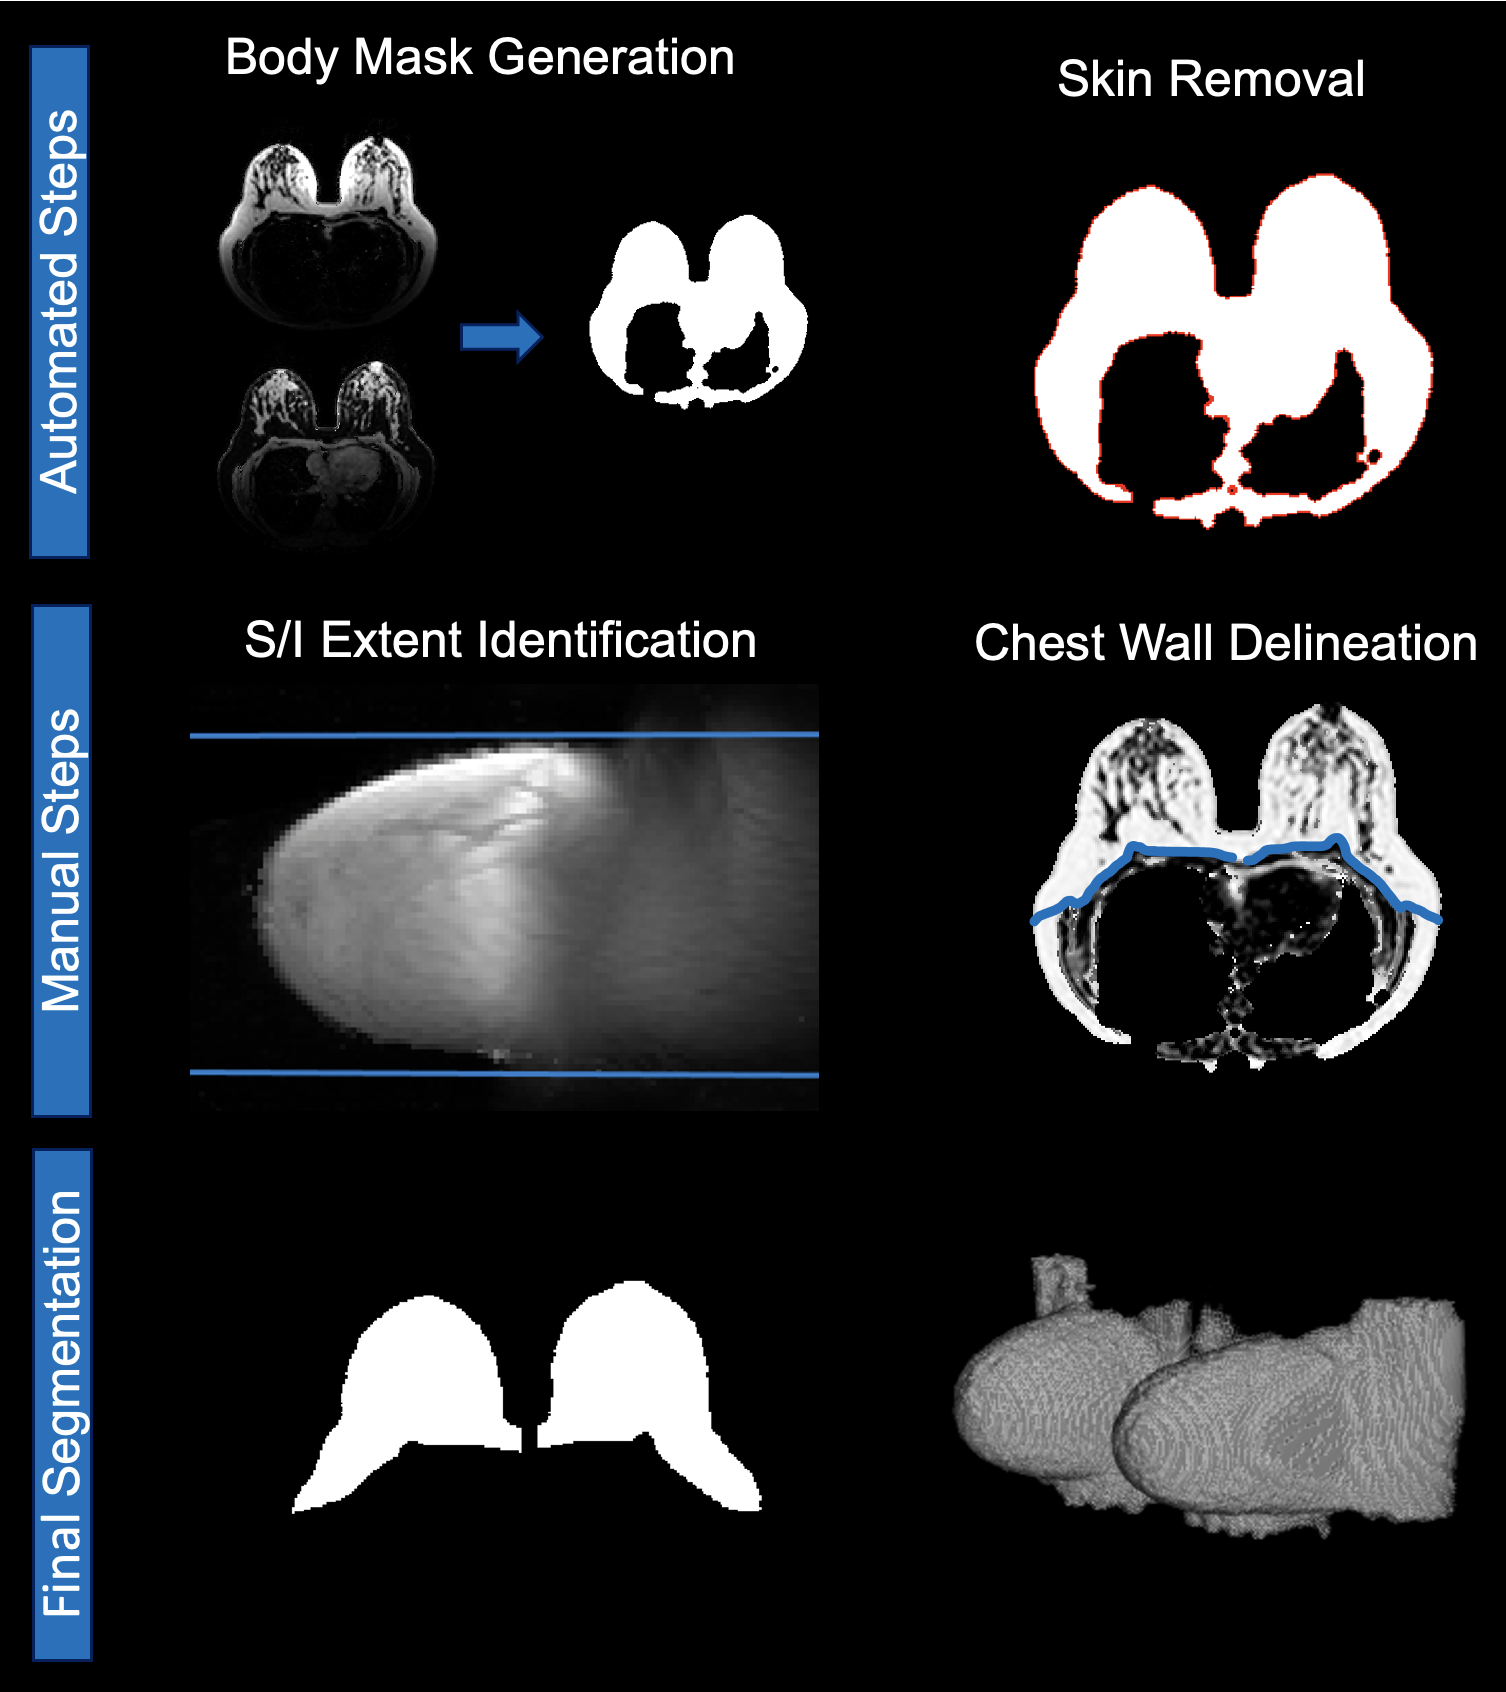
Breast segmentation firstly employed a morphology-based approach to create a body mask14. Image erosion was used to remove the skin. The chest wall was delineated manually as in Gordon et al.14 and the superior and inferior edges of the breast were defined using the maximum intensity projection of the fat image in the sagittal plane.
The proportion of fibroglandular tissue in each voxel was defined as11:
$$\rho(r) = \frac{PDFF(r) - PDFF_{Adipose}}{PDFF_{Fibroglandular} - PDFF_{Adipose}}$$
Assuming constant voxel size, $$$PDFF_{Fibroglandular}$$$ and $$$PDFF_{Adipose}$$$, the breast density was calculated as:
$$100\%\times\frac{\Sigma\rho(r)}{r} = 100\%\times\frac{\frac{\Sigma PDFF(r)}{r} - PDFF_{Adipose}}{PDFF_{Fibroglandular} - PDFF_{Adipose}}$$
where $$$\frac{\Sigma PDFF(r)}{r}$$$ is mean breast PDFF. We assigned $$$PDFF_{Fibroglandular}$$$ = 0% and $$$PDFF_{Adipose}$$$ = 91.6%14.
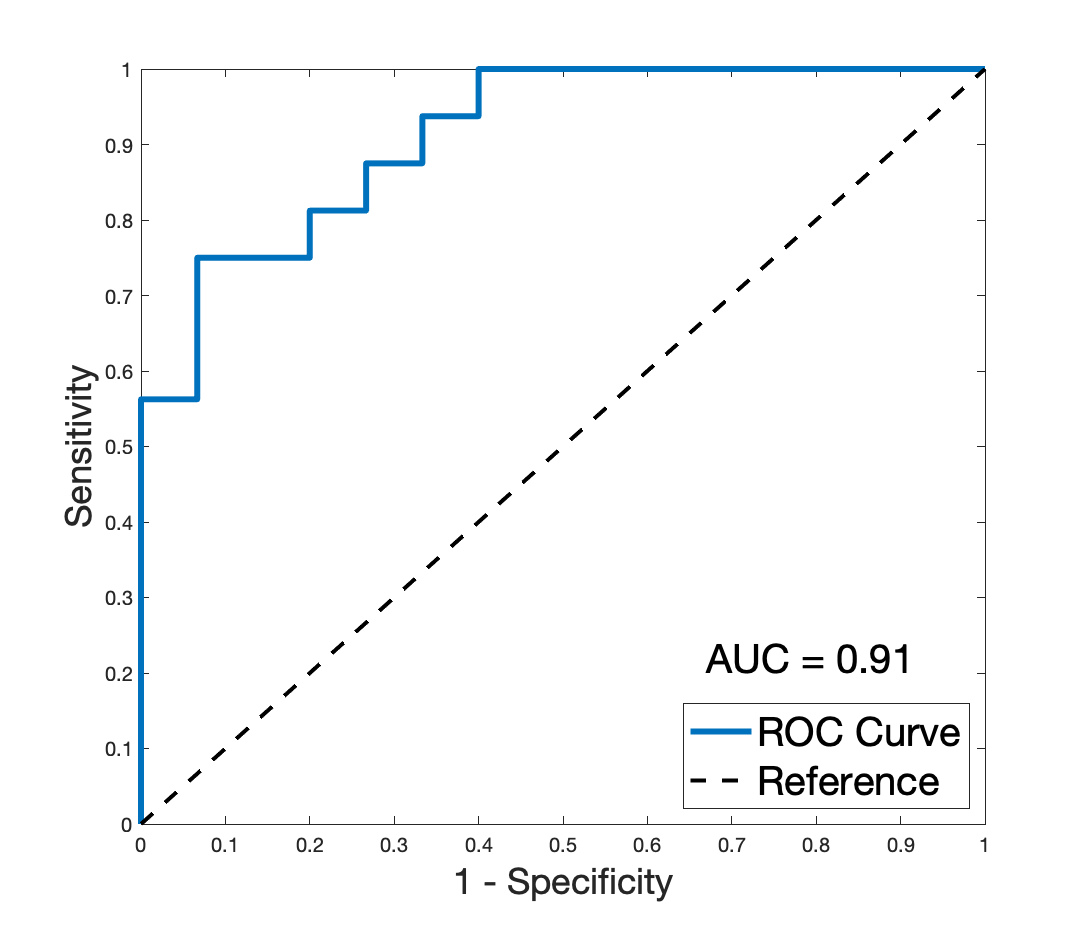
A radiologist with 2 years’ experience assigned the latest BI-RADS categories15 using T1-weighted and T2-weighted images. The difference in PDFF-derived density between BI-RADS categories was evaluated using the Wilcoxon rank sum test for pairwise category comparisons and the Kruskal-Wallis test; the Spearman correlation coefficient was also computed. A receiver operator characteristic (ROC) curve was generated and the area under the curve (AUC) was calculated to assess the performance of PDFF-derived density in dichotomous density classification.
Results
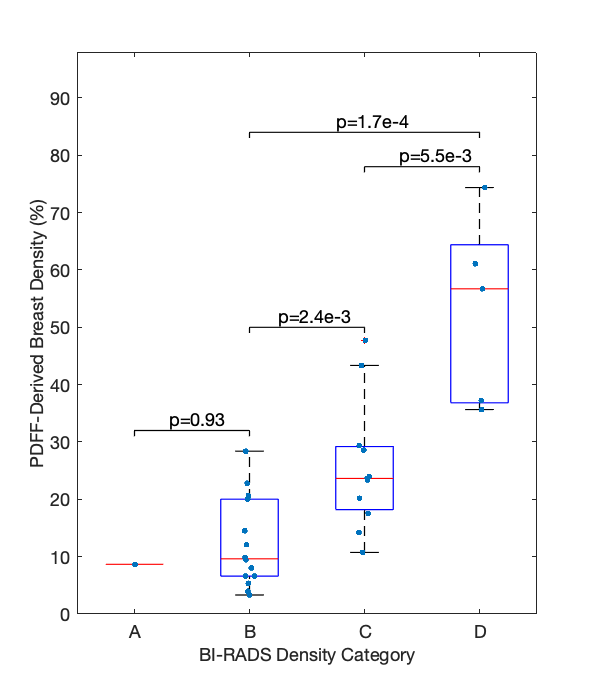
Two datasets were excluded from analysis due to areas of fat-water swaps. A strong positive association between BI-RADS categorisation and PDFF-derived density was found (R = 0.78, p = 2.3e-7). PDFF-derived breast density was significantly different in pair-wise comparison between BI-RADS categories B, C and D (Fig. 3). No distinction could be made between the single dataset in category A and other individual categories. Kruskal-Wallis analysis showed distinct separation between all four categories (p = 3.4e-4).PDFF-derived density was significantly different (p = 9.9e-5) between ‘fatty’ and ‘dense’ breasts (Fig. 4) and showed excellent performance (AUC = 0.91) in distinguishing between these two classifications (Fig. 5).
Discussion
The significant difference of PDFF-derived density between BI-RADS categories at 1.5T is promising for clinical deployment of this biomarker. PDFF-derived density still correlated with clinical categorisation when a breast-specific fat spectrum was incorporated into the calculation and when the latest BI-RADS categories15, which are no longer each associated with a percentage density range, were used. The excellent performance of PDFF-derived density in determination of the dichotomous density classification suggests that this biomarker could be used as an operator-independent tool to determine patients’ clinical pathways.Conclusion
PDFF-derived breast density shows promise as an operator-independent, robust biomarker which correlates with qualitative categorisations currently used in clinical practise. The PDFF of breast adipose tissue has recently been demonstrated to have use in lesion characterisation14,16; generation of PDFF maps from a short, non-contrast acquisition could thereby improve assessment of cancer risk whilst also improving the specificity of diagnosis.Acknowledgements
This work was supported by Perspectum Ltd. and the Royal Commission for the Exhibition of 1851.References
1. McCormack V. A., dos Santos Silva I. Breast density and parenchymal patterns as markers of breast cancer risk: a meta-analysis. Cancer Epidemiol Biomarkers Prev. 2006;15(6):1159–1169.
2. Kolb T. M., Lichy J., Newhouse, J. H. Comparison of the performance of screening mammography, physical examination, and breast US and evaluation of factors that influence them: an analysis of 27,825 patient evaluations. Radiology. 2002;225(1):165–175.
3. Sickles, E. A., D’Orsi C. J., Bassett L. W., et al. ACR BI-RADS® Mammography. In: ACR BI-RADS® Atlas, Breast Imaging Reporting and Data System. Reston, VA, American College of Radiology. 2013.
4. Gemici A. A., Bayram E., Hocaoglu E., et al. Comparison of breast density assessments according to BI-RADS 4th and 5th editions and experience level. Acta Radiol Open. 2020;9(7):2058460120937381.
5. Bernardi D., Pellegrini M., Di Michele S., et al. Interobserver agreement in breast radiological density attribution according to BI-RADS quantitative classification. Radiol Med. 2012;117(4):519-28.
6. Sprague B. L., Conant E. F., Onega T., et al. Variation in mammographic breast density assessments among radiologists in clinical practice: a multicenter observational study. Annals of internal medicine. 2016;165(7):457–464.
7. Khazen M., Warren R. M., Boggis C. R., et al. A pilot study of compositional analysis of the breast and estimation of breast mammographic density using three-dimensional T1-weighted magnetic resonance imaging. Cancer Epidemiol Biomarkers Prev. 2008;17(9):2268-2274.
8. Ledger A. E., Scurr E. D., Hughes J., et al. Comparison of Dixon sequences for estimation of percent breast fibroglandular tissue. PLoS One. 2016;11(3):e0152152.
9. Reeder S.B., Hu H.H., Sirlin C.B. Proton density fat-fraction: A standardized MR-based biomarker of tissue fat concentration. J. Magn. Reson. Imaging. 2012;36(5):1011-1014.
10. Borde T., Wu M., Ruscke S., et al. Assessing breast density using the standardized proton density fat fraction based on chemical shift encoding-based water-fat separation. Proc. Intl. Soc. Mag. Reson. Med. 2021;29:0743.
11. Henze Bancroft L. C., Strigel R. M., Macdonald E.B., et al. Proton density water fraction as a reproducible MR-based measurement of breast density. Magn Reson Med. 2022;87:1742-1757.
12. Bagur A. T., Hutton C., Irving B., et al. Magnitude-intrinsic water-fat ambiguity can be resolved with multipeak fat modeling and a multipoint search method. Magn Reson Med. 2019;82(1):460-475.
13. Bagur A.T., McClymont D., Hutton C., et al. Estimation of field inhomogeneitymap following magnitude-based ambiguity-resolved water-fat separation. 2022.
14. Gordon I., Ralli G., Fernandes C. et al. Proton density fat fraction of breast adipose tissue: comparison of the effect of fat spectra and initial evaluation as a biomarker. Medical Image Understanding and Analysis. MIUA 2022. Lecture Notes in Computer Science. 2022;13413:28-45.
15. Morris E. A., Comstock C. E., Lee C. H., et al. ACR BI-RADS® Magnetic Resonance Imaging. In: ACR BI-RADS® Atlas, Breast Imaging Reporting and Data System. Reston, VA, American College of Radiology. 2013.
16. Hisanaga S., Aoki T., Shimajiri S., et al. Peritumoral fat content correlates with histological prognostic factors in breast carcinoma: a study using iterative decomposition of water and fat with echo asymmetry and least-squares estimation (IDEAL). Magn. Reson. Med. Sci. 2021;20:28–33.
Figures