2727
Value of Native T1 Mapping for Differentiating Benign and Malignant Breast Lesions on MRI: A Pilot Study1Radiology, Peking University Shenzhen Hospital, Shen Zhen, China, 2Clinical & Technical Support, Philips Healthcare (Shenzhen) Ltd, Shen Zhen, China
Synopsis
Keywords: Breast, Breast
Breast cancer is the most prevalent cancer among women ,early detection and timely treatment are the key to imprve survival rate. In this preliminary study, we aimed to differentiation lesions using native T1mapping. The mean T1 relaxation time was higher in the malignant group compared to the benign group by both observers (p<0.05). Results indicated that native T1mapping could be used to differentiate benign and malignant lesions, which might be promising in clinical applications. However, the combination of T1mapping and DWI dose not improve the AUC statistically significantly.
Introduction
Breast MRI is often used as a further test for indeterminate breast disease found on mammograms and ultrasounds[1], an accurate diagnostic method to distinguish between benign and malignant lesions is crucial in deciding whether a surgical biopsy would be needed. However, the DCE curves of breast lesions with distinct characteristics overlap, resulting in a high false positive rate and diagnostic difficulties[2]. In addition, the deposition of the gadolinium contrast agent in the cell nuclei may cause injury to the human body[3]. Native T1 mapping is an endogenous biomarker for characterization of tissue-specific T1 relaxation times without contrast administration, and some previous study demonstrates that quantitative MRI (qMR) is beneficial for the diagnosis of breast lesions through methods such as relaxation quantitative mapping[4]. This study aimed to exploring the potential of T1 values in discriminating benign and malignant lesions by calculating T1 relaxation times of breast.Methods
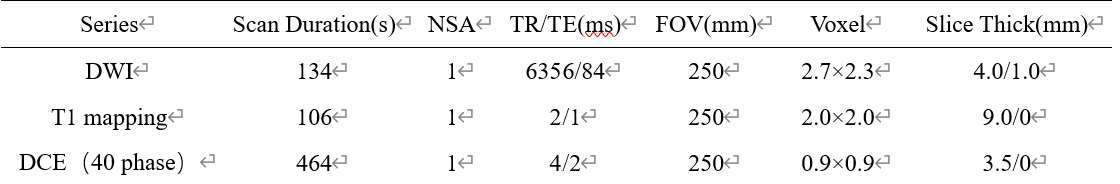
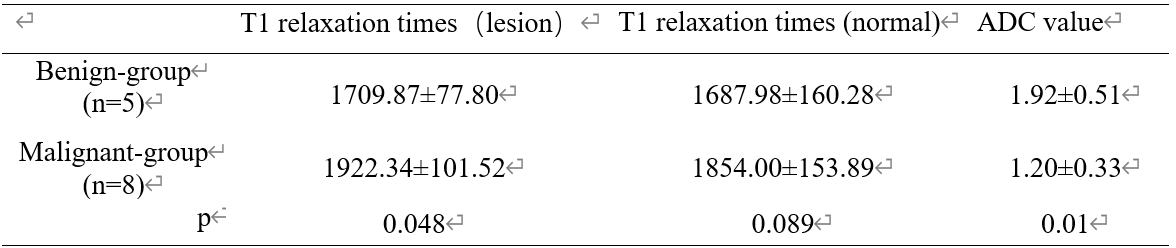
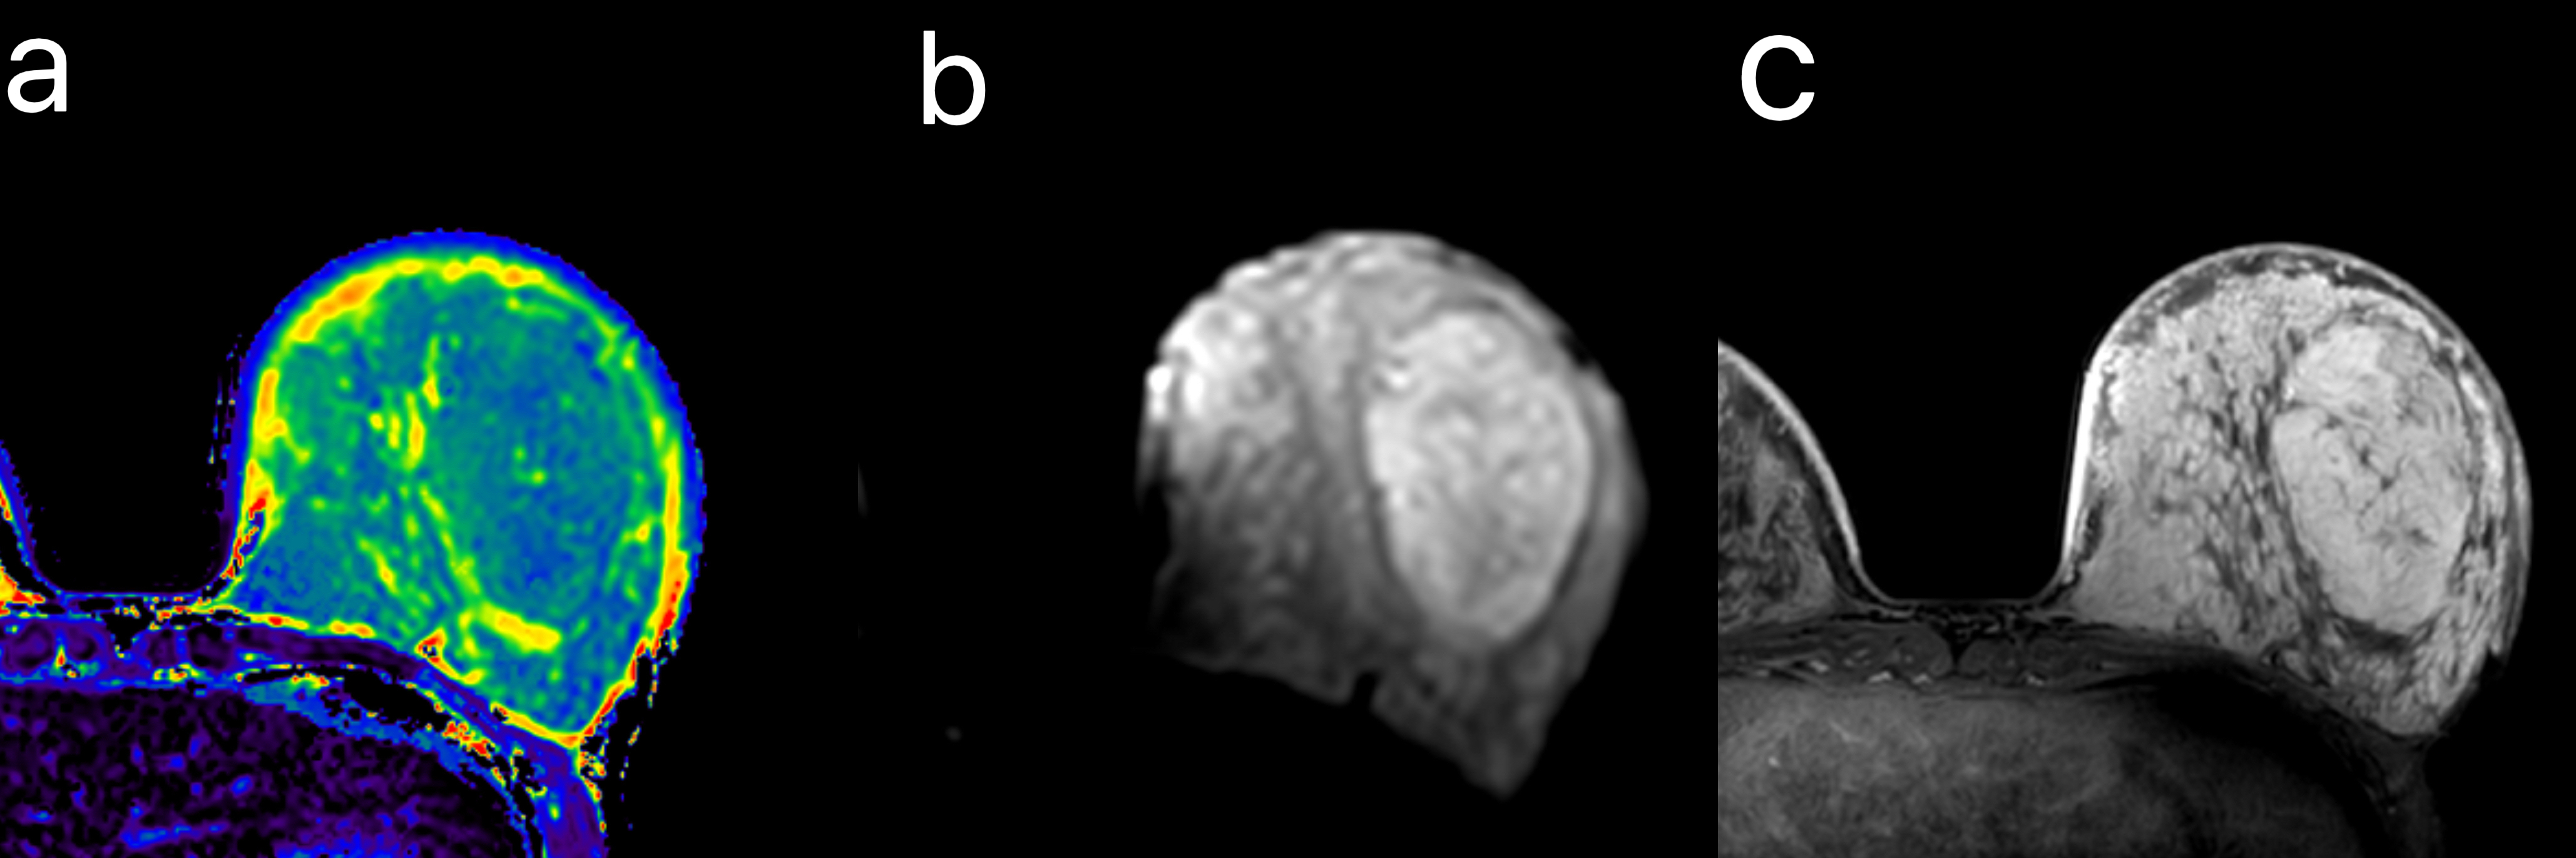
This prospective study was approved by the institutional IRB, and all patients signed informed consent forms before the scans were performed. Fourteen female cases (5 benign lesions and 9 malignant lesions) aged from 22 to 70 years were collected, which were diagnosed BI-RADS 4a-5 by mammogram or ultrasound. All cases had biopsy or surgery pathological and IHC results after MRI examination within 2 weeks. All patients underwent 3.0T MRI examination with a 16-channel breast coil, (Ingenia CX Philips Healthcare) including T1 mapping, DWI imaging and dynamic contrast-enhanced (DCE) MR, detailed parameters are listed in Table 1. ROI were drawn independently by two radiologists (5 and 25years of radiology experiences respectively) on the T1 mapping images on the slice that show the largest lesion area(Fig.1、Fig.2). Statistical analyses were performed using the SPSS 26.0 software. The measurement consistency between the two observers was evaluated using intraclass correlation coefficient (ICC). The T1 relaxation times and ADC values T1 relaxation times and ADC values of the benign and malignant groups were compared using the Mann-Whitney U test. The differential diagnosis performance of T1 mapping and DWI parameters was evaluated with ROC curves. The Delong test was used to compare the diagnostic efficacy.Results
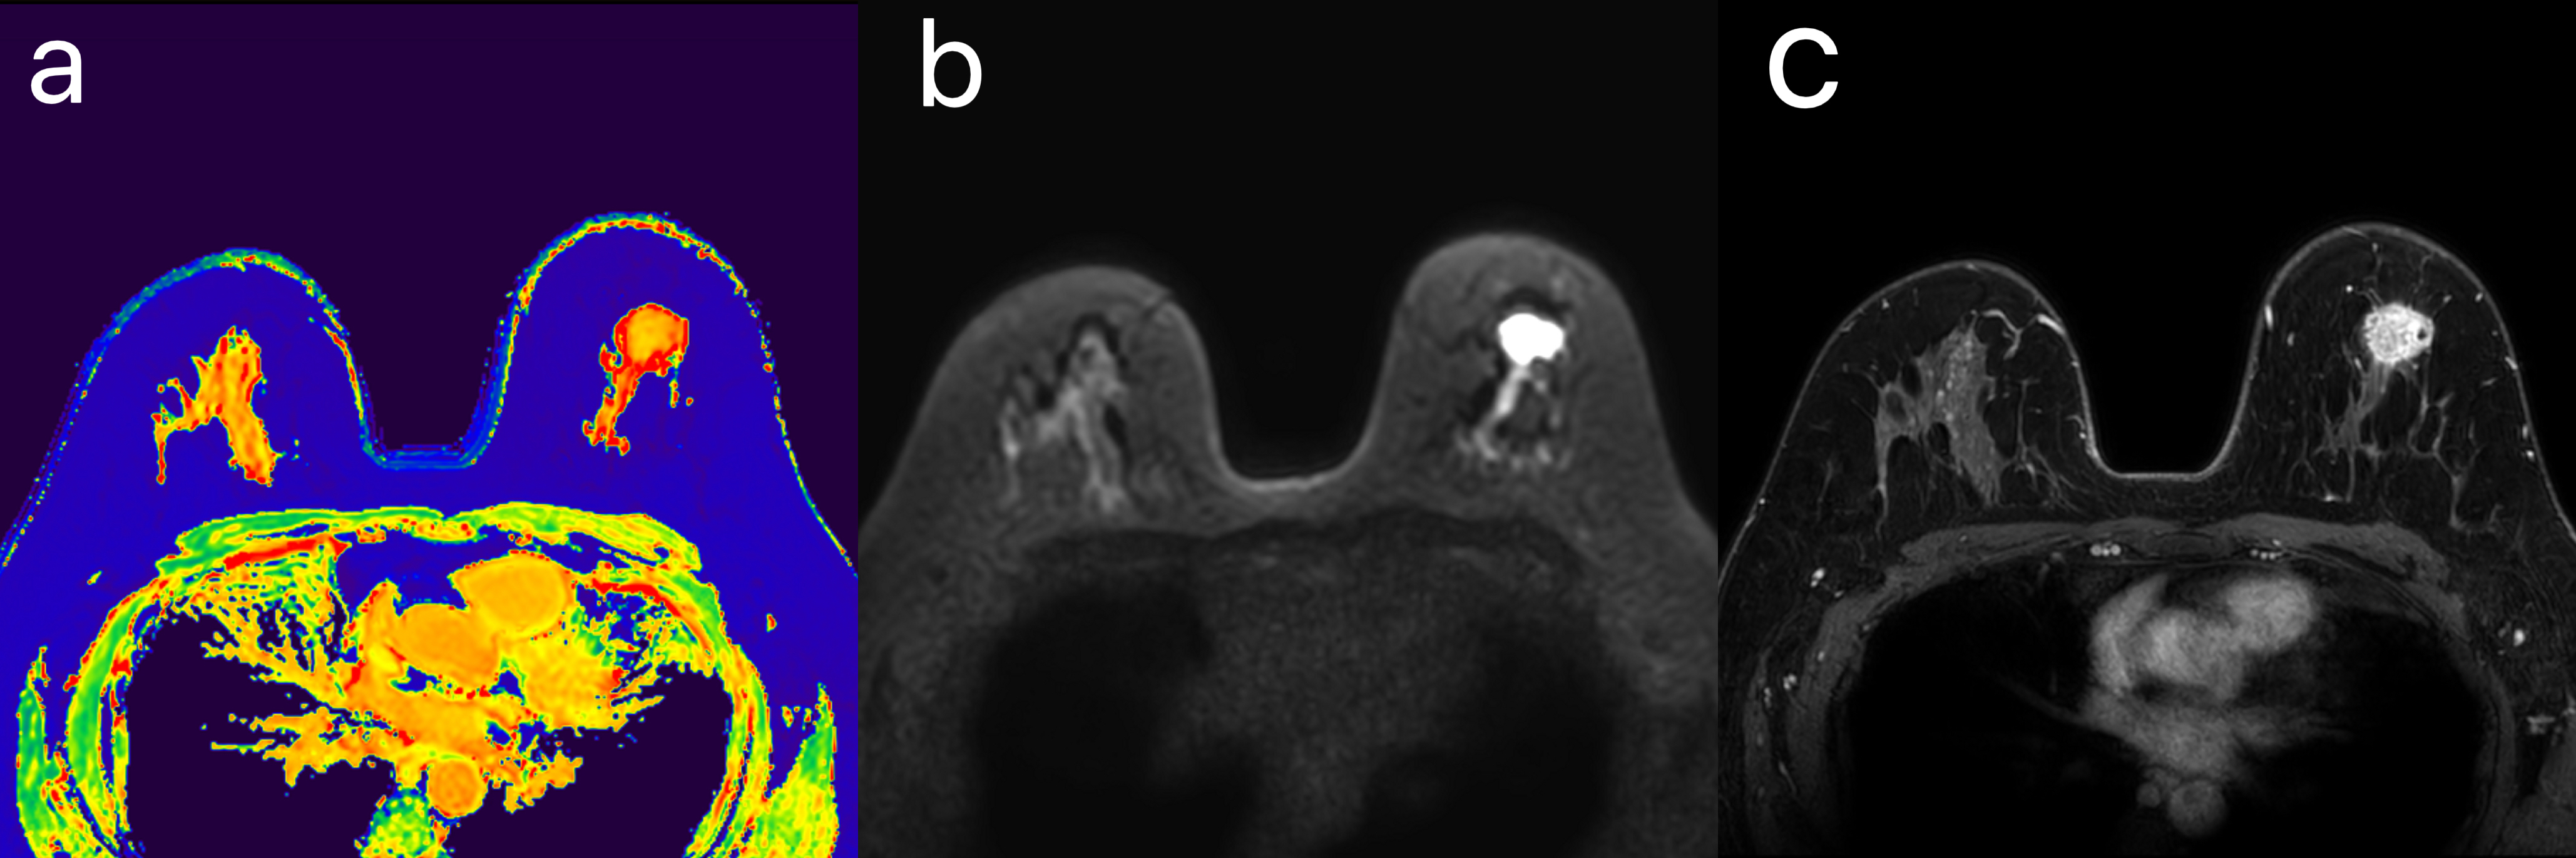
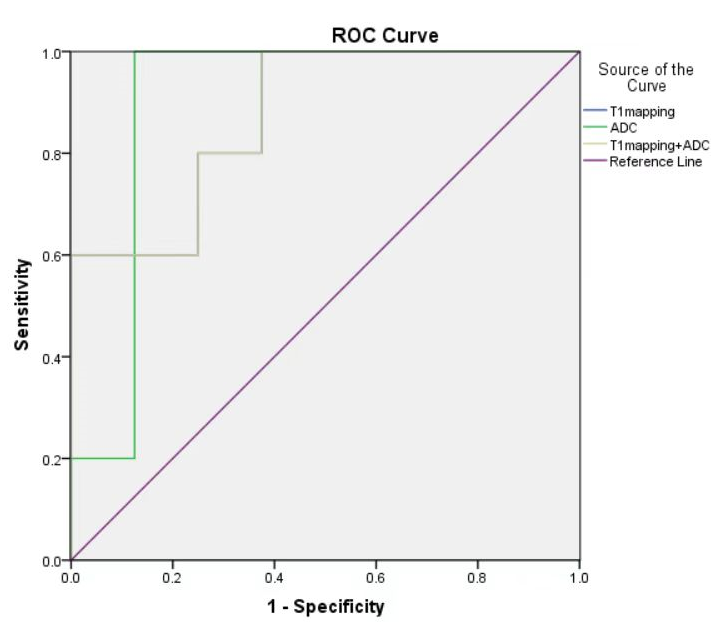
The interobserver measurement agreement for T1 mapping and ADC values was good. The mean T1 relaxation times were lower in the benign group compared to the malignant group (p<0.05), and there was no statistical differences for T1 relaxation times in the normal glands (Table 2). For the diagnosis of T1 mapping and ADC yielded an AUC of 0.875, 0.9 respectively. The AUC of the combination of T1 mapping and ADC values was 0.875 (Fig.3).Discussion
The T1 values depend on the composition of tissues, such as macromolecule concentration, hydration state and tissue water content[5]. The components of materials are perturbed by pathophysiological conditions, and quantitative T1 values may reflect the alteration of tissue composition, indicating the nature of the possible pathological variation. This explains why T1 mapping can be used for differential diagnosis of breast lesions. However, some differences between the results of this study and previous studies may be due to insufficient samples. More patients need to be included to validate the results in future.Conclusion
In this study, malignant lesions shows longer T1 relaxation times in T1 mapping compared to benign lesions for breast. In summary, native T1 mapping could be used for differentiating benign and malignant lesions of the breast, it may be valuable for preventing patients from undergoing unnecessary core biopsy procedures and facilitate the decision-making process.Acknowledgements
No acknowledgement found.References
[1] KWON M R, CHOI J S, WON H, et al. Breast Cancer Screening with Abbreviated Breast MRI: 3-year Outcome Analysis [J]. Radiology, 2021, 299(1): 73-83.
[2] BIGNOTTI B, SIGNORI A, VALDORA F, et al. Evaluation of background parenchymal enhancement on breast MRI: a systematic review [J]. The British journal of radiology, 2017, 90(1070): 20160542.
[3] MCDONALD R J, MCDONALD J S, KALLMES D F, et al. Gadolinium Deposition in Human Brain Tissues after Contrast-enhanced MR Imaging in Adult Patients without Intracranial Abnormalities [J]. Radiology, 2017, 285(2): 546-54.
[4] LIU L, YIN B, SHEK K, et al. Role of quantitative analysis of T2 relaxation time in differentiating benign from malignant breast lesions [J]. The Journal of international medical research, 2018, 46(5): 1928-35.
[5] DING Y, RAO S X, CHEN C, et al. Assessing liver function in patients with HBV-related HCC: a comparison of T₁ mapping on Gd-EOB-DTPA-enhanced MR imaging with DWI [J]. European radiology, 2015, 25(5): 1392-8.
Figures