2719
Validating NORDIC denoising on high-resolution fMRI data at 7 T1Erwin L. Hahn Institute for Magnetic Resonance Imaging, University of Duisburg-Essen, Essen, Germany, 2Donders Institute for Brain, Cognition and Behavior, Radboud Iniversity Nijmegen, Nijmegen, Netherlands
Synopsis
Keywords: Data Processing, fMRI, denoising, laminar fMRI, NORDIC PCA
High-resolution fMRI is dominated by thermal noise. The NORDIC PCA filter is a promising method to remove thermal noise but its effect on the spatial fidelity of layer-dependent profiles is sparsely investigated. We evaluated the performance of NORDIC with several parameter setting for laminar fMRI at 7 T and sought to investigate the effect NORDIC has on the shape of the profiles. Our results suggest that NORDIC indeed affects high-resolution profiles but the overall effect can be seen to be small and can be further reduced with careful parameter settings.Introduction
High-resolution fMRI is dominated by thermal rather than physiological noise, which is typically addressed by averaging of volumes with the same functional condition, prolonging scan time. The recently proposed NORDIC PCA filter1,2 promises to remove components indistinguishable from zero-mean Gaussian noise from the data while preserving spatial resolution and signal fluctuations associated with neuronal activity. Studies3,4 showed the improvements brought by NORDIC and recently, the feasibility of NORDIC for laminar fMRI at 3 T was demonstrated5. In this work, we aim to evaluate the performance of NORDIC for laminar fMRI at 7 T and whether the spatial fidelity of laminar profiles is preserved when applying NORDIC.Methods
Laminar fMRI data from one male subject (32 years old) were acquired using a 3D GRE-EPI6 at a 7T (MAGNETOM Terra, Siemens Healthcare, Erlangen, Germany) scanner (VE12U software version). A 256x256x72 matrix was scanned at 0.75 mm isotropic resolution at a TE = 22.5 ms and a volume TR of 2.1 s. An acceleration factor of R = 4x2 (caipi-shift 1) and a partial Fourier (PF) factor of 6/8 were used. We performed a flickering checkerboard fMRI experiment split into 3 runs lasting for 14:28 min, resulting in 400 volumes per run.Complex images were reconstructed using adaptive coil combination and eigenvalue decomposition with coil sensitivity phase correction from a separate adjustment scan. The missing part of k-space due to PF was retrospectively reconstructed using POCS7.
Different settings in the NORDIC algorithm (https://github.com/SteenMoeller/NORDIC_Raw downloaded 06122021) were compared as follows:
- We used the g-factor noise map as estimated from a Marchenko-Pastur PCA implemented in the NORDIC algorithm (referred to as “implicit g-map”)
- The vendor-provided IcePAT reconstruction pipeline offers the possibility to save g-factor maps taken from the GRAPPA weights. We compared this g-factor estimation (referred to as “NORDIC”) with the implicit g-map.
- The noise threshold was estimated taking complex differences between time-points and testing for normality according to the method proposed by Nothnagel et al.3. We additionally investigated two cases where 6/8 and 4/8 of the noise level was taken, respectively.
- In all previous points, the patch size was 113. We tested whether a finer patch size of 73 would effect the laminar profiles.
Results
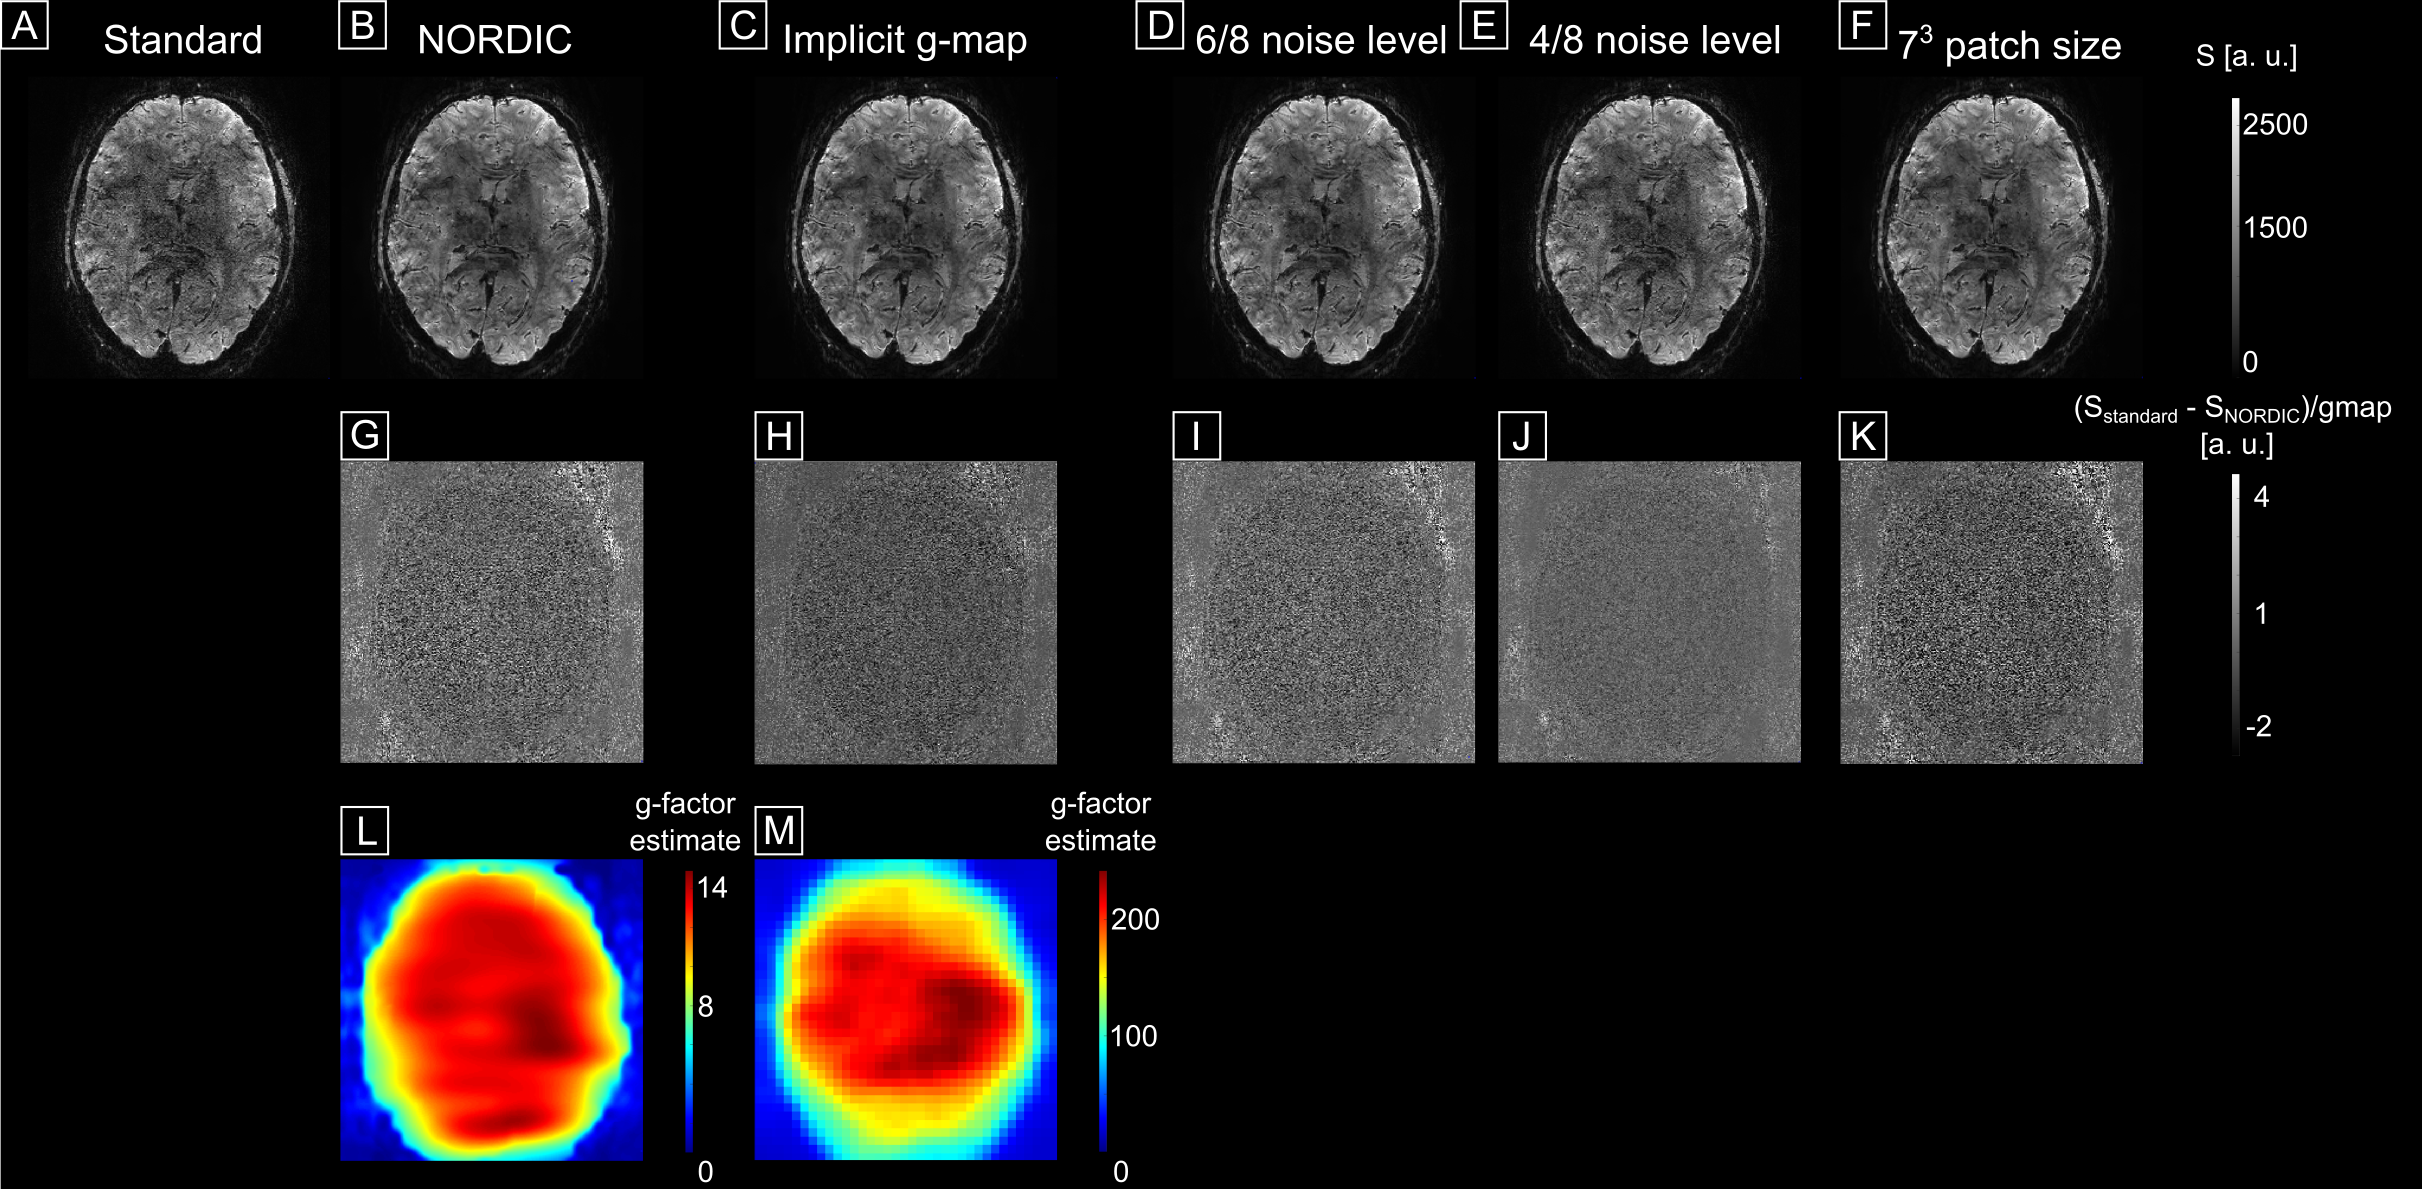
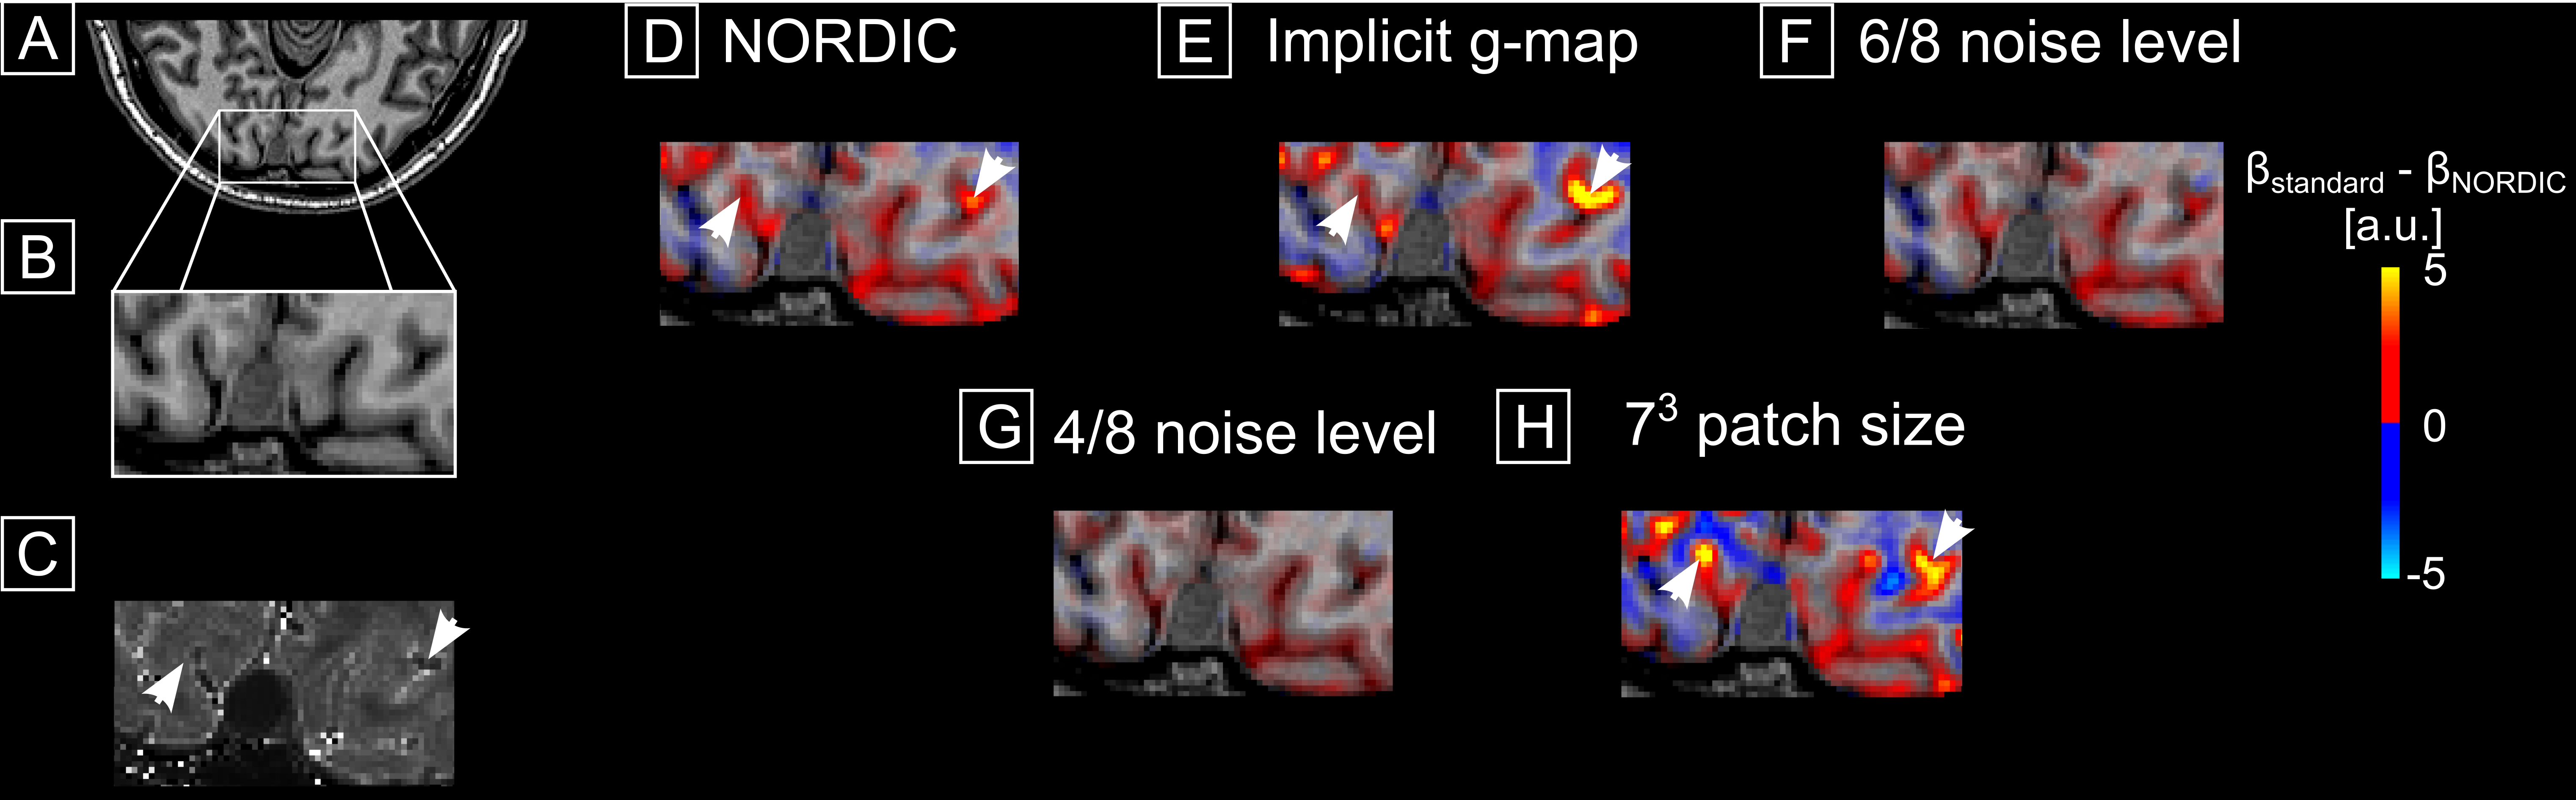
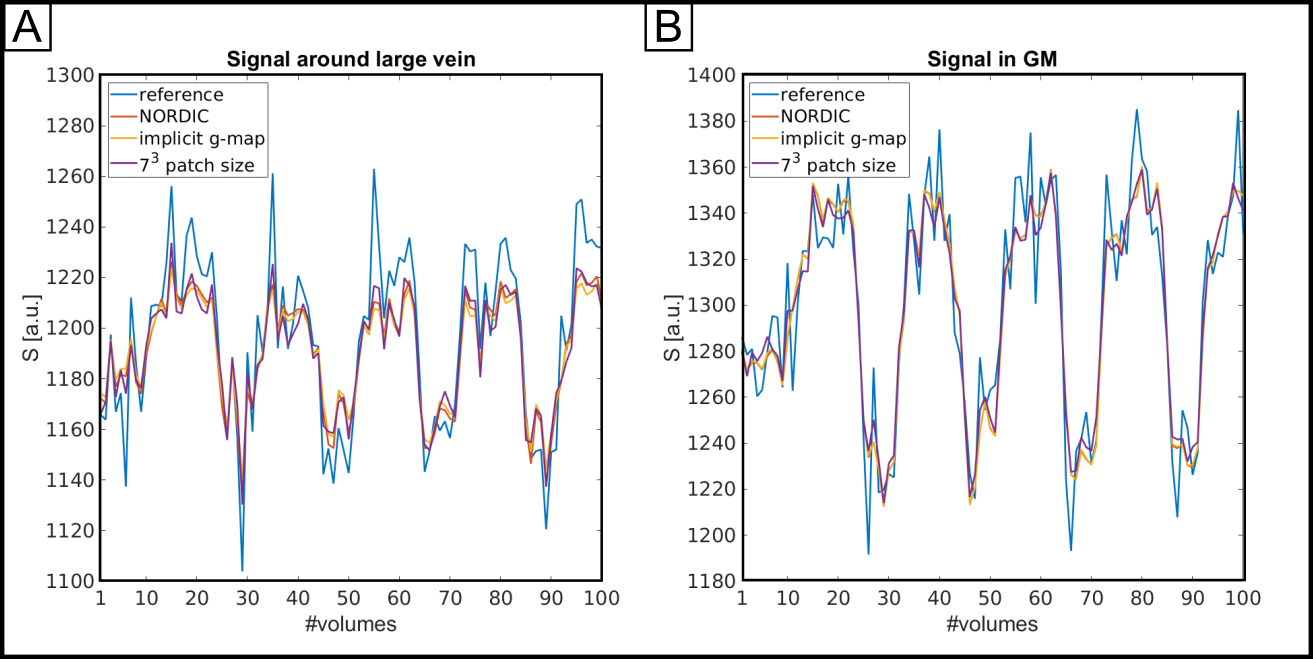
Fig.1 shows the reference reconstruction (A) and the denoised images (B-F). Fig.1G-K shows the difference between reference and denoised, divided by the respective g-factor (L, M) (images in D-F were denoised with g-factor shown in L). All difference maps exhibit no structure indicating that spatially, thermal noise was removed without introducing blurring. Noteworthy, both g-factor estimates are unrealistically high. However, their spatial pattern is to a certain extent similar. An erroneous g-map results in some bias in the noise estimation but taking complex differences reduces the effect of the g-map error.Fig.2 shows differences between beta-maps obtained from smoothed data (2.25 mm isotropic kernel). A T2* map in 4C highlights large veins. The differences indicate a mild loss of signal variations of interest. The amount scales with the assumed noise level (the higher the noise level, the worse the effect (4F,G)). A smaller patch size increases the amount of removed signal variation of interest (4H). Interestingly, the bulk of variation removal is collocated with large venous vessels (white arrows, see Fig.3).
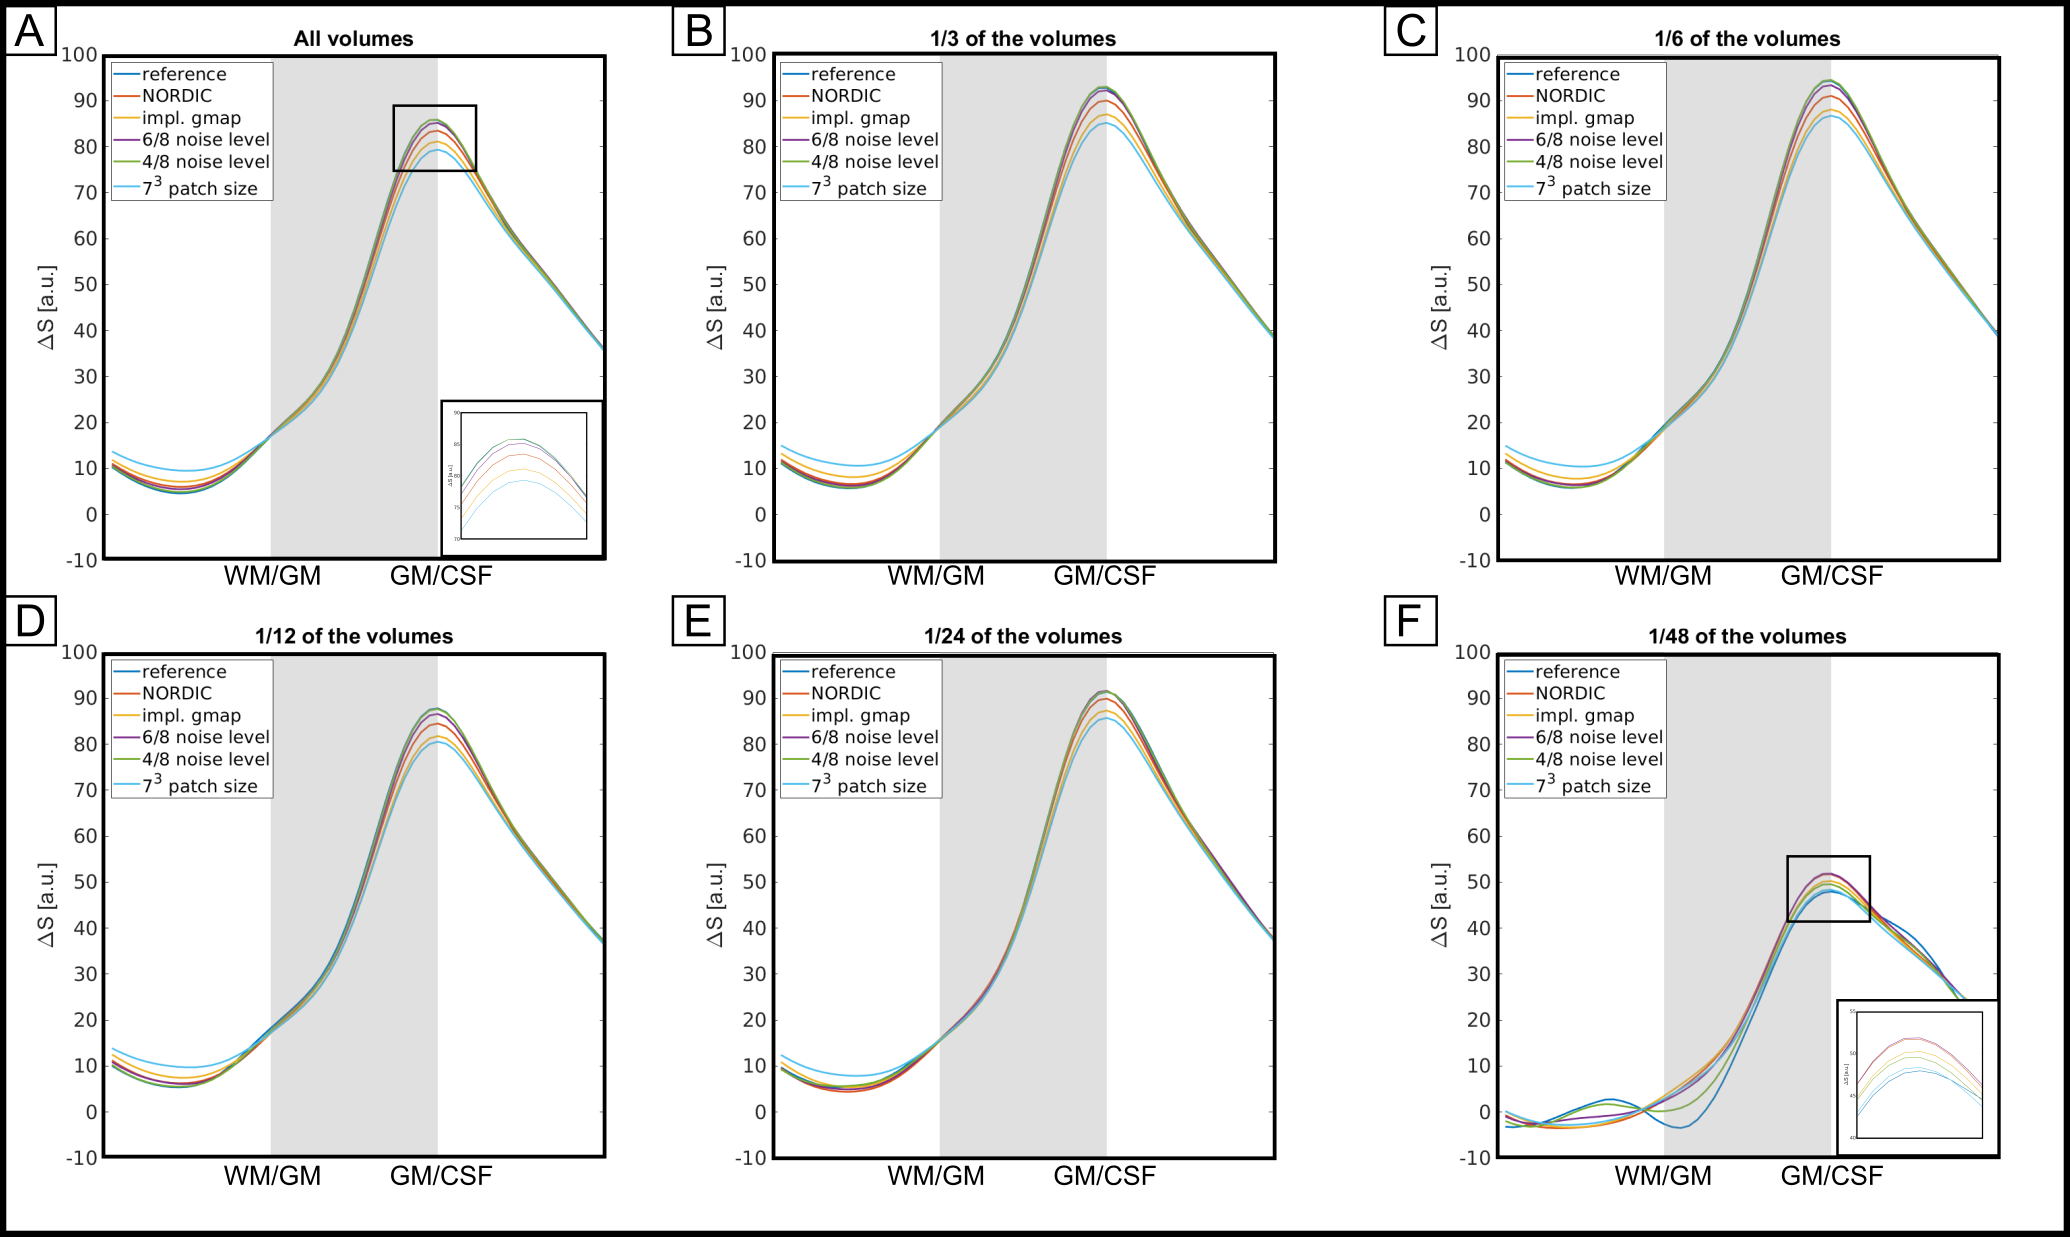
In Fig.4A, laminar profiles of signal change taken from all volumes are shown for the reference reconstruction (dark blue line, best seen in zoomed inlay) and for the NORDIC variations. With the exception of the analysis with 1/2 of the noise threshold, all variations of NORDIC affect the profiles. This effect scales with the noise threshold and the patch size. NORDIC using the implicitly estimated g-factor affects the profiles more than using the vendor-provided one. The profiles’ shape and the effect NORDIC has on them is to a large extent independent of the number of volumes used in the GLM (4B-F) until the GLM fitting becomes unreliable (4F). Here, NORDIC can recover some signal change (profiles with NORDIC more accurate than reference reconstruction).
Discussion
Our results suggest that although all investigated variations of NORDIC preserve the spatial resolution (Fig.1), NORDIC removes some signal variations of interest (Fig.2-4), in line with previouse work at 3T5. Careful g-factor and noise threshold estimation can reduce the amount of signal change reduction. Interestingly, the signal reduction effect is most visible around larger veins (Fig.2-4), the cause of this is currently unkown. Because voxels are pooled from a larger area in laminar fMRI, the final layer profiles and the effect NORDIC has on them are to a large extent independent of the number of volumes, also due to the strong effect size of the visual experiment.In summary, NORDIC removes the bulk of thermal noise but also signal changes of interest, bu this can be reduced with careful parameter adjustment. However, the overall effect of this unwanted reduction is relatively small and mostly seen at the pial surface.
Acknowledgements
The authors would like to thank Steen Moeller for making NORDIC publicly available. This work was funded by Mercur grant Ko-2021-0010 and DFG grant 432657511.References
1. Moeller, S. et al. NOise reduction with DIstribution Corrected(NORDIC) PCA in dMRI with complex-valued parameter-free locallylow-rank processing. Neuroimage 226, (2021).
2. Vizioli, L. et al. Lowering the thermal noise barrier in functional brain mapping with magnetic resonance imaging. Nat. Commun. 12, (2021).
3. Nothnagel, N. et al. VASO-fMRI with Nordic-PCA for laminar sensory testing at 7 Tesla. Proc. Intl. Soc. Mag. Reson. Med. 29 #0632, (2021).
4. Huber, L. et al. Evaluating the capabilities and challenges of layer-fMRI VASO at 3T. Proc. Intl. Soc. Mag. Reson. Med. 30 #0389, (2022).
5. Knudsen, L. et al. Feasibility of 3T layer-dependent fMRI with GE-BOLD using NORDIC and phase regression. bioRxiv 1–26 (2022).
6. Stirnberg, R. & Stöcker, T. Segmented K-space blipped-controlled aliasing in parallel imaging for high spatiotemporal resolution EPI. Magn. Reson. Med. 85, 1540–1551 (2021).
7. https://www.mathworks.com/matlabcentral/fileexchange/39350-mri- partial-fourier-reconstruction-with-pocs
8. Kashyap S. et al. Sub-millimeter resolution fMRI using Arterial Spin Labelling in humans at 7 T. PLoS ONE. 16, 1–23 (2021).
Figures