2718
Depth-dependent effects of thermal and physiological noise reduction in BOLD fMRI1MARBILab, Enrico Fermi Research Center, Rome, Italy, 2Max Planck Institute for Human Cognitive and Brain Sciences, Leipzig, Germany, 3Donders Centre for Cognitive Neuroimaging, Radboud University, Nijmegen, Netherlands, 4Fondazione Santa Lucia IRCCS, Rome, Italy, 5SAIMLAL Department, Sapienza University, Rome, Italy
Synopsis
Keywords: Data Processing, Data Analysis, Denoising, Layers
In this study, we evaluated the effect of common denoising steps (NORDIC, regression for motion parameters, RETROICOR and aCompCor) on a high-resolution resting-state BOLD fMRI dataset. We extracted the temporal standard deviation and the spectral power density at different cortical depths in the primary motor cortex and found that each denoising algorithm had a distinct signature on the profile shape. We further estimated the effect of denoising by calculating the temporal signal-to-noise ratio and delta variation signal (DVARS) for different tissue types and found that NORDIC and aCompCor had the largest impacts on the metrics considered.Introduction
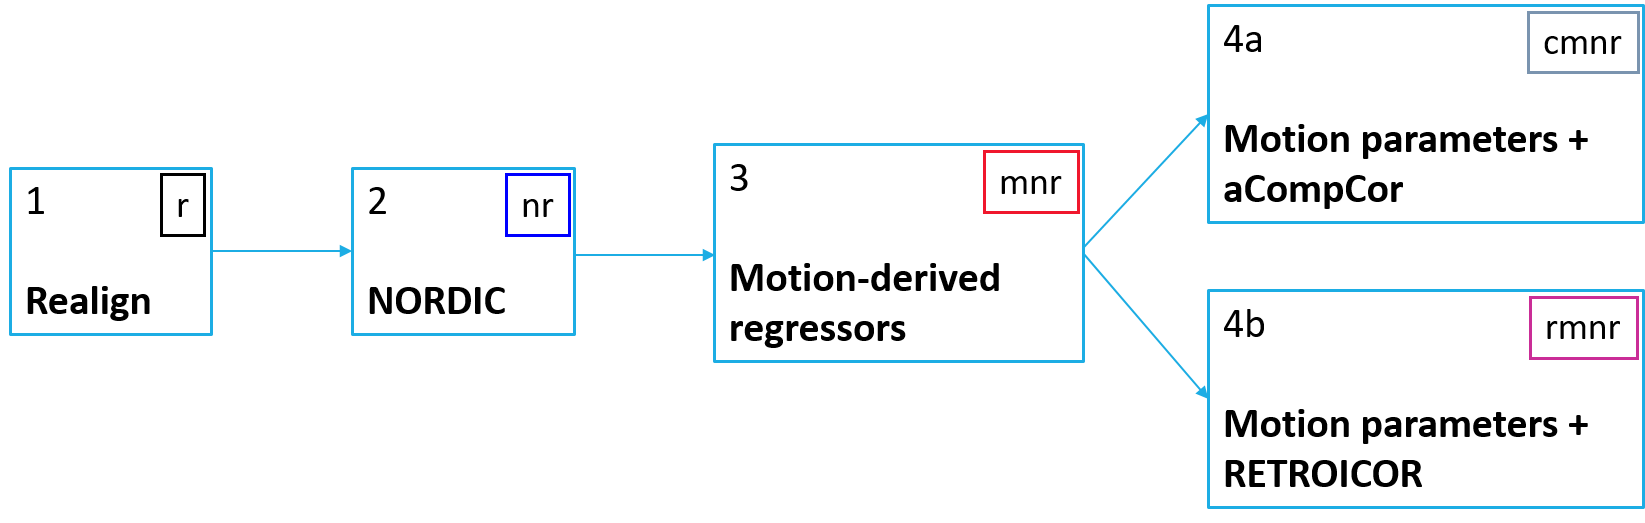
Resting-state functional MRI (rs-fMRI) data are highly affected by noise, especially for small voxel volumes [1]. In this work we applied two denoising pipelines which differ in the way they dealt with the physiological noise component: in one case RETROICOR [2] was applied, and in the other case aCompCor was used [3]. Both pipelines included the same strategies for the attenuation of thermal noise (NORDIC [4]) and motion-related noise (realignment and motion parameter regression) and, thus, differed only for the strategy used for dealing with the physiological, BOLD-like noise (RETROICOR vs aCompCor, c.f. Figure 1). In order to compare both the effect of each denoising step and the two pipelines, two metrics (temporal SNR and DVARS) were extracted and evaluated over white matter (WM), grey matter (GM) and cerebrospinal fluid (CSF). Additionally, the depth-dependent effect of the denoising steps was evaluated by calculating the temporal standard deviation (tSD) and the spectral power density over 20 (interpolated) cortical laminae in the primary motor cortex.Materials and Methods
Ten healthy participants (6 females, 4 males; age [mean±std]: 23.4±0.7) underwent a MRI session on a Siemens MAGNETOM 7T including the following sequences: 1) T1-weighted structural MP2RAGE brain volume with isotropic resolution of 0.8 mm3; 2) three consecutive repetitions of T2*-weighted gradient-echo (GRE) BOLD with a 3D echo-planar imaging readout [5], matrix size 200x200x16, spatial resolution: 0.8×0.8×1.5 mm3, TR=0.994 s, 540 volumes each run. Concomitantly to the rs-fMRI acquisitions, physiological traces (cardiac and respiratory) were recorded using two systems (BioPac and Siemens). A subset of three participants was analysed in this study. For each subject, the T1-weighted brain image from MP2RAGE was segmented in GM, WM and CSF using CAT12 [6]. The three rs-fMRI runs of each subject were realigned using FSL-mcflirt [7] and coregistered to the T1-weighted image. The steps involved in the denoising pipelines are depicted in Figure 1. Briefly, all datasets were realigned for motion, underwent thermal denoising using NORDIC (on magnitude-only data), and were regressed for motion using 24 motion regressors. In the RETROICOR pipeline, 14 RETROICOR regressors were additionally included while, in the aCompCor pipeline, a variable number of regressors (with the condition of explaining 50% of the variance) was included. A region of interest containing 20 equidistant laminae was drawn in M1 after spatial upsampling with the aid of the calculated segmentation masks and the software LAYNII [8]. The spectral power density and temporal standard deviation were calculated using FSL [7].Results
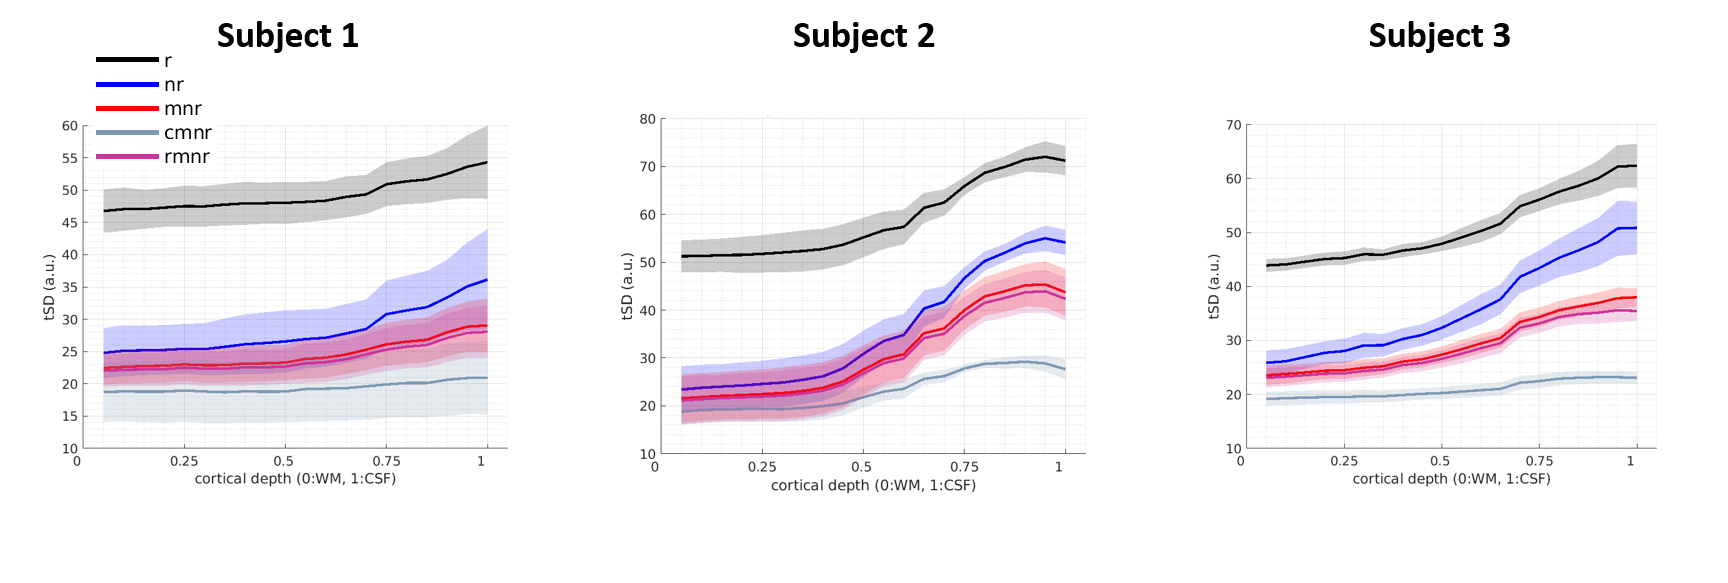
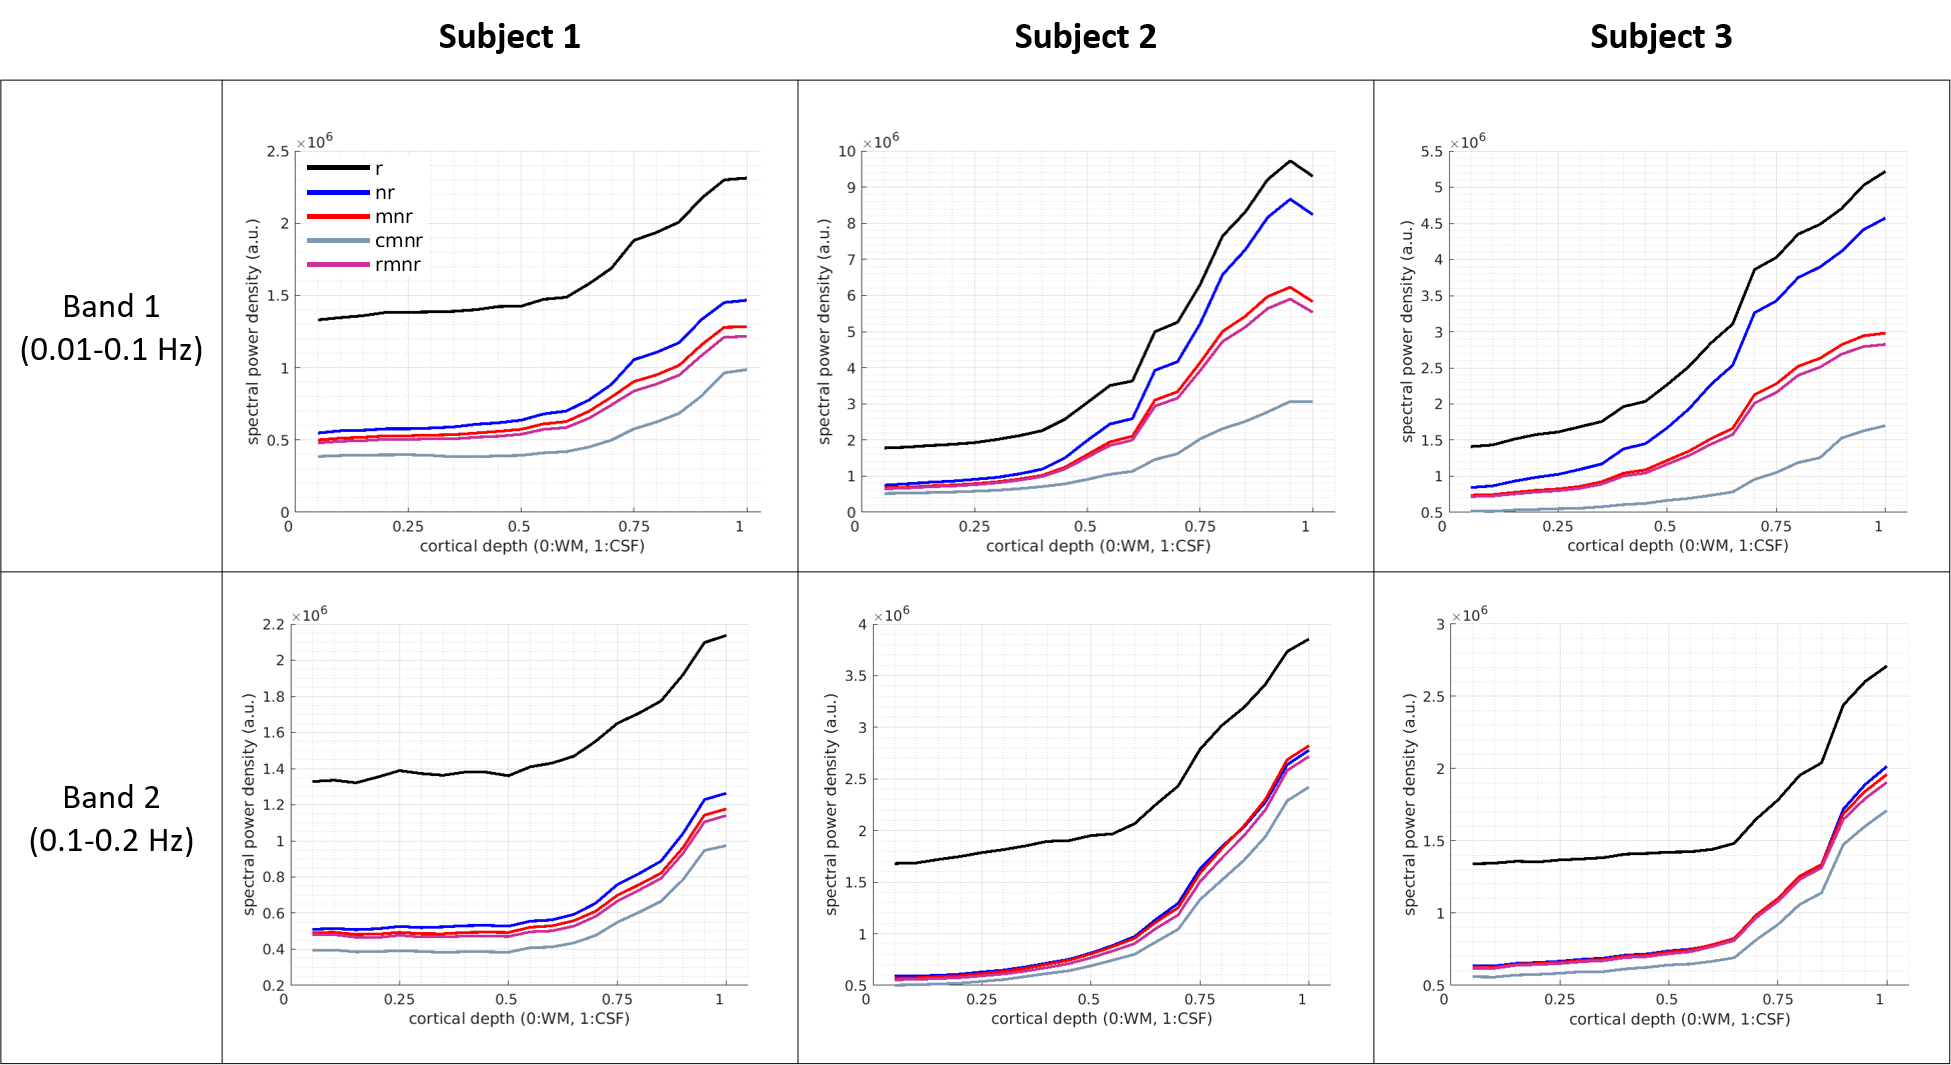
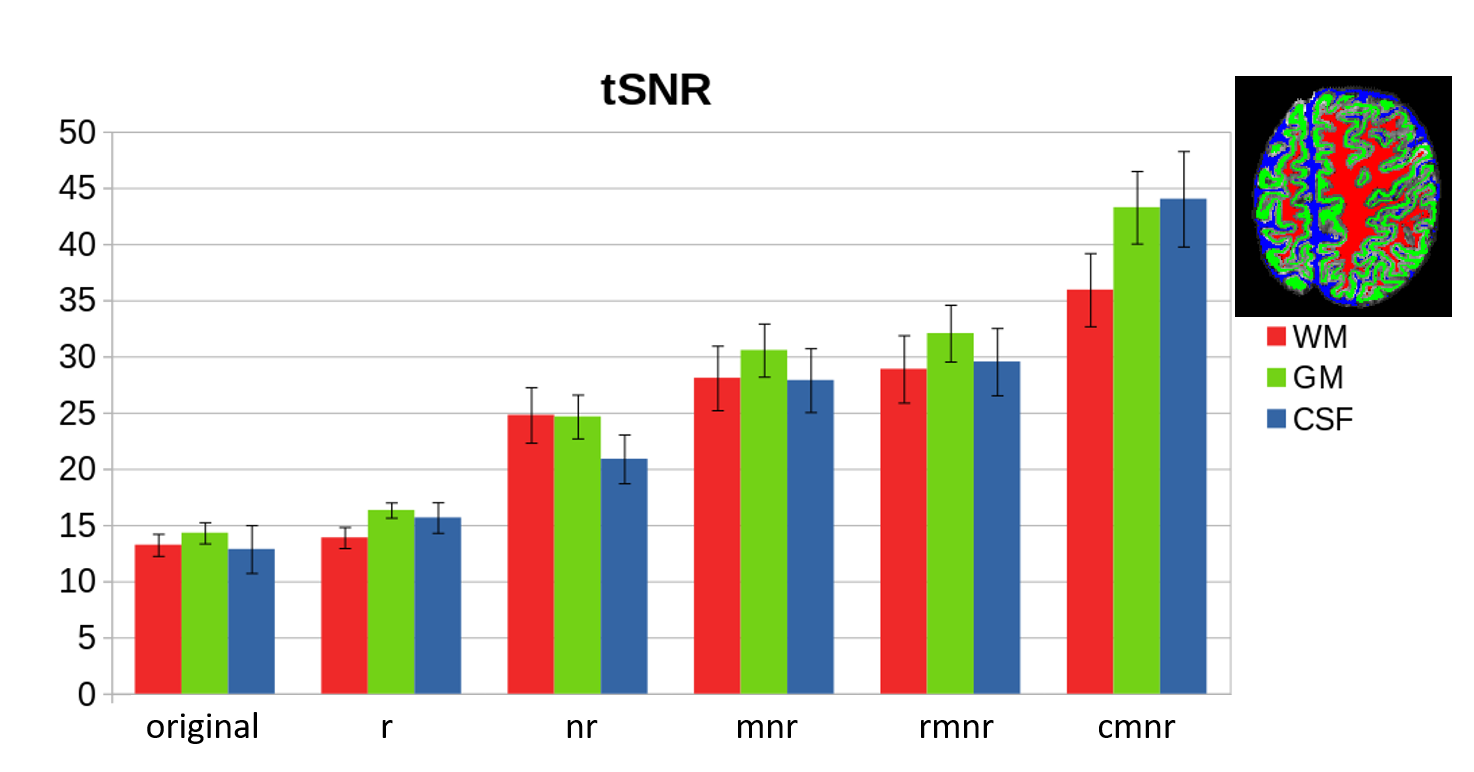
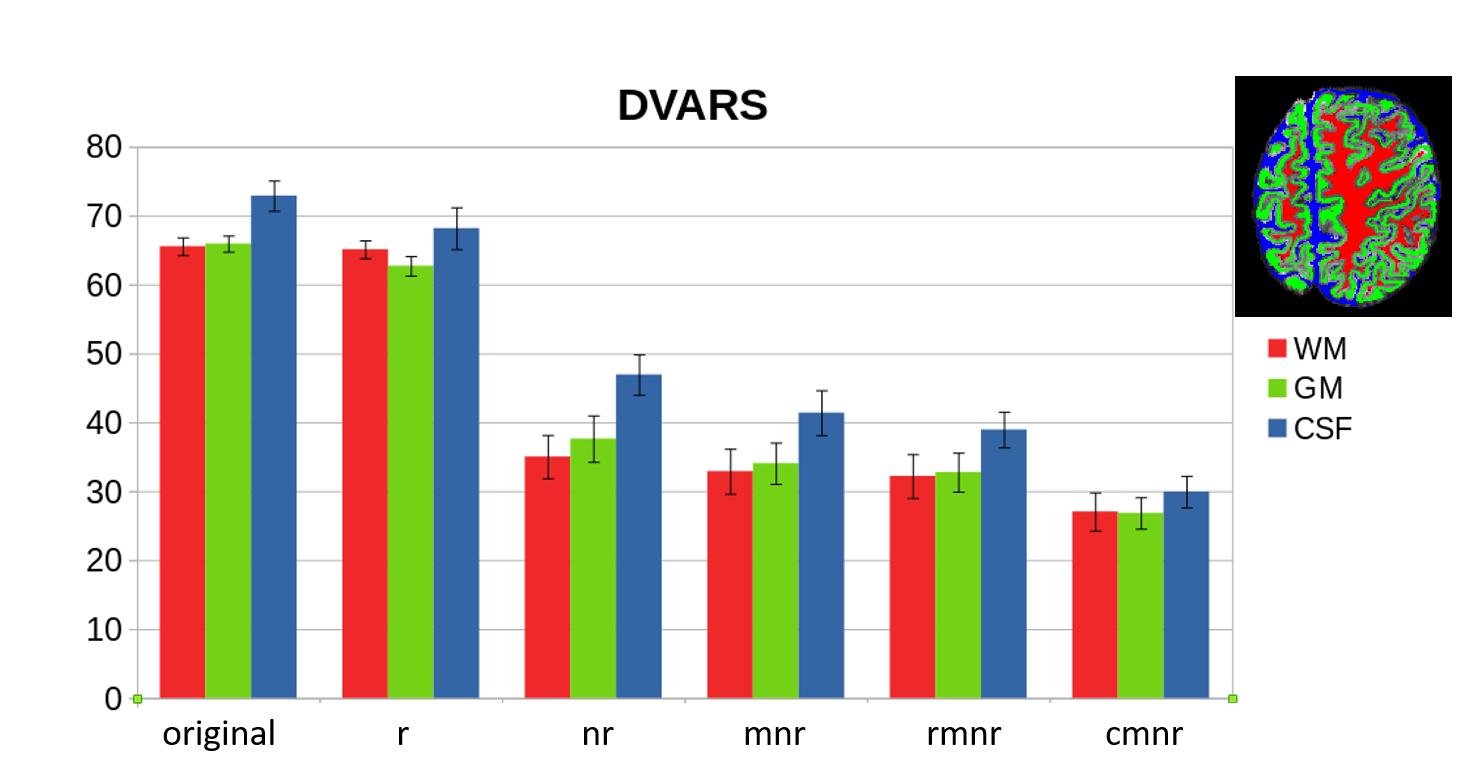
Figure 2 shows the temporal standard deviation across cortical depths for the three evaluated subjects. The origin of the x-axis denotes the WM-GM border, while ‘1’ denotes the GM-CSF border. The label on each curve indicates the denoising algorithms applied (see Figure 1). Figure 3 shows the spectral power density across cortical depths for the three evaluated subjects (columns) and for two frequency bands (rows), namely the band 0.01-0.1 Hz (band 1) and the band 0.1-0.2 Hz (band 2). Higher frequency bands (up to 0.5 Hz) were evaluated and showed a similar profile to the 0.1-0.2 Hz band (data not shown). For band 1, the denoising steps had distinct effects: NORDIC (nr) reduced the power similarly at all depths, while the denoising strategies for subject-related noise (mnr, cmnr, rmnr) reduced the power mostly in upper cortical laminae. For band 2, the spectral power density reduction was marked after the application of NORDIC (nr), while the regression for motion (mnr) and RETROICOR (rmnr) did not have a major impact; aCompCor (cmnr) had a small but visible effect. Figure 4 and Figure 5 show the change in tSNR and DVARS, respectively, for WM, GM and CSF after each denoising step. For tSNR, the steps having a larger impact were NORDIC (nr) and aCompCor (cmnr); for DVARS, NORDIC (nr) resulted in the largest reduction while the subsequent steps only slightly reduced DVARS further.Discussion
We evaluated the effect of common denoising strategies both within grey matter (on a depth-dependent basis in the motor cortex) and in WM, GM, CSF in the whole field of view. We observed that all denoising steps had an impact on the metrics considered, except for RETROICOR which showed a milder effect. Thus, the aCompCor pipeline had, in general, the largest impact on the metrics considered. In terms of cortical depths, each denoising step showed a different cortical ‘signature’: NORDIC reduced the tSD and the spectral power density in the low-frequency band to a similar extent all over the cortex, while the physiological noise reduction strategies had an effect mostly towards the cortical surface, reflecting the impact on the BOLD-like noise. The effect of the denoising pipelines on different tissue types, evaluated by tSNR and DVARS, showed that each step had a different effect depending on the tissue. Notably, aCompCor seemed to have the biggest impact on the CSF while NORDIC on the GM. Importantly, the effect of the denoising steps on tSD, tSNR, power spectral density and DVARS do not indicate whether frequencies of interest (i.e., neuronal) survived the cleaning procedure.Acknowledgements
We thank Irati Markuerkiaga and Lauren Bains for help with protocol setup and interesting discussion, Domenica Wilfling for radiographic assistance, Renzo Huber and Benedikt Poser for discussion and insights.References
1. Triantafyllou, C., et al., Comparison of physiological noise at 1.5 T, 3 T and 7 T and optimization of fMRI acquisition parameters. Neuroimage, 2005. 26(1): p. 243-250.
2. Glover, G.H., T.Q. Li, and D. Ress, Image‐based method for retrospective correction of physiological motion effects in fMRI: RETROICOR. Magnetic Resonance in Medicine: An Official Journal of the International Society for Magnetic Resonance in Medicine, 2000. 44(1): p. 162-167.
3. Behzadi, Y., et al., A component based noise correction method (CompCor) for BOLD and perfusion based fMRI. Neuroimage, 2007. 37(1): p. 90-101.
4. Vizioli, L., et al., Lowering the thermal noise barrier in functional brain mapping with magnetic resonance imaging. Nature communications, 2021. 12(1): p. 1-15.
5. Poser, B.A., et al., Three dimensional echo-planar imaging at 7 Tesla. Neuroimage, 2010. 51(1): p. 261-266.
6. Gaser, C., et al., CAT-a computational anatomy toolbox for the analysis of structural MRI data. BioRxiv, 2022.
7. Jenkinson, M., et al., Fsl. Neuroimage, 2012. 62(2): p. 782-790.
8. Huber, L.R., et al., LayNii: A software suite for layer-fMRI. NeuroImage, 2021. 237: p. 118091.
Figures