2716
Functional MRI denoising Using Data-Driven Multi-Step Deep Neural Network1Biomedical Engineering, Amirkabir University of Technology (Tehran Polytechnic), Tehran, Iran (Islamic Republic of), 2University College London, London, United Kingdom, 3Amirkabir University of Technology (Tehran Polytechnic), Tehran, Iran (Islamic Republic of)
Synopsis
Keywords: Data Processing, Brain
In this study a novel method for sampling the active and noisy areas is proposed by using the purification of gray and non-gray matter areas of fMRI data. Also, a data-driven network is proposed in a parallel, multi-step and integrated manner for optimal noise reduction of t-fMRI data. Besides, the proposed method reduces substantially physiological noise without considering the specific noise source and only by using the ROI of noise and activity. Based on the results, the proposed method provides a more accurate and improved activity map than previous methods, which increases the power of activity analysis in fMRI data.Introduction
Blood oxygen level-dependent (BOLD) functional MRI is contaminated by various sources of nuisance fluctuations[1]. Suppression of these variations improves signal-to-noise ratio (SNR) and statistical power in the fMRI data analysis. In this study, we proposed a new denoising method based on a deep neural network with optimal procedures to train the active and non-active regions. The proposed technique was compared in terms of the identifiability index on correlation($$$II_{c}$$$)[2] with a band-pass filter[3] and deep neural network (DNN) based on denoising[4]. It outperformed both approaches in terms of activity map, increasing the active voxels in the regions of interest and substantial increase and decrease of gray and non-gray matter correlation.Material & Methods
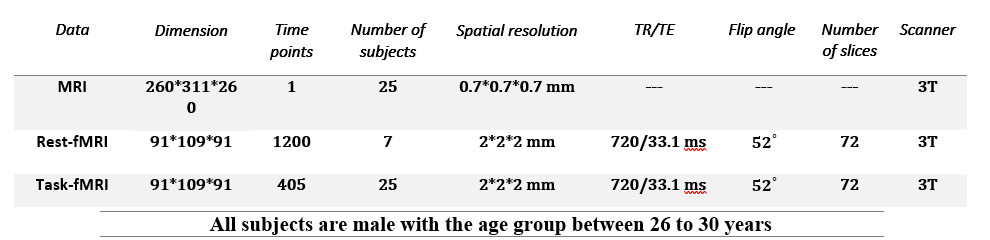
a) Simulated and real dataTo generate a training dataset, 7 data were simulated based on applying task simulation signals in specific areas [4]. For the real data, 25 healthy subjects were used from the HCP database [5] to evaluate the method. This dataset includes rs-fMRI, working memory task fMRI, and MRI. Details of imaging parameters are presented in Table1.
b) Preprocessing
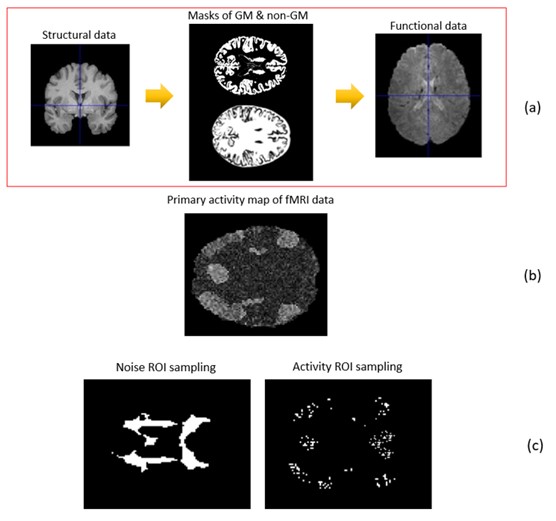
Considering that physiological noise can affect GM and non-GM fMRI data, an MRI data mask has been used to extract the ROI of noise and activity. segmentation of GM and non-GM in MRI data is probabilistically expressed, so voxels are sampled with 50% of the maximum intensity (0.5*maxintensity (GM or non-GM)). With this threshold, maximal reliability and distinction of areas during sampling are obtained for GM and non-GM tissues. In sampling, gray matter voxels should be selected according to the 90th percentile. For non-gray matter, the same number of voxels is selected due to the highest intensities as the selection of this area to remove noise(Fig.1). The $$$II_{c}$$$ metric is used to evaluate the processed data according to Eq (1)
$$$II_{c}=\frac{Corr(ROI_{GM})}{Corr(ROI_{non-GM})}$$$
where $$$Corr(ROI_{GM})$$$ and $$$Corr(ROI_{non-GM})$$$ represents the activated regions and denoised areas respectively, as a result of data processing and is used as the main metric in this study.
Neural Network
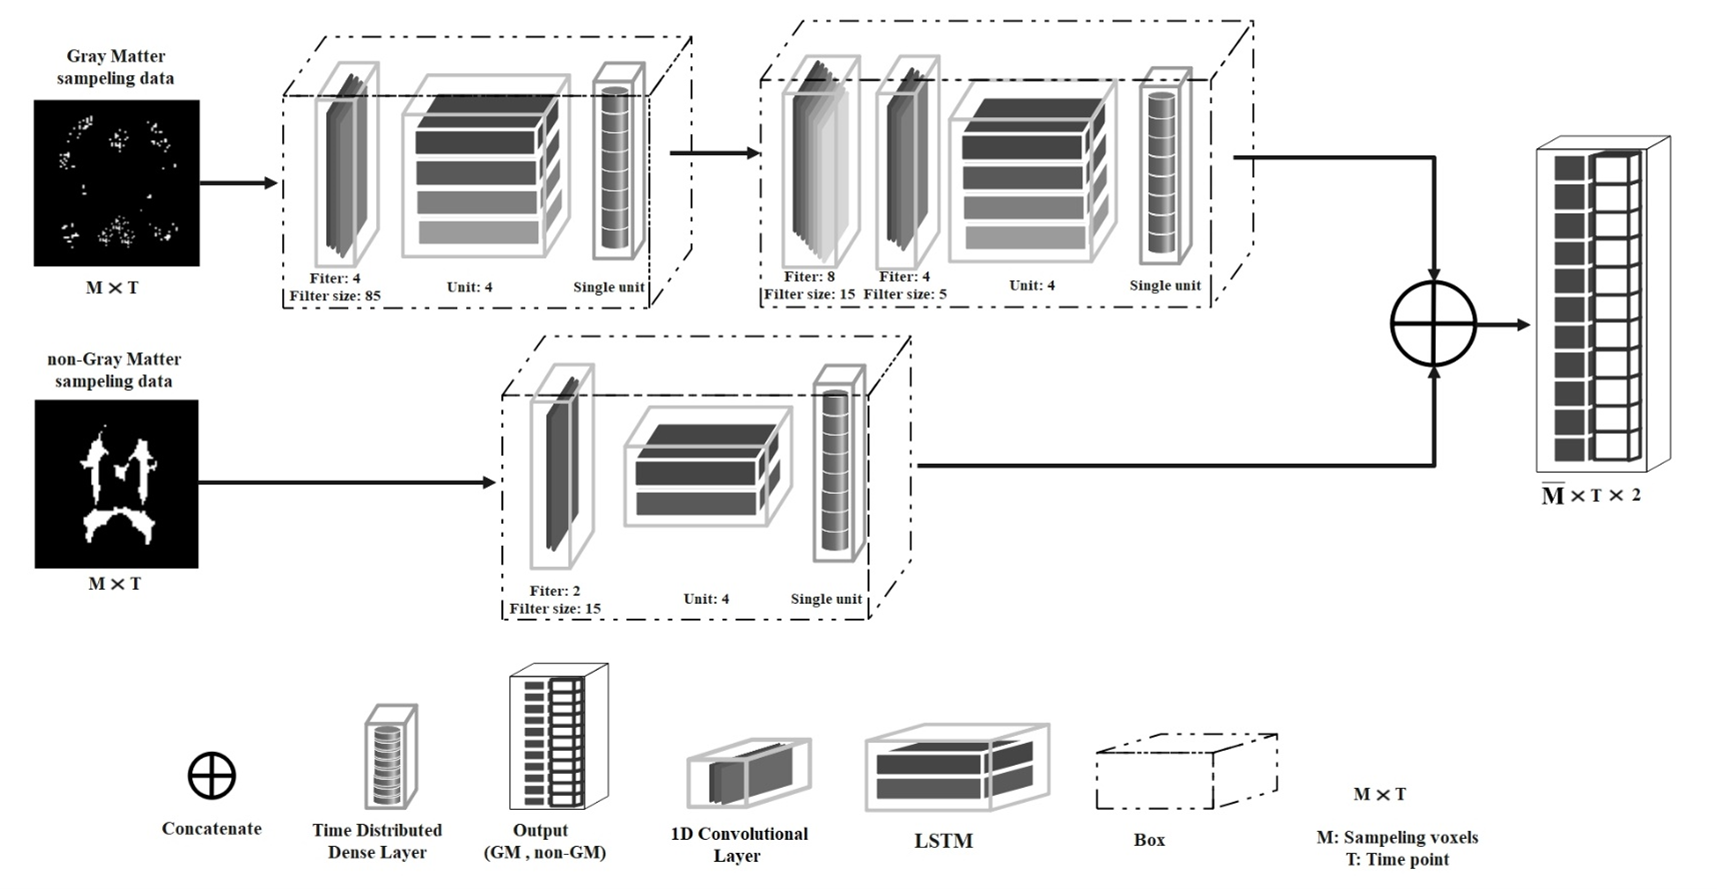
a) ArchitectureMulti-Step Deep Neural Network (MS-DNN) is based on the denoising fMRI data with the structure of two parallel networks and is shown in Fig.2. The initial model maps the gray matter (GM) time-series to the output in two steps. This is a way that increases the power of the BOLD signal in this area. The second model filters out the BOLD signal by mapping the non-GM time series in a single step. To optimize the model weights, the correlation [6] between each time point and the design matrix named GLM [7] has been used to increase and decrease the signal effect in GM and non-GM. DNN technique is a denoising method based on neural networks. In this study, the proposed MS-DNN method has been developed based on the performance of the DNN technique, and we will further examine the performance of the proposed model with band-pass filtering and DNN algorithms.
b) Training and test steps
The following parameters were used to train the MS-DNN model by the TensorFlow [8] library and the correlation-based cost function [4]. Adam optimizer [9] with learning rate η = 0.0005 was used to train the model in 20 epochs with Batch size of 750 on NVIDIA Tesla P100 GPU. To avoid overfitting the model, 10% of both input data have been used as validation.
Results
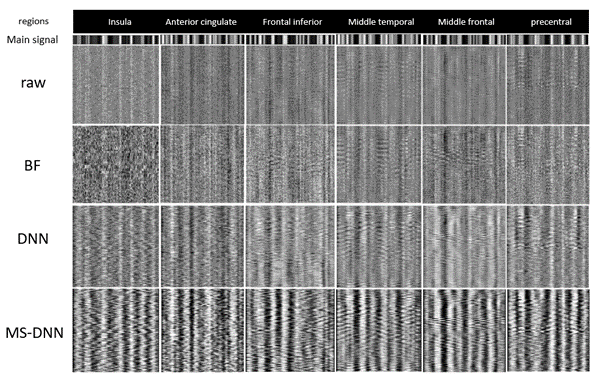
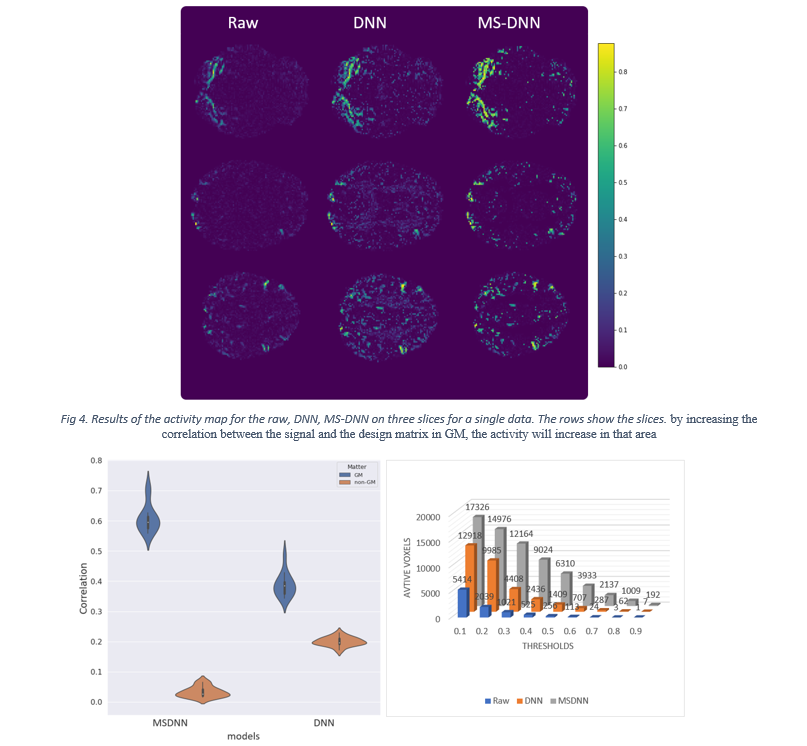
Fig.3 shows the results of the proposed model on the simulated signal in six regions. The images show the ability of the proposed method to increase the BOLD signal power in the mentioned areas. The increase and decrease of signal effect on GM and non-GM depend on the correlation between signal and design matrix. The activity map of real data has been shown in 3 slices for raw data, DNN, and MS-DNN (see Fig.4). It is evident that the proposed model boosts the activity in GM areas and attenuation the BOLD signal in non-GM. As shown in Fig.5(a), active voxel averages in various thresholds, indicating activity distribution increase in thresholds higher than 0.1 compared to raw data and the most density of raw voxels is less than 0.1 and the minority of density is at thresholds greater than 0.1. Violin Bar also shows the correlation created in GM and non-GM of the proposed model, compared to DNN according to Fig.5(b). $$$II_{c}$$$ is 22.36 and 1.93 on average for MS-DNN and DNN, respectively.Discussion and conclusion
In this study, we presented a novel method for sampling the active and noisy areas by using the purification of gray and non-gray matter areas of fMRI data to prevent false-positive in sampling. Also, we have proposed a data-driven network in a parallel, multi-step and integrated manner for optimal noise reduction of t-fMRI data, compared to conventional techniques. Since the proposed model is trained on GM and non-GM areas separately, it can substantially reduce physiological noise without considering the specific noise source and only by using the ROI of noise and activity. Therefore, MS-DNN was able to perform 20% higher in increasing and decreasing the amount of correlation in the gray and non-gray matter and provide a more accurate and improved activity map than previous methods, which increases the power of activity analysis in fMRI data.Acknowledgements
No acknowledgement found.References
1- Kasper L, Bollmann S, Diaconescu AO, Hutton C, Heinzle J, Iglesias S, Hauser TU, Sebold M, Manjaly ZM, Pruessmann KP, Stephan KE. The PhysIO Toolbox for Modeling Physiological Noise in fMRI Data. J Neurosci Methods. 2017 Jan 30;276:56-72. doi: 10.1016/j.jneumeth.2016.10.019. Epub 2016 Nov 8. PMID: 27832957.
2- Malekian, Vahid, et al. "Efficient de-noising of high-resolution fMRI using local and sub-band information." Journal of Neuroscience Methods 331 (2020): 108497.
3- Sengupta A, Pollmann S, Hanke M. Spatial band-pass filtering aids decoding musical genres from auditory cortex 7T fMRI. F1000Res. 2018 Feb 2;7:142. doi: 10.12688/f1000research.13689.2. PMID: 29707198; PMCID: PMC5887073.
4- Yang, Zhengshi, et al. "A robust deep neural network for denoising task-based fMRI data: An application to working memory and episodic memory." Medical image analysis 60 (2020): 101622." Oxidative Medicine and Cellular Longevity 2021 (2021).
5- Glasser, M., Smith, S., Marcus, D. et al. The Human Connectome Project's neuroimaging approach. Nat Neurosci 19, 1175–1187 (2016). https://doi.org/10.1038/nn.4361
6- Benesty, Jacob, et al. "Pearson correlation coefficient." Noise reduction in speech processing. Springer, Berlin, Heidelberg, 2009. 1-4.
7- Poline, Jean-Baptiste, and Matthew Brett. "The general linear model and fMRI: does love last forever?." Neuroimage 62.2 (2012): 871-880.
8- Abadi, Martín. "TensorFlow: learning functions at scale." Proceedings of the 21st ACM SIGPLAN International Conference on Functional Programming. 2016.
9- Kingma, Diederik P., and Jimmy Ba. "Adam: A method for stochastic optimization." arXiv preprint arXiv:1412.6980 (2014).
Figures