2715
Manual registration and customized template for rodent fMRI data spatial normalization
Wen-Ju Pan1, Nmachi Anumba1, Nan Xu1, Lisa Meyer-Baese1, and Shella Keilholz1
1Emory University/Georgia Institute of Technology, Atlanta, GA, United States
1Emory University/Georgia Institute of Technology, Atlanta, GA, United States
Synopsis
Keywords: Data Analysis, Brain
Rodent EPI image qualities may vary across coil types, coil positioning and different animals that challenge atlas registration. We proposed an accurate registration with study-group customized EPI template and initially manual registration with an assistance of the newly-introduced tissue-boundary atlas. Our studies demonstrated some visible mismatching in local anatomic structures by the standard registration methods for rodent data which were effectively corrected by the presented method.INTRODUCTION
Echo planar images of rodent brains exhibit considerable signal dropout near the base of the brain, which could impact the accuracy of spatial normalization to an atlas using conventional automatic registration methods. The extent and location of the signal dropout may vary across coil types, coil positioning and different animals. For example, multi-modality studies often employ a surface transceiver coil to allow access to the brain for recording, but this approach yields poor SNR in the lower brain in rodent EPI. Errors may be introduced during registration due to this partial structural loss in EPI. Areas of the brain badly affected by signal dropout may be even artificially recreated when a nonlinear warping is applied. Therefore direct automatic image registration methods with a default EPI template may not be accurate in this situation. Manual registration has been introduced in rodent fMRI to solve the issue. For example, a landmarks-based registration method in AFNI has been applied in coregistration to a rat brain atlas1 but the accuracy may be limited to structural images due to the availability of high resolution in all 3 directions. Here we propose a practical solution for reliable EPI registration to rodent atlas space without requirement of anatomical scans.METHODS
Ten SD rats (male, ~300g) were scanned with resting state fMRI under multiple anesthetic conditions (isoflurane 1-2%, dexmedetomidine, or mixed dexmedetomidine and 0.5% isoflurane) on a Bruker 9.4T horizontal bore scanner with the following parameters: GE-EPI, TR/TE=2000ms/15ms, whole brain coverage with 24 axis slices of 500 um thickness, in-plane resolution = 500um*500um, dummy scans = 10. At the beginning of the rs-fMRI scans, a few frames of EPI with reversed blips were conducted for topup distortion correction during preprocessing. All animals were paralyzed, mechanically ventilated at 1.6Hz and image acquisition was phase-locked to respiration. All individual EPI data was preprocessed before spatial normalization to the atlas, including slice timing, head motion correction, and topup distortion correction.Our approach to registration uses the internal boundaries between white matter (WM), grey matter (GM), and CSF, which are relatively unaffected by the signal dropout that can distort the outline of the brain as a whole. A digital atlas of tissue boundaries was generated from a high resolution T2w image template, i.e. SIGMA rat template2, Figure 1. The thin edges of the 3D tissue-boundary atlas are intended to be used for identifying boundaries between WM, GM, CSF and skull with minimally blocking target image. In FSLeyes, the Nudge tool was used for manual registration. For example, the target EPI image can be moved, rotated or scaled in x, y or z directions separately, i.e. 9 degree of freedom (DOF), to the atlas space based on the outlines of low-signal white matter tissues among high-signal gray matter, bright CSF ventricles and the lack of signal in the skull between high signals of skin and cortex, which are aligned with the outlines in the tissue-boundary atlas. The full brain contour was used as a reference only due to potential issues of signal dropout or partial volume effects.
In the given group rat data set, only one EPI data was manually aligned to the atlas as an initial EPI template. All individual data were firstly transformed (9 DOF affine) to the initial EPI template by automatic calculation of normalized cross-correlation, and then averaged to be used as a group-based EPI template. The new template was used in calculation again in 9- or 12-DOF affine automatic registration, illustrated in Figure 2.
We compared the registration results of the proposed manual method with the conventional automatic registration methods using the atlas-provided EPI template in both non-linear and linear algorithms. The SyN non-linear registration method has been widely employed in human brain studies, using a symmetric diffeomorphic optimizer for maximizing the cross-correlation3.
RESULTS
Customized EPI template: based on current study group of 10 rats, a customized EPI template was generated by our proposed method. As showing in Figure 3, there are visible difference in signal dropout areas due to employing a surface transceiver coil from a standard EPI template.We compared the registration results between a standard EPI template based method and our methods. The standard approach demonstrates some visible errors in anatomic correspondence, see Figure 4.
DISCUSSION/CONCLUSION
High quality spatial normalization is essential for a valid comparison of brain activity voxel-wise across subjects and longitudinally within subjects. We demonstrated that some standard automatic registration methods with Sigma EPI template are not sufficient to reliably align and match all brain structures in rats when a surface transceiver coil is employed. We proposed a customized EPI template to solve the issue using a manual registration method with the assistance of a newly-introduced tissue-boundary atlas. Our studies demonstrated some visible mismatching in local anatomic structures by the standard registration methods for rodent data which were effectively corrected by the presented method.Acknowledgements
This work was supported by NIH grants: r01mh111416, r01ns078095, and r01eb029857.References
1. Lu, H. et al. Registering and analyzing rat fMRI data in the stereotaxic framework by exploiting intrinsic anatomical features. Magnetic Resonance Imaging 28, 146–152 (2010).
2. Barrière, D. A. et al. The SIGMA rat brain templates and atlases for multimodal MRI data analysis and visualization. Nature Communications 2019 10:1 10, 1–13 (2019).
3. Avants, B. B., Epstein, C. L., Grossman, M. & Gee, J. C. Symmetric diffeomorphic image registration with cross-correlation: Evaluating automated labeling of elderly and neurodegenerative brain. Medical Image Analysis 12, 26–41 (2008).
Figures
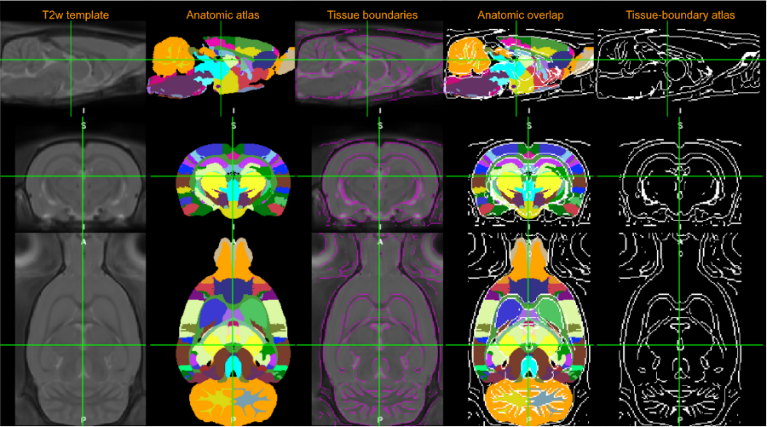
Fig. 1. Tissue-boundary atlas.
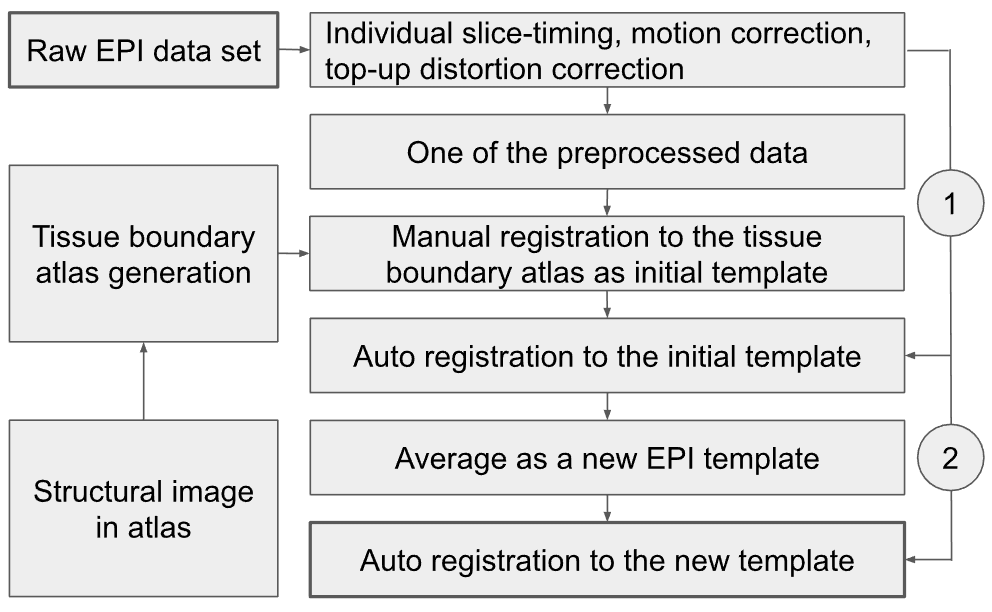
Fig. 2. Schematic illustration of accurate atlas
registration using a group-based template.
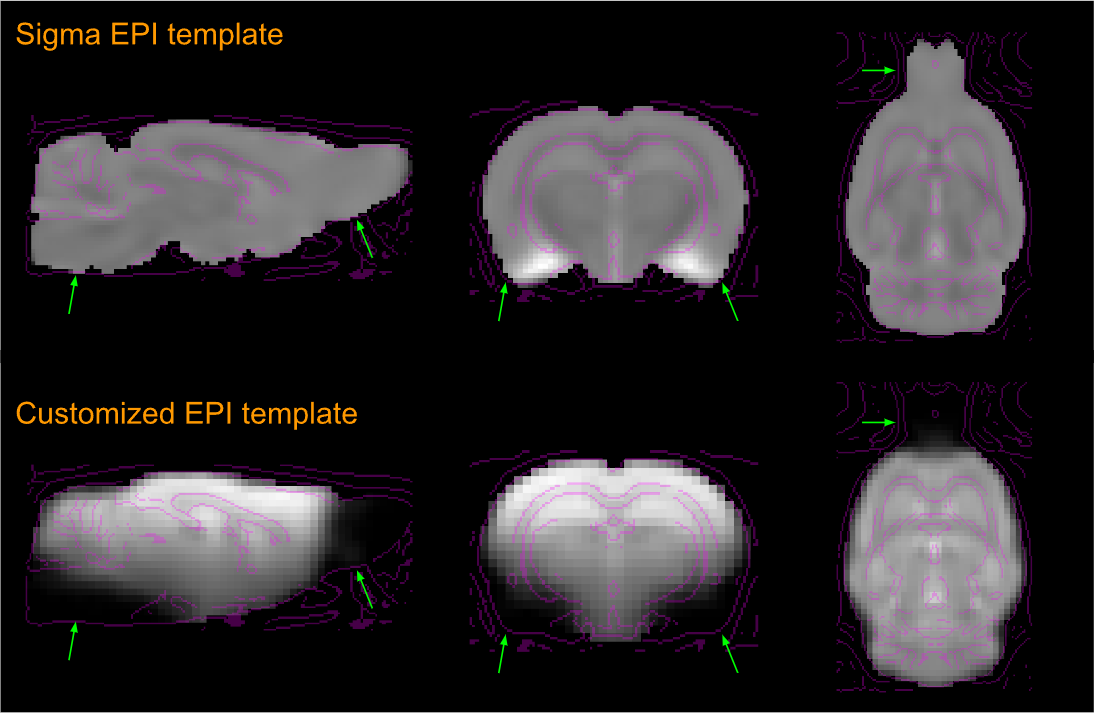
Fig. 3. Comparison between the current study rats’
group-based EPI template and a standard EPI template. Due to the transceiver
surface coil employed, some anatomic areas (arrow heads), such as those lower
brain areas above air cavities, brain stem and olfactory bulb, exhibit obvious
signal loss, shown in an average EPI image that was taken as a customized
template to replace the standard Sigma EPI template for a specific study data
set.
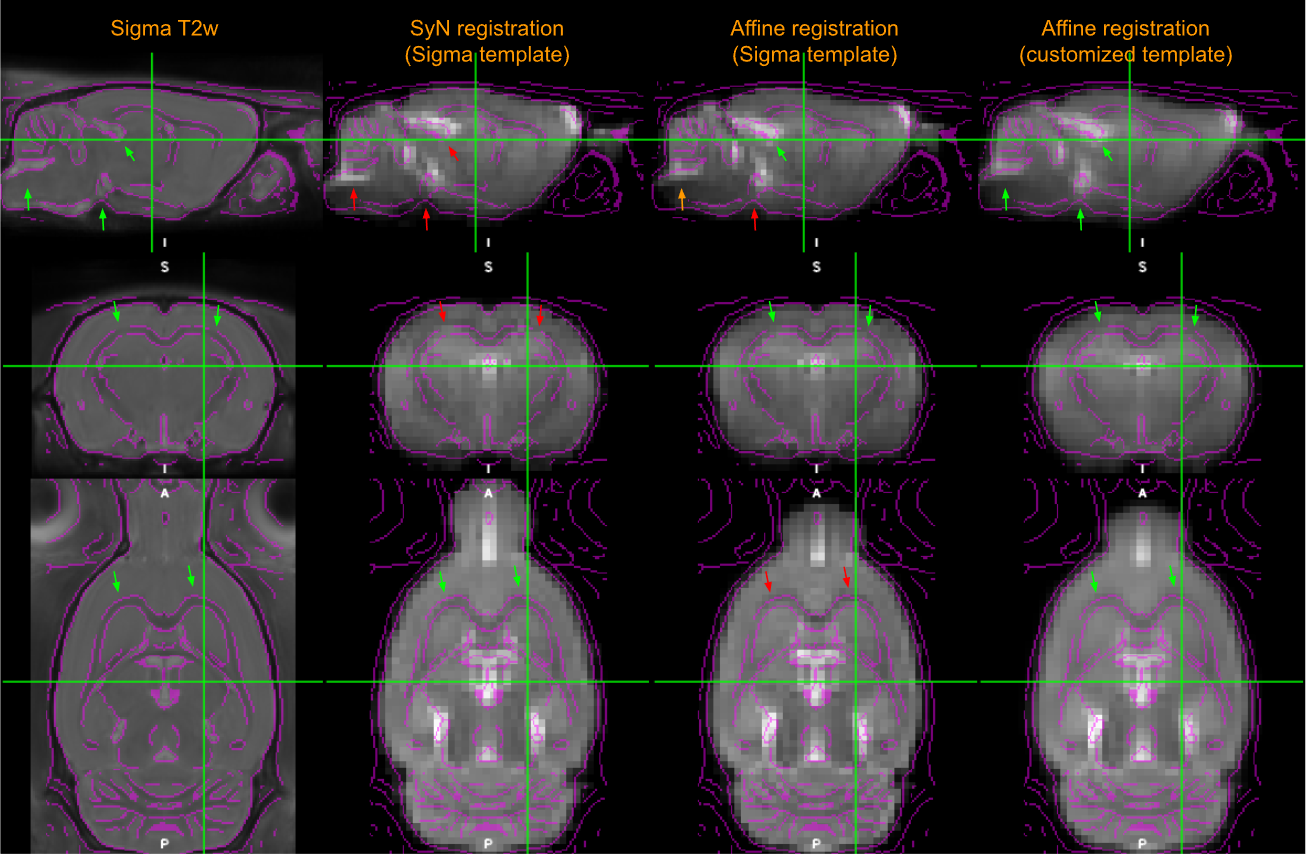
Fig. 4. Comparison of registration accuracy. The local registration accuracy is indicated by colored arrows
as green (good), yellow (marginal) and red (bad). The main ventricles (first row) and hippocampus (second row) exhibit visible deviation by Sigma-template SyN , caudate putamen issue in Sigma-template affine method, but best accuracy by customized-template
affine transformation.
DOI: https://doi.org/10.58530/2023/2715