2713
fMRI signal characteristics underlying human white-matter functional connectivity1Rotman Research Institute, Baycrest Health Sciences, Toronto, ON, Canada, 2Athinoula A. Martinos Center for Biomedical Imaging, Department of Radiology, Harvard Medical School, Massachusetts General Hospital, Boston, MA, United States, 3Department of Medical Biophysics, University of Toronto, Toronto, ON, Canada, 4Department of Biomedical Engineering, University of Toronto, Toronto, ON, Canada
Synopsis
Keywords: Data Analysis, White Matter, fMRI, functional connectivity, Fourier analysis, Human Connectome Project
In this study, we illustrate the BOLD fMRI signal characteristics underlying functional correlations in the white matter of healthy adults. We use a group-level white-matter only Pearson’s correlation matrix to identify several high-connectivity regions of interest. Our results show that the BOLD signal spectra of connected white-matter regions contain a low-frequency peak unseen in unconnected regions.Introduction
The cerebral white matter (WM) takes up 50% of the human brain volume, and yet, in vivo studies of its functional physiology are scarce. Detecting brain activation in white matter (WM) using blood-oxygenation level-dependent (BOLD) fMRI data is a topic of growing interest 1-6. Due to the sparse vascularization of the WM, both the robustness and specificity of WM BOLD activation are intrinsically low. Moreover, the physiological interpretation of WM BOLD fMRI signals is still unclear. Due to the low BOLD sensitivity of WM, BOLD fMRI signals in the WM can easily be attributed to physiological noise. As a first step in the attempt to address these challenges/questions, this work aims to characterize the BOLD signal components relevant to correlation-based functional connectivity in the WM in the healthy brain. We also illustrate the ability of BOLD fMRI to capture anatomically meaningful WM connectivity patterns, many of which are associated with specific BOLD signal characteristics.Methods
ParticipantsHere we report findings from the 10 youngest healthy participants (equal males and females) selected from the Human Connectome Project’s Aging dataset 7 (mean age = 36.6 years).
fMRI Data Acquisition
The fMRI data were acquired according to the experimental protocols of the Human Connectome Project using a Siemens 3T Prisma scanner with 80 mT/m gradient coil. Participants in the Aging group (HCP-A) were scanned using the vendor 32-channel head coil. fMRI scans were acquired with a 2D multiband gradient-recalled echo echo-planar imaging sequence (TR/TE = 800/37 ms, flip angle = 52°, 184 frames) and 2.0 mm isotropic voxels that covered the whole brain. During the fMRI scans, a visual task was performed, beginning with an 18-s fixation block followed by 3 active blocks, each consisting of 27 s of flashing checkerboards separated by an 18-s fixation block.
Data Processing
The BOLD data were preprocessed using FSL for motion correction, slice-timing correction, then normalized and demeaned such that all values in the time series are provided in units of %BOLD. T1-weighted anatomical images were used for brain extraction and creating masks for WM, GM and CSF.
Analysis
The Johns Hopkins University ICBM labels (2mm isotropic)8 were used to create masks of the WM regions of the brain. The time series for each of these regions were then extracted using an in-house MATLAB script and used to calculate a Pearson’s correlation matrix to visualize the connectivity between WM regions for each subject. Additionally, a group-level correlation matrix was created using an aggregate time series determined by concatenating the time series for each subject. We focused on identifying regions of high correlation and identifying their anatomical location to determine significance. Moreover, regions of high correlation (ROIs) were identified on the aggregate correlation matrix, and the time series from these regions were extracted from the aggregate matrix for conducting a principal component analysis (PCA), and a Welch’s power density estimate9 was conducted on the two leading principal components for each region to determine the main frequency components.
Results
The WM functional connectivity matrix of the aggregate fMRI time series is shown in Fig. 1, in which five blocks of high connectivity (ROIs) are identified and labeled. The ROIs are also illustrated in MNI space in Fig. 2, and their functional-connectivity structures summarized in Fig. 3. The Welch’s spectrum (periodogram) for these 5 ROIs plus the remaining regions are shown in Fig. 4. For all regions the Welch’s frequency spectra of 2 largest PCs (account for the largest amount of variance in the BOLD time series) are shown (PC1 and PC2). Note that the largest PC (PC1) of all connected ROIs display two prominent peaks at approximately 0.02 and 0.05 Hz, respectively (indicated by dashed lines). This 0.05 Hz peak is not always visible in the PC2’s. Moreover, in the regions without prominent connectivity, there is only the peak at 0.02 Hz but no peak at 0.05 Hz (also indicated by dashed lines). Lastly, this frequency is not the frequency of the visual task.Discussion and Conclusion
Previous literature has suggested the existence of functional networks in the WM2,3 and the activation structure in event-related stimulation4, but much is still unknown about the repeatability and interpretation of these findings. This study presents a preliminary investigation of the anatomical and signal-power signatures of BOLD fMRI in the WM. The ROI delineations care relatively coarse, and neighbouring tracts could exhibit partial-volume effects that have contributed to their connectivity. Also, these findings remain vulnerable to the confounding partial-volume effects with the GM and CSF. Nonetheless, in this early study, the identification of coherent anatomically consistent WM clusters using BOLD fMRI is encouraging. The connectivity structures are not entirely driven by high likelihood of partial-voluming with each other (e.g. the cerebrospinal tract and internal capsule are not functionally correlated). Furthermore, the spectral differences between the BOLD signals from such clusters and those from non-connected WM regions also suggest a valid physiological origin of the identified WM connectivity patterns. Our future work will further investigate the extent of GM and large-vein influences on these patterns, as well as the biological interpretation of the 0.05 Hz frequency signature.Acknowledgements
No acknowledgement found.References
1. Wu TL, Wang F, Anderson AW, Chen LM, Ding Z, Gore JC. Effects of anesthesia on resting state BOLD signals in white matter of non-human primates. Magn Reson Imaging. 2016 Nov 1;34(9):1235–41.
2. Huang Y, Yang Y, Hao L, Hu X, Wang P, Ding Z, et al. Detection of functional networks within white matter using independent component analysis. Neuroimage. 2020 Nov 15;222:117278.
3. Guo B, Zhou F, Li M, Gore JC. Latency structure of BOLD signals within white matter in resting-state fMRI. Magn Reson Imaging [Internet]. 2022 Jan; Available from: https://linkinghub.elsevier.com/retrieve/pii/S0730725X21002617
4. Li M, Newton AT, Anderson AW, Ding Z, Gore JC. Characterization of the hemodynamic response function in white matter tracts for event-related fMRI. Nat Commun. 2019 Mar 8;10(1):1–11.
5. Viessmann O, Tian Q, Bernier M, Polimeni JR. Static and dynamic BOLD fMRI components along white matter fibre tracts and their dependence on the orientation of the local diffusion tensor axis relative to the B0-field [Internet]. Journal of Cerebral Blood Flow & Metabolism. 2022. p. 0271678X2211062. Available from: http://dx.doi.org/10.1177/0271678x221106277
6. Mazerolle EL, D’Arcy RCN, Beyea SD. Detecting functional magnetic resonance imaging activation in white matter: interhemispheric transfer across the corpus callosum. BMC Neurosci. 2008;9:84.
7. Harms MP, Somerville LH, Ances BM, Andersson J, Barch DM, Bastiani M, et al. Extending the Human Connectome Project across ages: Imaging protocols for the Lifespan Development and Aging projects. Neuroimage. 2018 Dec;183:972–84.
8. Oishi K, Zilles K, Amunts K, Faria A, Jiang H, Li X, et al. Human brain white matter atlas: identification and assignment of common anatomical structures in superficial white matter. Neuroimage. 2008 Nov 15;43(3):447–57.
9. Welch P. The use of fast Fourier transform for the estimation of power spectra: A method based on time averaging over short, modified periodograms. IEEE Trans Audio Electroacoust. 1967 Jun;15(2):70–3.
Figures
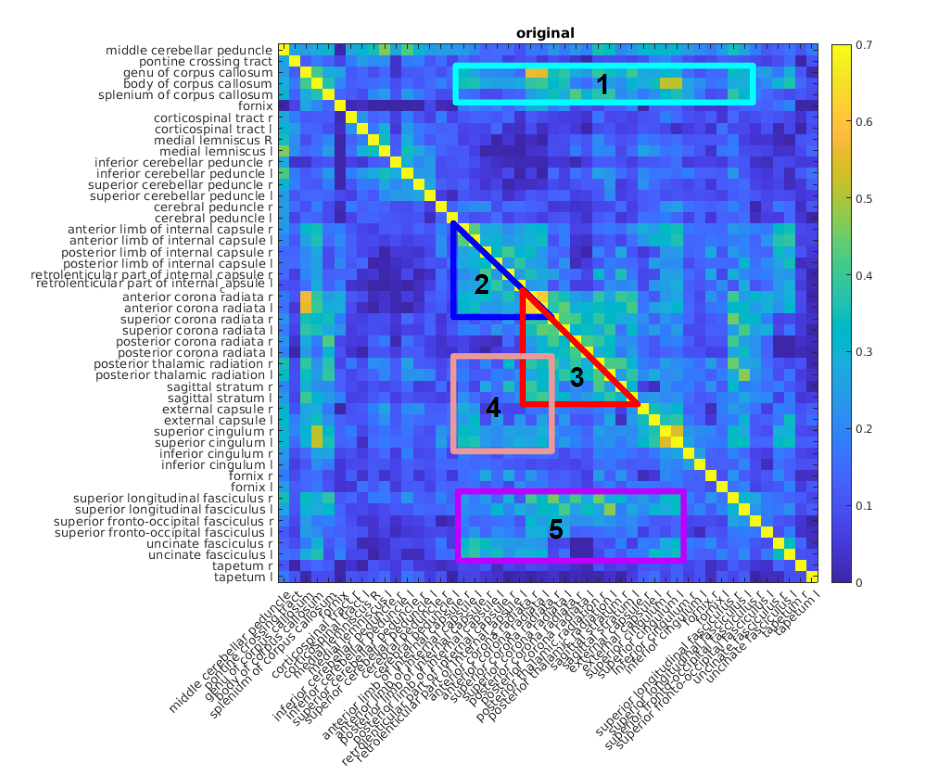
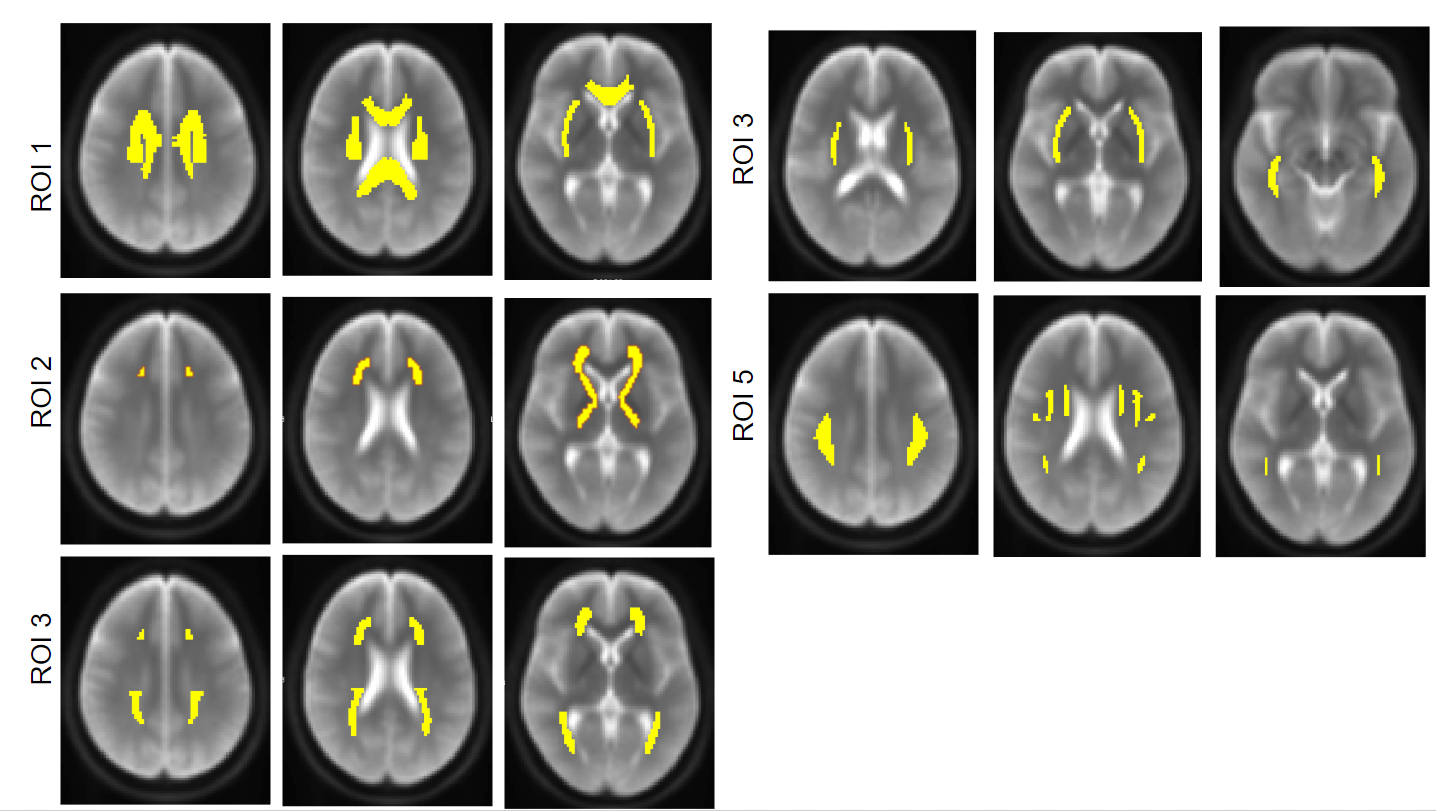
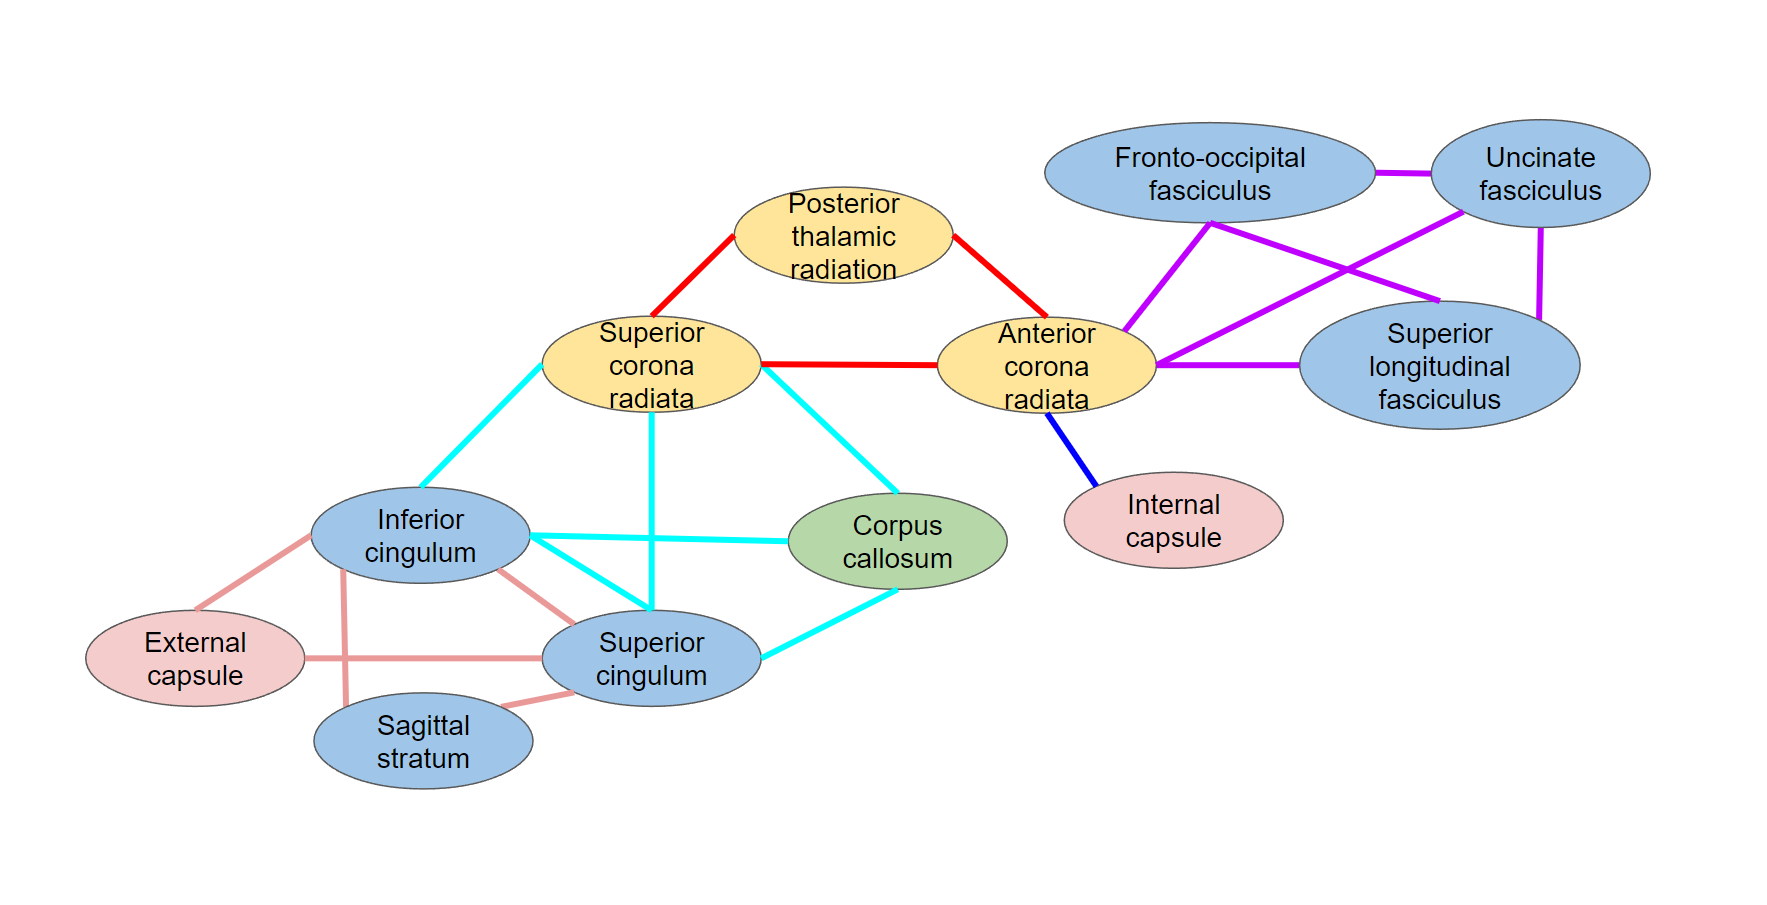
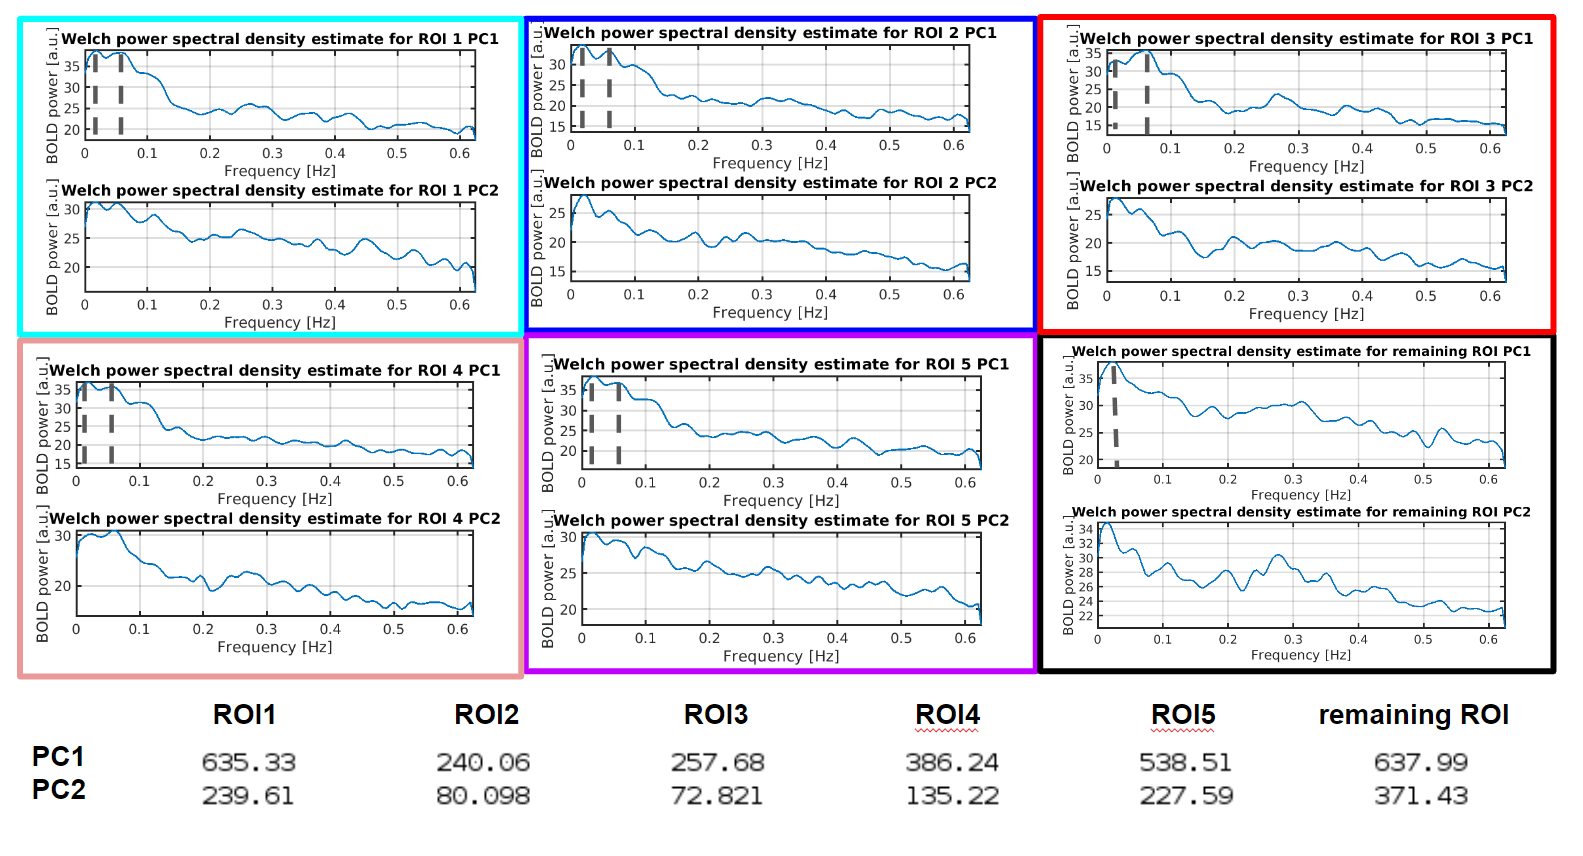
Figure 4. Welch’s spectrum (periodogram) for the 5 regions of interest (ROIs) indicated in Fig. 1, plus the remaining regions. For all regions the Welch’s frequency spectra of 2 largest PCs are shown, with their variances summarized in the table below the plots. Note that the leading PCs (PC1’s) of all connected ROIs display a prominent peak at approximately 0.05 Hz (indicated by dashed line). This peak is not always visible in the PC2’s. Moreover, in the regions without prominent connections, there is no peak at 0.05 Hz (also indicated by dashed lines).