2712
Using interpretable deep learning on task fMRI data to understand brain regions related to working memory - a repeatability study
Tianyun Zhao1, Philip Tubiolo1,2, Thomas Hagan1, John C. Williams1,2, Jared Van Snellenberg2,3,4, and Chuan Huang1,4
1Biomedical Engineering, Stony Brook University, Stony Brook, NY, United States, 2Psychiatry and Behavioral Health, Renaissance School of Medicine at Stony Brook University, Stony Brook, NY, United States, 3Psychology, Stony Brook Univeristy, Stony Brook, NY, United States, 4Radiology, Renaissance School of Medicine at Stony Brook University, Stony Brook, NY, United States
1Biomedical Engineering, Stony Brook University, Stony Brook, NY, United States, 2Psychiatry and Behavioral Health, Renaissance School of Medicine at Stony Brook University, Stony Brook, NY, United States, 3Psychology, Stony Brook Univeristy, Stony Brook, NY, United States, 4Radiology, Renaissance School of Medicine at Stony Brook University, Stony Brook, NY, United States
Synopsis
Keywords: Machine Learning/Artificial Intelligence, fMRI (task based)
Deep learning, especially convolutional neural networks (CNN), has been shown to be able to identify the non-linear relation between functional magnetic resonance imaging (fMRI) and task performance. CNN can generate an interpretable result called saliency map highlighting regions that are important for task performance. It can uncover other neural processes that linear modeling cannot due to the high dimensionality nature of the fMRI. The CNN result can be presented as a saliency Previously, we developed a pipeline to produce the saliency map for working memory tasks. In this work, we further evaluated the repeatability of our pipeline.Introduction
Working memory (WM) describes the temporary, readily accessible storage, and manipulation of information that is key for decision-making and comprehension1. WM is an aspect of cognition that is often disrupted across a wide range of psychiatric and neurological disorders. Standard generalized linear modeling has been utilized to model functional magnetic resonance imaging (fMRI) task data and has shown regions activated in WM tasks. However, detecting non-linear relationships betweens fMRI region activation and task performance, as may exist in high-dimensionality fMRI data, may reveal other WM-associated neural processes that are difficult or impossible to detect using standard linear modeling techniques.Deep learning (DL) using convolutional neural networks (CNN) can provide a non-linear analyses of fMRI data. While CNNs are conventionally treated as a "black box", novel advances in computer vision may permit meaningful interpretation of how a network produces a result. A saliency map is a visual representation of the gradient backpropagation process during CNN training and allows the identification of brain regions that drive network performance the most. We have previously developed an interpretable DL network to produce saliency maps that reflect network performance for input cortical fMRI data with interesting results. However, due to the nature of a CNN, network results may vary each time it is trained.
In this work, we assessed the performance and repeatability of our DL model to predict WM subconstruct scores using fMRI data from a WM task.
Methods
A total of 308 fMRI scans from the Human Connectome Project (HCP)2 were used. Subjects were healthy young adults with no history or familial connection to a psychiatric disorder. Cortical 2-back minus 0-back t-contrast maps from an n-back working memory task were collected and stored in CIFTI format containing >60,000 vertices for left and right cortical surface information per subject.The left and right hemispheres were combined into a single 2D image as the input to our CNN. We utilized an architecture similar to VGG network3 containing multiple convolutional blocks followed by numerous fully connected layers, as shown in Figure 1. The network was trained to predict working memory subconstruct scores on the 2-back condition for each participant. We randomly split the data into training, validation, and testing based on a 3:1:1 ratio.
We trained 5 independent networks that were initialized randomly to verify if high salience regions were repeated across different runs. Saliency maps were generated via backpropagation and smoothed using the SmoothGrad algorithm to reduce spatial noise4. The Pearson correlation between each average saliency map from each run was calculated to verify the similarity. To confirm that the region of "high salience" across five runs was crucial for prediction, an average saliency map was calculated from the 5 runs. Two masks were generated by thresholding the saliency map to be above and below the median and were applied to the input fMRI data. Finally, a post-hoc analysis was performed by training a new model for each of the masks.
Results
The CNN performance was slightly different between each run, with a mean R2 of 0.3118 and a standard deviation of 0.0209. The CNN achieved an average mean absolute error (MAE) of 7.025 (standard deviation (SD):0.1076), average mean absolute error percentage error (MAPE) of 8.742 (SD:0.9113), and the root mean square error (RMSE) of 8.561 (SD: 0.06055). The detailed result for each run is shown in Table 1, and the average saliency map for each run is shown in Figure 2. The Pearson correlation is high (>0.9) between all runs except the 4th run, as shown in Figure 3. However, the 4th run still has a correlation coefficient above 0.84 compared with other runs.The performance of the post-hoc networks trained with masks generated from low and high-thresholded salience is shown in Table 2. The model trained with fMRI data below the median mask achieved an R2 of 0.1931, MAE of 7.544, MAPE of 9.50, and RMSE of 9.084. The model trained with fMRI data above the median mask achieved an R2 of 0.3101, MAE of 6.887, MAPE of 8.623, and RMSE of 8.524.
Discussion
Our results show that, with randomly initialized weights, our CNN saliency maps will pick up regions that are slightly different each time but with high similarity. The quantitative result such as R2, MAE, MAPE, and RMSE and correlation confirmed this similarity. Thus, repeated runs of our model can provide a more reliable average saliency map showing the important region for working memory compared with just a single run.The post-hoc analysis revealed interesting reliability in the high-thresholded saliency mask while showing performance loss in the low-thresholded mask. The high-thresholded mask included regions such as the premotor cortex and the default-mode network. This acts as a proof of concept that the high activation saliency regions are key contributors to both the model’s prediction and accuracy since the model performed better without the presence of the low salience regions.
Conclusion
We assessed the reliability of the network's saliency map to prove that CNN has the potential to be used as novel and reliable means to gain insight into brain regions whose activation is associated with task performance.Acknowledgements
This work was funded by NIH grants R01MH120293 to JXVS and F30MH122136 to JCW.References
1. Baddeley A. Working memory. Current Biology. 2010 Feb 23;20(4):R136–40.2. Van Essen DC, Ugurbil K, Auerbach E, Barch D, Behrens TEJ, Bucholz R, et al. The Human Connectome Project: A data acquisition perspective. Neuroimage. 2012 Oct 1;62(4):2222–31.
3. Simonyan K, Zisserman A. Very Deep Convolutional Networks for Large-Scale Image Recognition [Internet]. arXiv; 2015 [cited 2022 Nov 8]. Available from: http://arxiv.org/abs/1409.1556
4. Smilkov D, Thorat N, Kim B, Viégas F, Wattenberg M. SmoothGrad: removing noise by adding noise [Internet]. arXiv; 2017 [cited 2022 Nov 9]. Available from: http://arxiv.org/abs/1706.03825
Figures
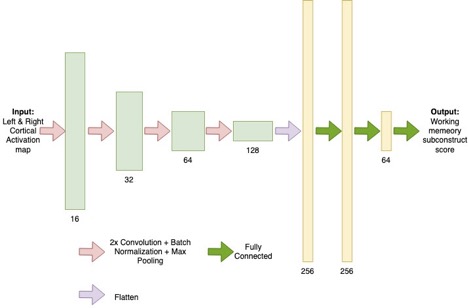
Figure 1. The network structure for the CNN
model.
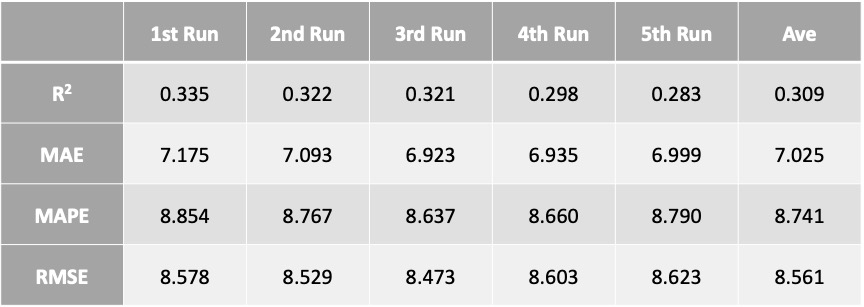
Table 1. Quantitative metrics evaluated
between ground truth WM scores and model output scores for the CNN model. R2:
higher is better, MAE, MAPE, RMSE: lower is better.
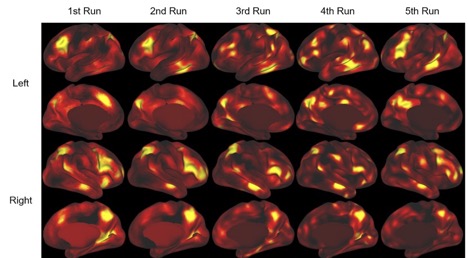
Figure 2. Average saliency maps generated
across 61 testing subjects from CNN with cortical fMRI activations. Yellow
region indicates high salience.
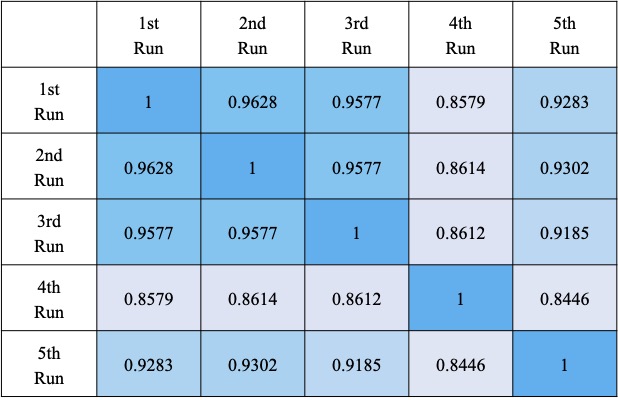
Figure 3. Correlation matric for
the saliency map between each run. Darker color indicates higher correlation.
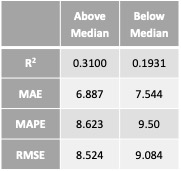
Table 2. Quantitative
metrics evaluated between ground truth WM scores and model output scores for
the CNN model trained with mask generated by thresholding the average saliency
map. The threshold chosen is the median of the saliency map. R2:
higher is better, MAE, MAPE, RMSE: lower is better.
DOI: https://doi.org/10.58530/2023/2712