2711
Representation learning of resting state functional MRI using a volumetric variational autoencoder model (3D VAE)1Functional MRI Laboratory, University of Michigan, Ann Arbor, MI, United States, 2Biomedical Engineering, University of Michigan, Ann Arbor, MI, United States
Synopsis
Keywords: Machine Learning/Artificial Intelligence, Machine Learning/Artificial Intelligence
In this work, we consider whether a VAE model trained with volumetric fMRI data (rather than a cortical subset of the data) is capable of encoding fMRI into low-dimensional representations, decoding these representations back into volumetric fMRI space, and also generating new fMRI patterns from the latent space. For 3D VAE model training, validation, and testing, volumetric resting-state fMRI data was used from the Human Connectome Project minimally preprocessed pipeline. We find the 3D VAE is able to accurately represent the spatial and temporal information in the data. In addition, it is able to synthesize realistic resting-state networks.Introduction
Existing studies of VAE models trained on fMRI data are focused on either cortical surface data and/or a subcortical subset of the volumetric data1-4. In a recent study, a 2D variational autoencoder has been designed to encode high-dimensional rsfMRI activity patterns as low-dimensional latent representations, and to use latent representations to generate or reconstruct rsfMRI patterns3. This VAE model is nonlinear, learnable from fMRI data alone and thus unsupervised or independent of any task or subject groups, and able to identify individual subjects from each other from their rsfMRI representations.In this work, we extend this framework to work with 3D volumetric whole-brain fMRI data and examine whether the 3D VAE is capable of encoding fMRI into low-dimensional representations, decoding these representations back into volumetric fMRI space, and also generating new fMRI patterns from the latent space. We hypothesize that this volumetric model will be advantageous for other applications that may require the additional subcortical data, such as in studies of certain brain networks or pathologies. In addition, this will the groundwork for future integration of the 3D VAE model into image reconstruction and other fMRI analysis pipelines.
Methods
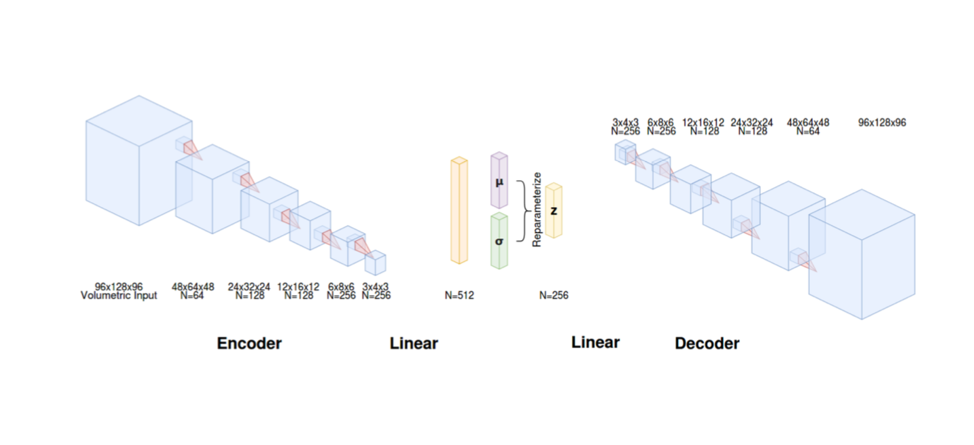
For model training, validation, and testing, volumetric resting-state fMRI data from 500 healthy subjects was retrieved from the Human Connectome Project minimally preprocessed pipeline5. Each scan consists of 1,200 time frames sampled at a repetition time (TR) of 0.72 seconds with 2mm3 isotropic resolution. Additionally, spatial smoothing (FWHM 6mm), voxel-wise 3rd-order polynomial regression, 0.01-0.1 Hz bandpass filtering6, and normalization to 0 mean and 1 standard deviation were applied. The 3D VAE model was trained on 300 subjects’ fMRI timecourses and validated on 100 subjects’ fMRI timecourses.The 3D VAE designed here is comprised of encoder and decoder portions that takes each volume of 3D fMRI data (96x128x96) as input. The encoder contained five 3D convolutional layers, including 3D batch normalization and leaky rectified nonlinearity. The linear layer used the resultant 3x4x3 feature map as input and yielded each latent variable distribution mean and standard deviation. The decoder followed a similar process to map the latent variables back to the volumetric fMRI space. The model was implemented in PyTorch 1.7.0 and the architecture is depicted in Figure 1.
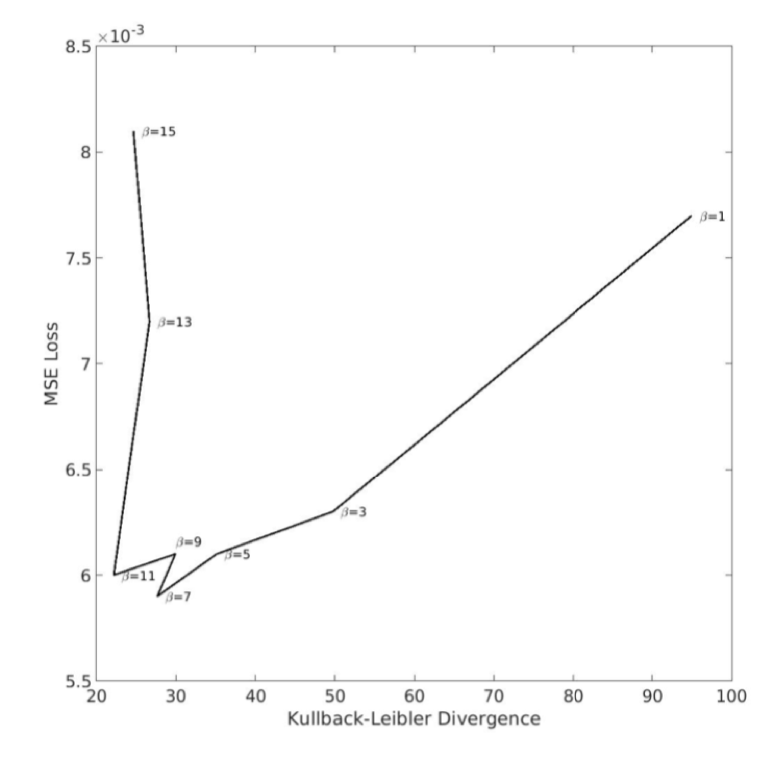
The loss function for the 3D model that is minimized during training consists of a reconstruction term assessed via mean squared error (MSE) and a regularization term using Kullback-Leibler divergence (KLD). The regularization term constrains the distribution of every latent variable to be close to an independent and standard normal distribution, with a β parameter to balance the trade-off of reconstruction performance and regularization. The model was trained with stochastic gradient descent and the Adam optimizer7, with a starting learning rate of 1e-5 and a batch size of 32. After evaluating model performance with and without learning rate decay, the learning rate was chosen to decay every 20 epochs by a factor of 10. An initial parameter sweep (β=0.1, 1, 10, 100) indicated that the optimal range for β was around 10 based on the final epoch training and validation loss and NRMSE of input and output rsfMRI data. A further parameter sweep, shown in Figure 2, showed that the optimal trade-off between MSE and KL divergence was around β=7∼11. β=7 was chosen for further analysis.
Reconstruction performance was assessed using normalized root mean squared error (NRMSE) between the input data and decoded output. Temporal alignment was assessed using correlation within a gray matter mask.
To investigate whether the 3D VAE model learns low-dimensional representations of fMRI patterns and is also able to decode those representations into the original fMRI space, we synthesized fMRI data using the trained network. Samples from the prior distribution (i.e., standard normal distribution) were used to generate a timecourse containing 1,000 frames of fMRI patterns with the trained VAE decoder. These fMRI patterns were input to a temporal ICA with 23 components using the scikit-learn FastICA toolbox in Python 3.7.9. These were then compared to ICA maps from measured fMRI (1,000 frames) from a subject from the HCP dataset, as well as each of the Beckmann resting-state networks8.
Results
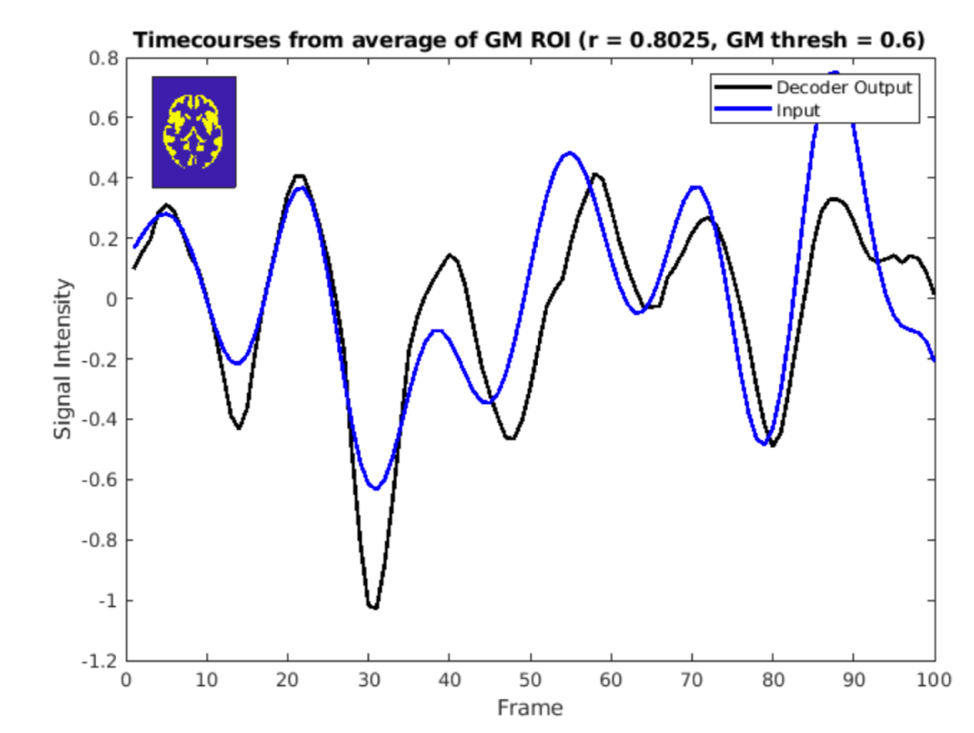
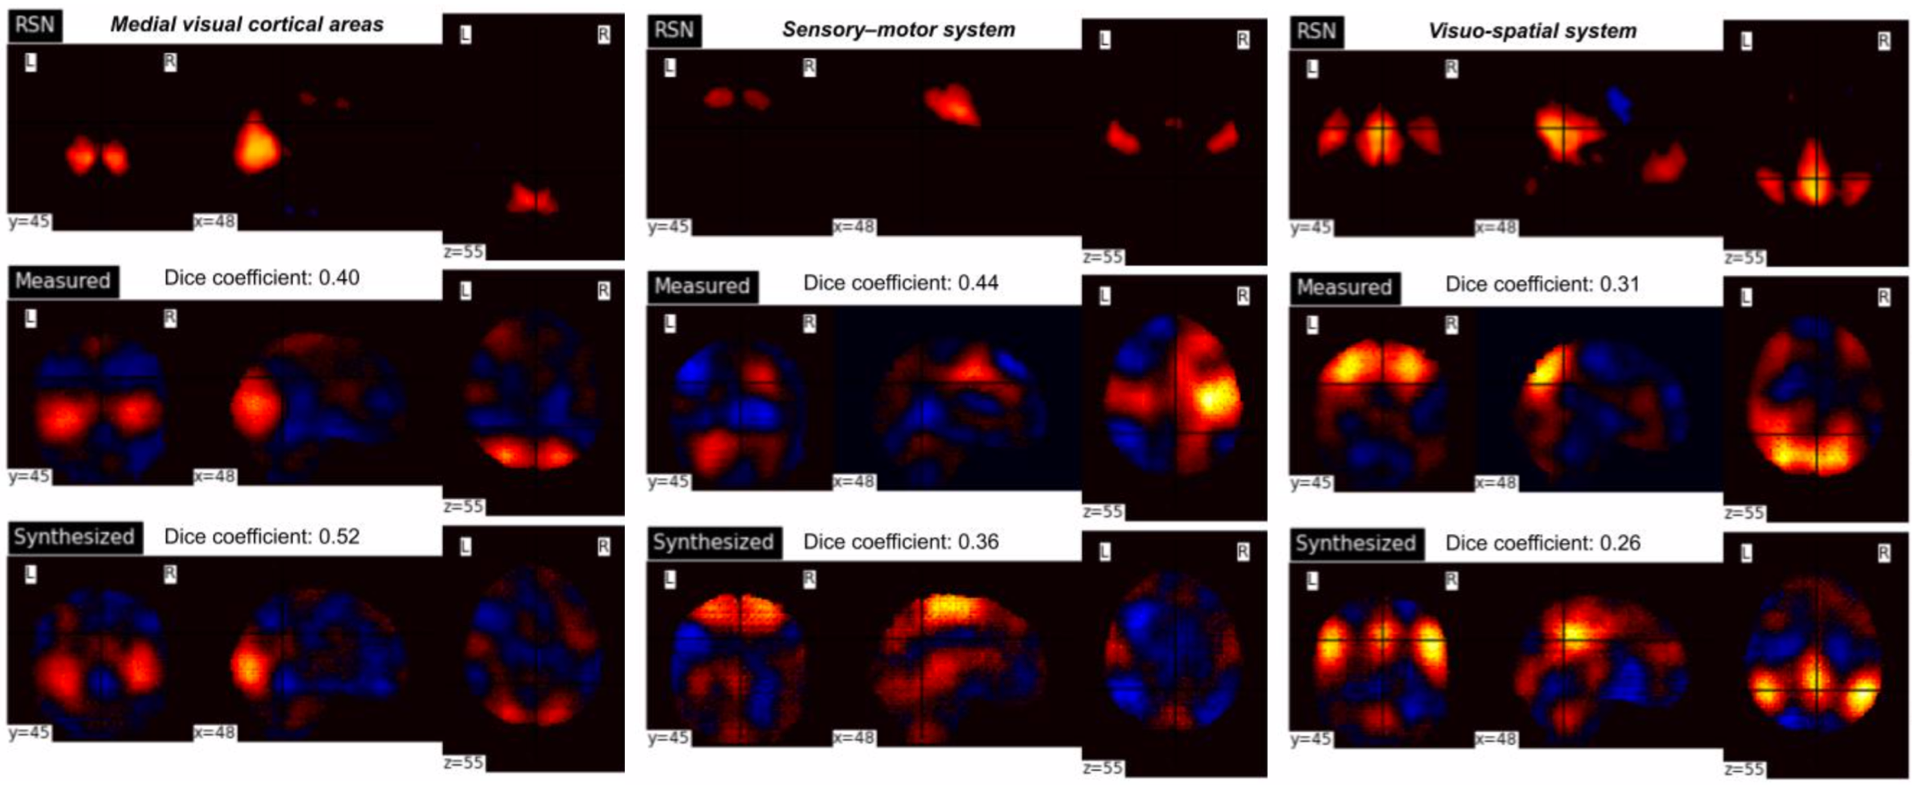
The NRMSE between input and decoder output for spatial patterns was approximately 0.68. The VAE model also preserves temporal patterns between average timecourses from the gray matter for both the input and decoder output. Figure 3 demonstrates good alignment, with a correlation of approximately 0.8.Figure 4 shows the comparison of measured and synthesized fMRI temporal ICA maps with the Beckmann resting state networks. Visual inspection indicates that brain networks are reflected in the resultant clusters and in the synthesized data. However, as shown in the visuo-spatial system, better correspondence between measured/synthesized data the RSN reference maps may be achieved with those that do not yield the greatest Dice coefficient.
Conclusion
The volumetric VAE model provides information from both cortical and subcortical regions, and is naturally suited for 3D imaging data. In addition, it is able to model and synthesize realistic resting-state spatiotemporal dynamics. Future work will investigate improved methods for network detection, as well as application to resting-state and task data in patient populations.Acknowledgements
This project was supported in part by the University of Michigan Precision Health Investigators Award.References
1. Geenjaar E, White T, Calhoun V. Variational voxelwise rs-fMRI representation learning: Evaluation of sex, age, and neuropsychiatric signatures. In 2021 IEEE International Conference on Bioinformatics and Biomedicine (BIBM) pp. 1733-1740 (2021).
2. Kim JH, De Asis-Cruz J, Krishnamurthy D, Limperopoulos C. Towards A More Informative Representation of the Fetal-Neonatal Brain Connectome using Variational Autoencoder. bioRxiv (2022).
3. Kim JH, Zhang Y, Han K, Wen Z, Choi M, Liu Z. Representation learning of resting state fMRI with variational autoencoder. NeuroImage 241:118423 (2021).
4. Wu Y, Besson P, Azcona EA, Bandt SK, Parrish TB, Katsaggelos AK. Reconstruction of Resting State FMRI Using LSTM Variational Auto-Encoder on Subcortical Surface to Detect Epilepsy. In 2022 IEEE 19th International Symposium on Biomedical Imaging (ISBI) pp. 1-5 (2022).
5. Van Essen DC, Smith SM, Barch DM, Behrens TE, Yacoub E, Ugurbil K, Wu-Minn HCP Consortium. The WU-Minn human connectome project: an overview. Neuroimage 80:62-79 (2013).
6. Cordes D, Haughton VM, Arfanakis K, Wendt GJ, Turski PA, Moritz CH, Quigley MA, Meyerand ME. Mapping functionally related regions of brain with functional connectivity MR imaging. American journal of neuroradiology 21(9):1636-44 (2000).
7. Kingma DP, Ba J. Adam: A method for stochastic optimization. arXiv preprint arXiv:1412.6980 (2014).
8. Beckmann CF, DeLuca M, Devlin JT, Smith SM. Investigations into resting-state connectivity using independent component analysis. Philosophical Transactions of the Royal Society B: Biological Sciences. 360(1457):1001-13 (2005).
Figures