2710
Benchmarking local low rank denoising methods for task-based fMRI data analysis1Neurospin (CEA), Gif-sur-Yvette, France
Synopsis
Keywords: Data Processing, fMRI (task based), Denoising, Benchmak
Local-low-rank denoising in task-based fMRI increases sensitivity to statistical detection of neural activity, without harming specificity.
We compared 5 methods (NORDIC, MP-PCA, Hybrid-PCA, Optimal-Threshold, Hybrid-OT) in 4 preprocessing configuration (denoising on magnitude/complex data, before/after motion correction) and their effect on downstream analysis. For best performance, the denoising shoud be done prior to motion correction, and using complex-valued data is only valuable in some settings.
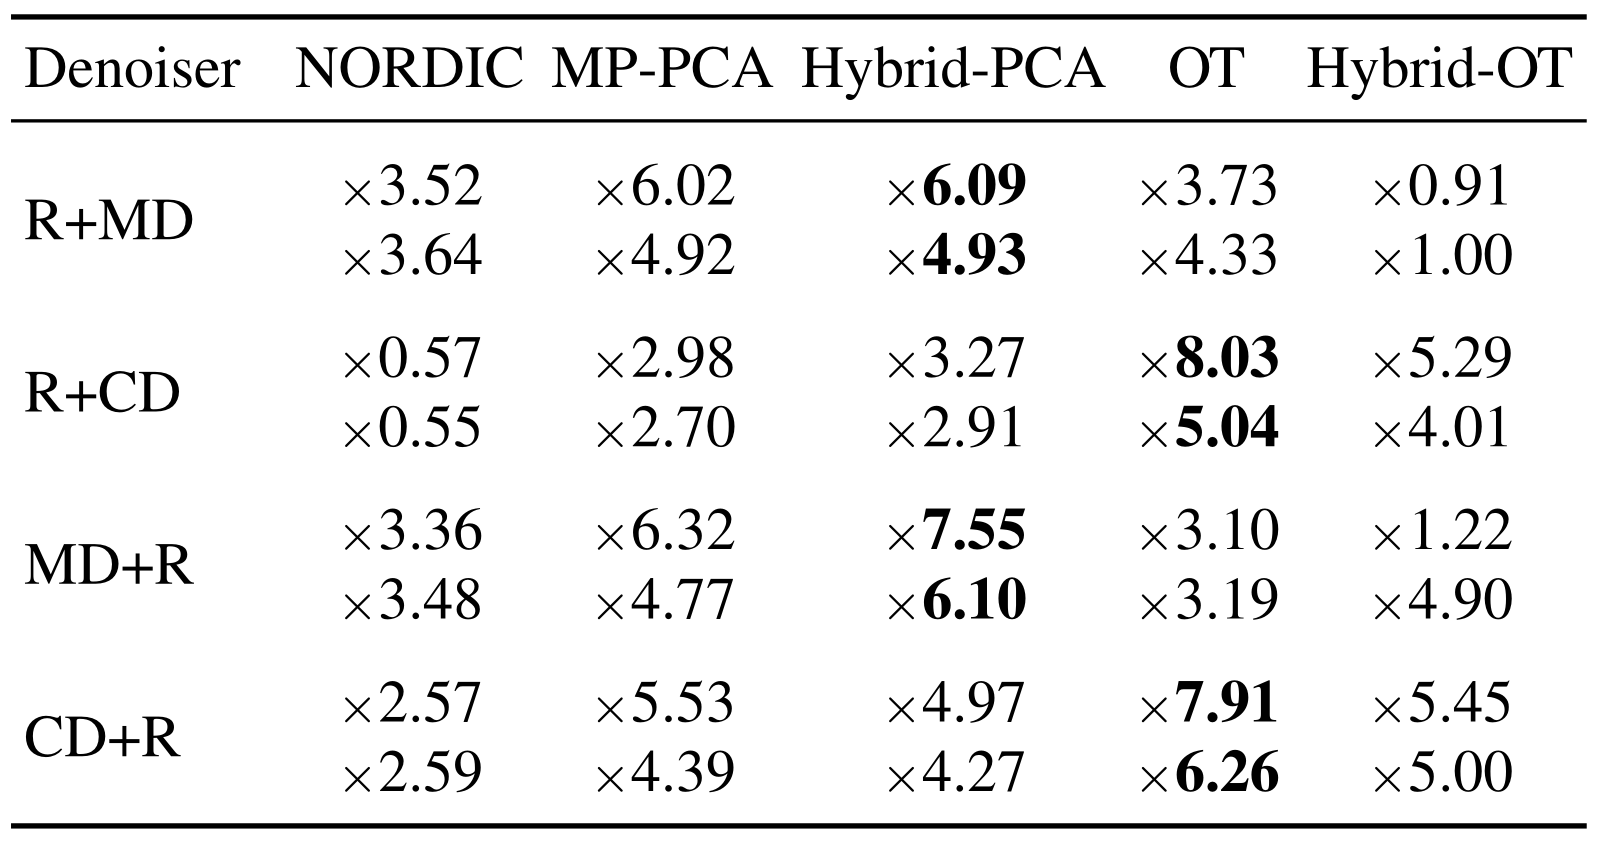
In average (n=6), up to 8 times more activations can be detected (p < 0.05, controlling for FDR). We also provide open-source implementations for broader use of Local-Low-Rank denoising methods in fMRI.
Introduction
Functional MRI (fMRI) as a dynamic imaging technique suffers from a compromise (trade-off?) between spatio-temporal resolution and tSNR, partly compensated by using ultra-high magnetic fields such as 7Tesla~(7T)1.Concomitantly denoising methods have been introduced for fMRI and dynamic imaging in general (such as DWI) to reduce thermal noise 2-5. Yet, their integration in the processing pipeline has hardly been considered: In the best case, the denoising step is performed prior to any processing, or simply tested on synthetic data.
Moreover, only the recent contribution of Nordic3, considered complex-valued data, which preserves the gaussian distributed noise hypothesis, instead of using magnitude-only images, where the noise is rician6.
This work propose a review of four state of the art denoising methods based on local low rank hypothesis. We compare these methods over 6 volunteers, using them in a standard preprocessing workflow, and assessing quality with a downstream statistical analysis.
Theory
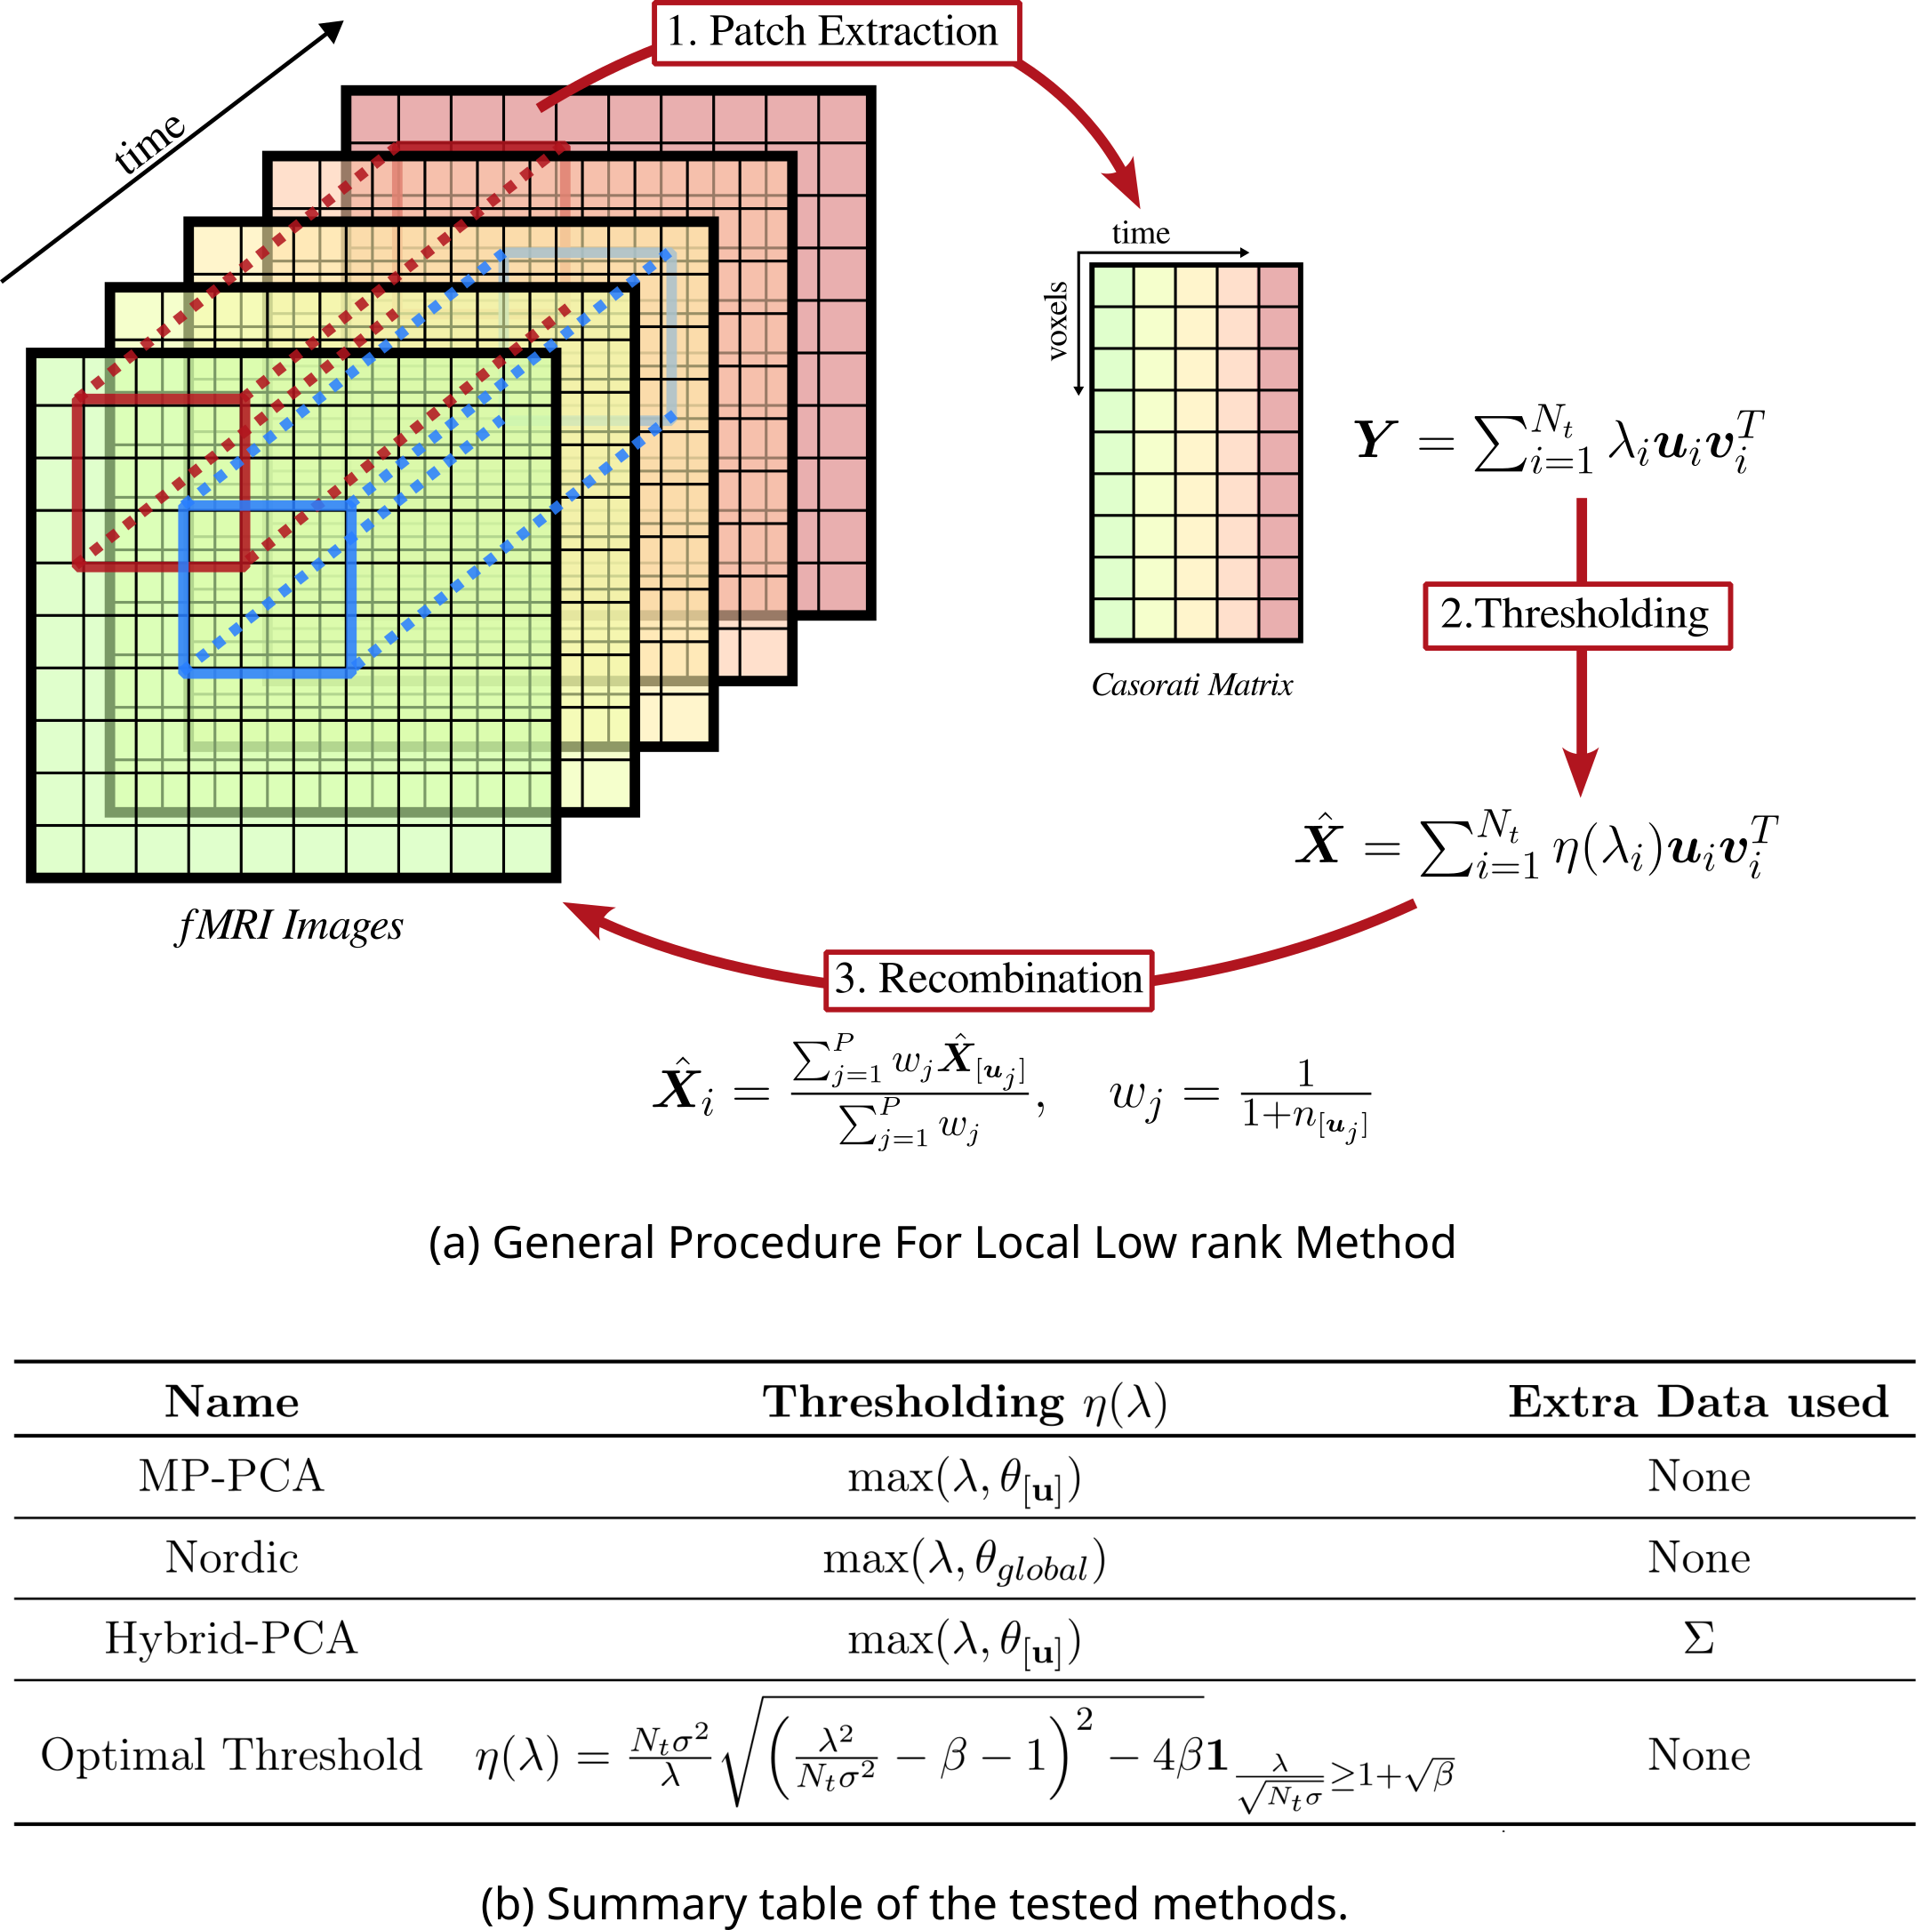
FMRI scans are inherently low rank as we observe small variations of the BOLD signal over a constant background. Thus it can be considered as a noisy observation of a low rank matrix $$$~\mathbf{Y}_{ij}=\mathbf{X}_{ij}+\mathbf{N}_{ij}~$$$where the noise components are independent and Gaussian $$$~\mathbf{N}_{ij}\sim\mathcal{N}(0,\mathbf{\Sigma}^{2})$$$.The low rank matrix is the solution of the problem7:$$$\hat{\mathbf{X}}=\arg\min_{\mathbf{X}}\frac12\|\mathbf{Y}-\mathbf{X}\|_{F}^{2}+\lambda\|\mathbf{X}\|_{*}~textrm{where}~\|\cdot\|_{*}$$$denotes the nuclear norm.
Solving (1) consists in applying a soft thresholding operator on singular values of $$$\mathbf{Y}$$$. However, global low rank modeling suffers in practice from the high dimensionnality of the problem:
a. For 3D fMRI acquisitions, we typically have$$$~N_{x}N_{y}N_{z}\sim10^{5}N_{t}~$$$and the lack of DOF in SVD reduces effectiveness of rank constraint.
b. Spatial noise level is heterogeneous for accelerated parallel imaging due to multi-coil interactions.8
To alleviate those challenges, the problem is solved on small 3D+time patches extracted from the 4D fMRI sequence.
For ease of comparison we settle on a patch size of 11 with 50% overlap. To ease computations, only patches overlapping with the brain mask are computed.
Materials and Methods
Acquisition
6 volunteers were scanned with a Siemens Magnetom 7T (Siemens-Healthineers, Erlangen, Germany) and a 1Tx-32Rx head coil (Nova Medical, Wilmington, CO, USA) using a 3D-EPI sequence (1mm-iso, TE=20ms, volumetric TR=2.4s, 120 repetitions).
Task-based fMRI data was collected along two consecutive runs during a retinotopic mapping paradigm with rotating wedge (clockwise and anti-clockwise) and period of 32s.
Preprocessing
To quantify the potential benefit of each denoising method, we tested 4 distinct preprocessing pipelines, applying the denoising step on the complex-valued or magnitude-only fMRI data and interchanging position in the workflow (i.e. before/after motion correction).
In every case fMRI images are corrected for $B_0$ field-induced geometric distorsions and coregistered to coresponding T1-w anatomical volume. For reproductibility purposes we provides an open-sourced Nipype-workflow9 and a python package implementing the LLR methods10.
Statistical Analysis
After running the different configurations of preprocessing pipeline, fMRI images data were analyzed using the Nilearn package.
We used two-session general linear model~(GLM) modelling the retinotopic mapping experimental paradigm~(clockwise and counter-clockwise), it includes 2 task-related regressors (parametric, continuous and sinusoidal), 6 rigid motion regressors, a drift regressor and the baseline.
The global effect of interest was determined using a $F$-test over the two sinusoidal task regressors.
To detect evoked brain activity we considered threshold $$$p<0.05$$$, corrected for multiple comparisons using the false discovery rate~(FDR).
Results
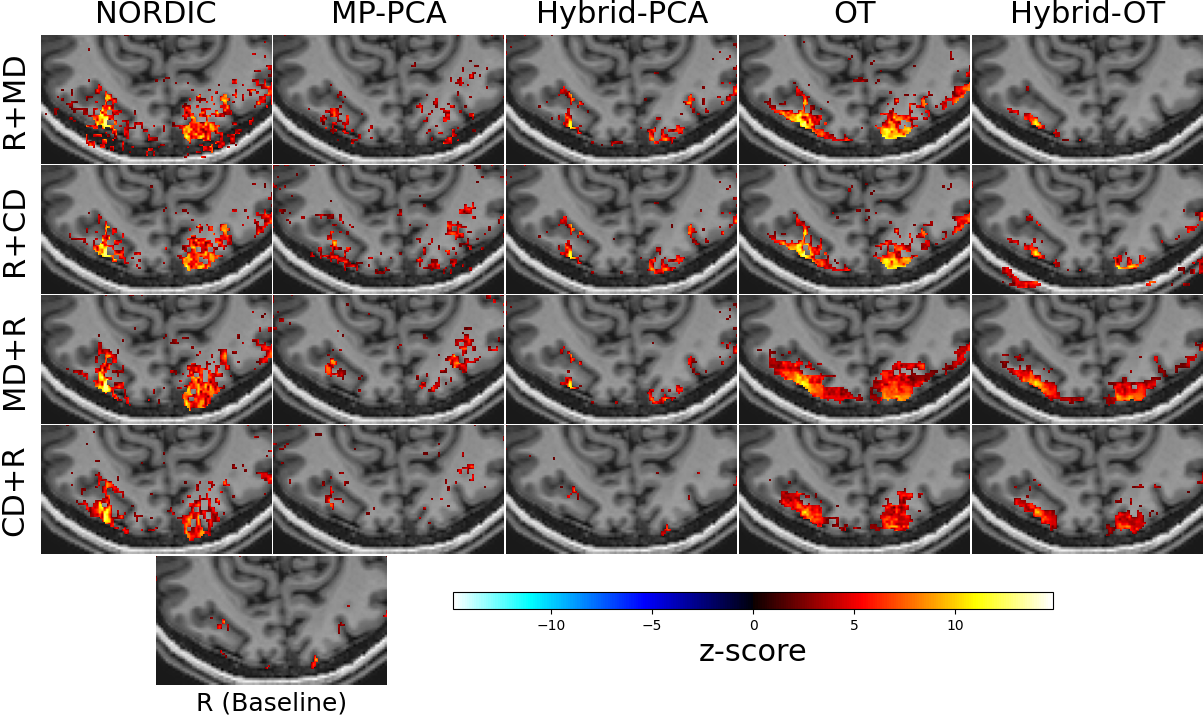
Single Subject AnalysisFigure 2 compares z-scores related to global effect of interest for a single subject. Denosing brings higher z-score in complex-valued or magnitude-only images. For the same subject, Figure 3 and 4 shows the denoised z-score maps for the 20 tested configuration and noisy baseline and the thresholded activations map respectively. OT method shows better performance than other methods, detecting activations only in gray matter, and yields highest z-score with largest spatial extend in occipital region, especially when doing magnitude-only denoising before realignment (scenario OT/MD+R It provides the best sensitivity/specificity trade-off.
"Group Level" Analysis
Figure 5 reports average gain in activation over 6 subjects, positive in most cases. Performing the denoising prior to realignment is most beneficial, especially when focusing on the occipital ROI. Our interpretation is the following: even though the realignment step aims at producing lower-rank fMRI images by removing part of the physiological noise, it also resamples the images, and potentially affect the noise behavior.
Conclusion
We demonstrated the added value of injecting a denoising step as early as possible in preprocessing workflow for gain in statistical sensitivity. Among the 5 tested methods, we found that Optimal Threshold provides best sensitivity-specificity trade-off, not retrieving false positives in white matter while boosting the statistical significance along the cortical ribbon. However there is not a one size fits all solutions: OT method yields best results with complex-valued fMRI images (which are not always available), and Hybrid-PCA is the most promising for magnitude-only images. This preliminary study on task-based fMRI calls for broader validation, both on a larger cohort and in other use cases, notably in resting-state fMRI. Importantly, using extra data such as a noise map in Hybrid-PCA and Hybrid-OT is not mandatory to obtain a significant improvement, but can also be detrimental (see Hybrid-OT vs OT). Future work also involves analyzing the impact of hyperparameters (predominantly the patch size and their overlap) on the downstream task.Acknowledgements
No acknowledgement found.References
1. Triantafyllou, Hoge, Krueger, Wiggins, Potthast, Wiggins, Wald (2005-05-15) Comparison of Physiological Noise at 1.5 T, 3 T and 7 T and Optimization of fMRI Acquisition Parameters, NeuroImage.
2. Veraart, Novikov, Christiaens, Ades-Aron, Sijbers, Fieremans (2016-11-15) Denoising of Diffusion MRI Using Random Matrix Theory, NeuroImage.
3. Vizioli, Moeller, Dowdle, Akçakaya, De Martino, Yacoub, Uğurbil (2021-08-30) Lowering the Thermal Noise Barrier in Functional Brain Mapping with Magnetic Resonance Imaging, Nature Communications.
4. Gavish, Donoho (2017-04) Optimal Shrinkage of Singular Values, IEEE Transactions on Information Theory.
5. Neto Henriques, Nørhøj Jespersen, Shemesh (2022) Hybrid PCA Denoising - Improving PCA Denoising in the Presence of Spatial Correlations, Proceedings of the 30’th Scientific Meeting of the International Society for Magnetic Resonance in Medicine.
6. Gudbjartsson, Patz (1995) The Rician Distribution of Noisy Mri Data, Magnetic Resonance in Medicine.
7. Candès, Sing-Long, Trzasko (2013-10) Unbiased Risk Estimates for Singular Value Thresholding and Spectral Estimators, IEEE Transactions on Signal Processing.
8. Breuer, Kannengiesser, Blaimer, Seiberlich, Jakob, Griswold (2009-09) General Formulation for Quantitative G-factor Calculation in GRAPPA Reconstructions, Magnetic Resonance in Medicine.
9. https://github.com/paquiteau/retino-pypeline
10. https://github.com/paquiteau/patch-denoising
Figures
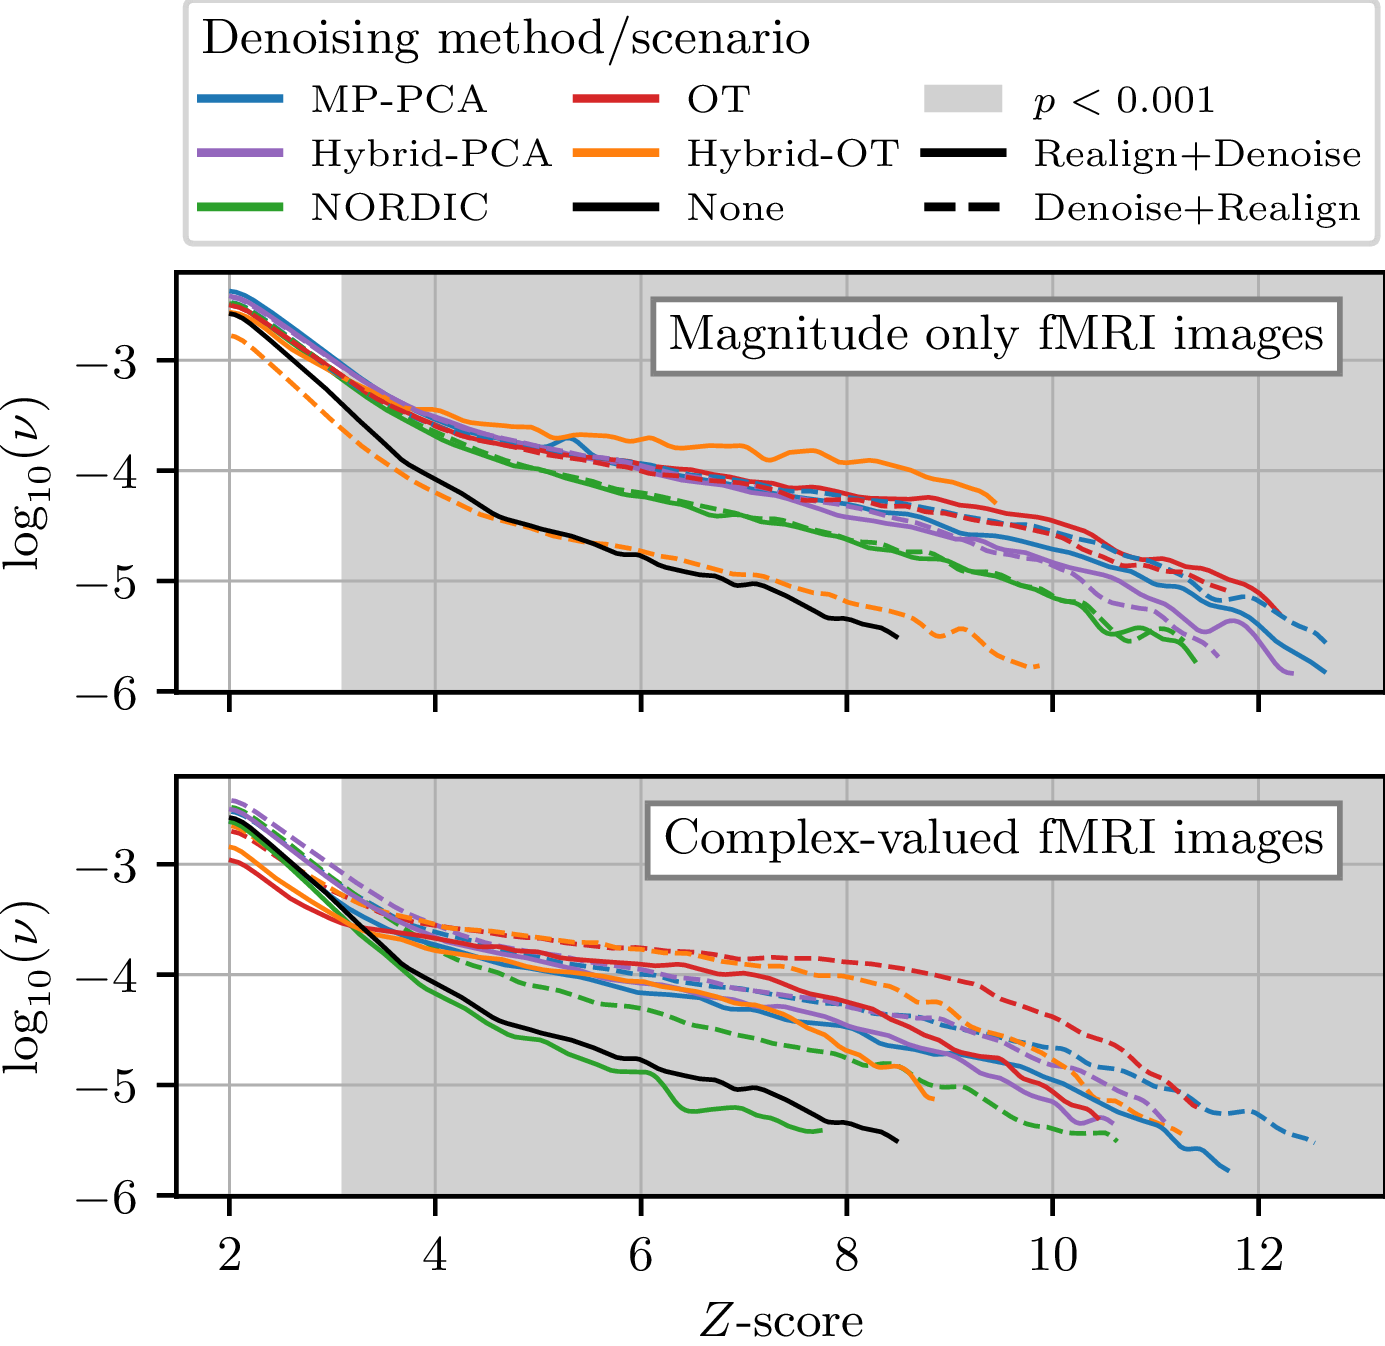
Non zeros Z-score probability distribution(ν) for a single participant.Top vs Bottom: Analysis of magnitude-only vs complex-valued fMRI images. The distribution has been smoothed with a Gaussian kernel for visualization purposes.
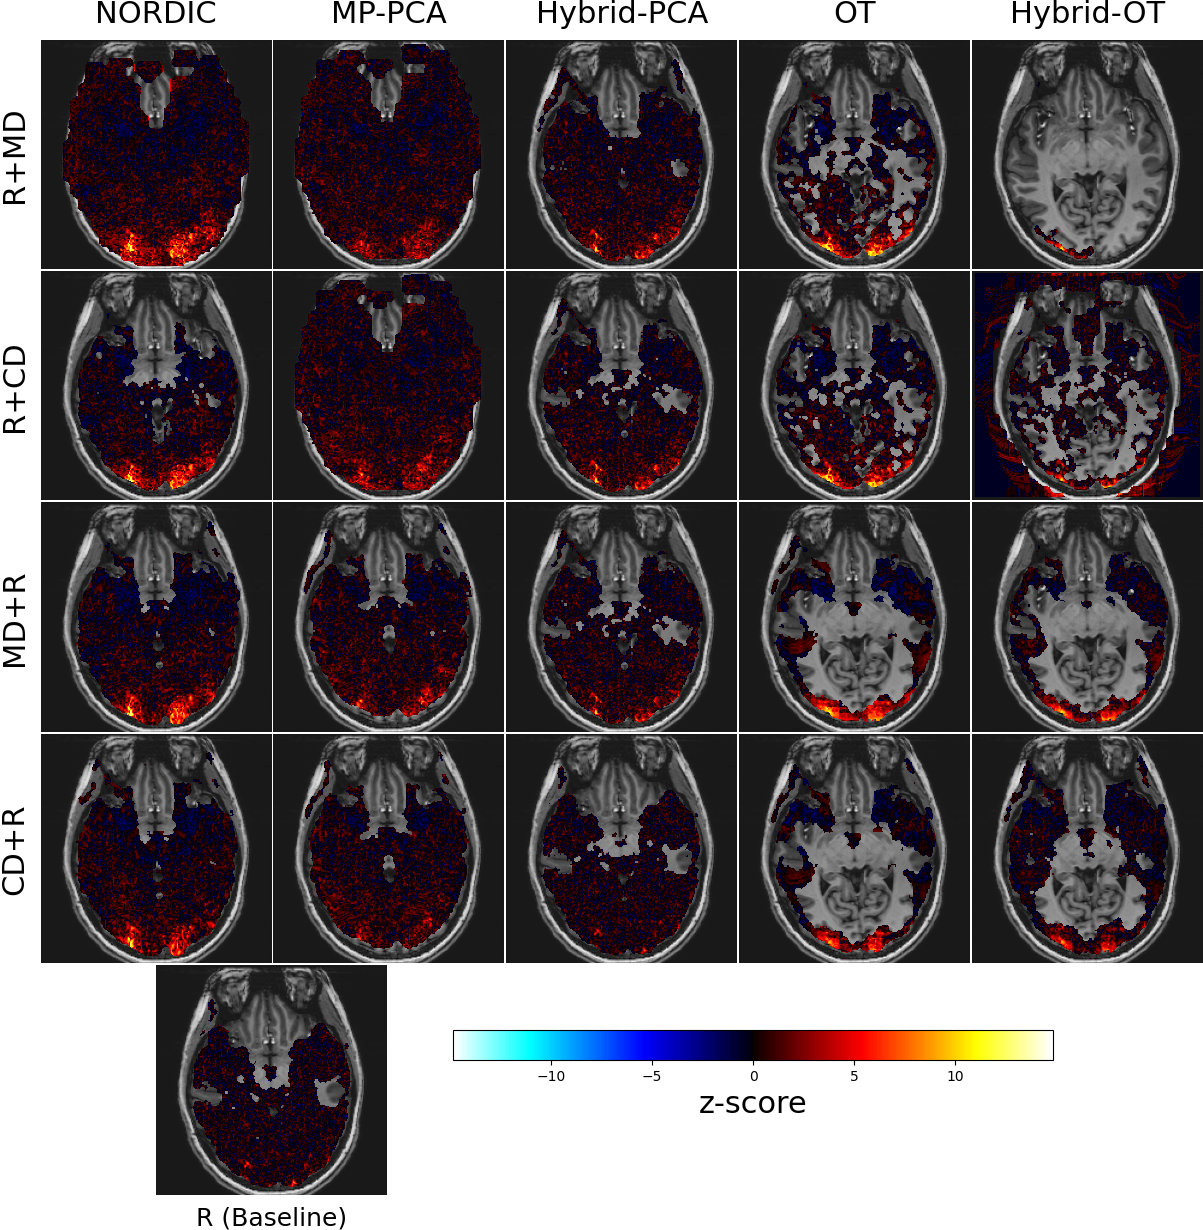
Z-score spatial distribution for the same participant as Fig. 2. Only non zeros values are displayed. The Behavior of OT is more visible here: most of the z-score are zeroed out, and the remaining ones get higher values.