2705
The dependence of the macrovascular transverse R2’ relaxation and resultant BOLD fMRI signal on vascular position: A simulation study1Department of Medical Biophysics, University of Toronto, Toronto, ON, Canada, 2Rotman Research Institute, Baycrest Hospital, Toronto, ON, Canada, 3Institute of Biomedical Engineering, University of Toronto, Toronto, ON, Canada
Synopsis
Keywords: Signal Modeling, Simulations
The R2’ effect is the foundation of BOLD fMRI contrast. R2’ is disproportionately sensitive to the presence of macrovasculature, which disrupts the homogeneity of the main magnetic field (B0), resulting in BOLD signal intensities that may heavily depend on macrovascular orientation and volume but also on vascular position. We simulate the BOLD signal strength in a voxel containing macrovasculature at various vascular positions within the voxel. This simulation highlights an additional source of variability in the macrovascular contributions to R2’-weighted MRI.Introduction
The transverse relaxation (R2’) contrast is critical to BOLD fMRI (fMRI). However, previous research indicates that the presence of macrovasculature can affect the fMRI signal frequency1, correlation pattern2, and variability3 in a way unrelated to neuron activity. The macrovasculature disrupts the homogeneity of the main magnetic field (B0), resulting in BOLD rs-fMRI signal1,3 that depends not only on vascular orientation and volume but also on vascular position. To better understand these latter and lesser-known contrast mechanisms, we use simulation to characterize how R2’ and the signal strength of a typical fMRI voxel varies with macrovascular position.Method
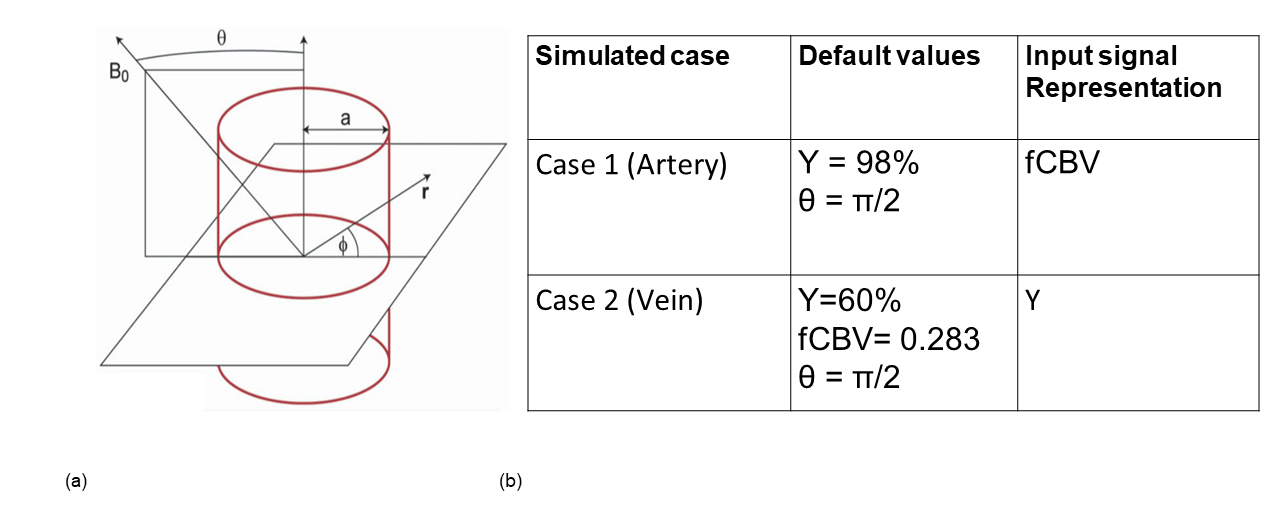
The simulation was based on the infinite-cylinder model proposed by Ogawa et al.4 (Eq. 1&2).$$\text { Extravascular main magnetic field offset: } \omega_{B}=2 \pi \Delta \chi(Y_{tissue}-Y_{blood}) \omega_{0} \sin ^{2}(\theta)(\frac{a}{r})^{2} \cos (2 \phi) \;\;(1)$$
$$\text { Intravascular main magnetic field offset: } \omega_{B}=\frac{2 \pi \Delta \chi(Y_{tissue}-Y_{blood}) \omega_{0}\left(3 \cos ^{2}(\theta)-1\right)} { 3}\;\; (2)$$
ω0: main magnetic field in terms of angular frequency; Y: percent blood oxygenation; ∆χ: susceptibility of fully deoxygenated blood (with specific hematocrit); θ, r and φ are illustrated in Fig. 2.
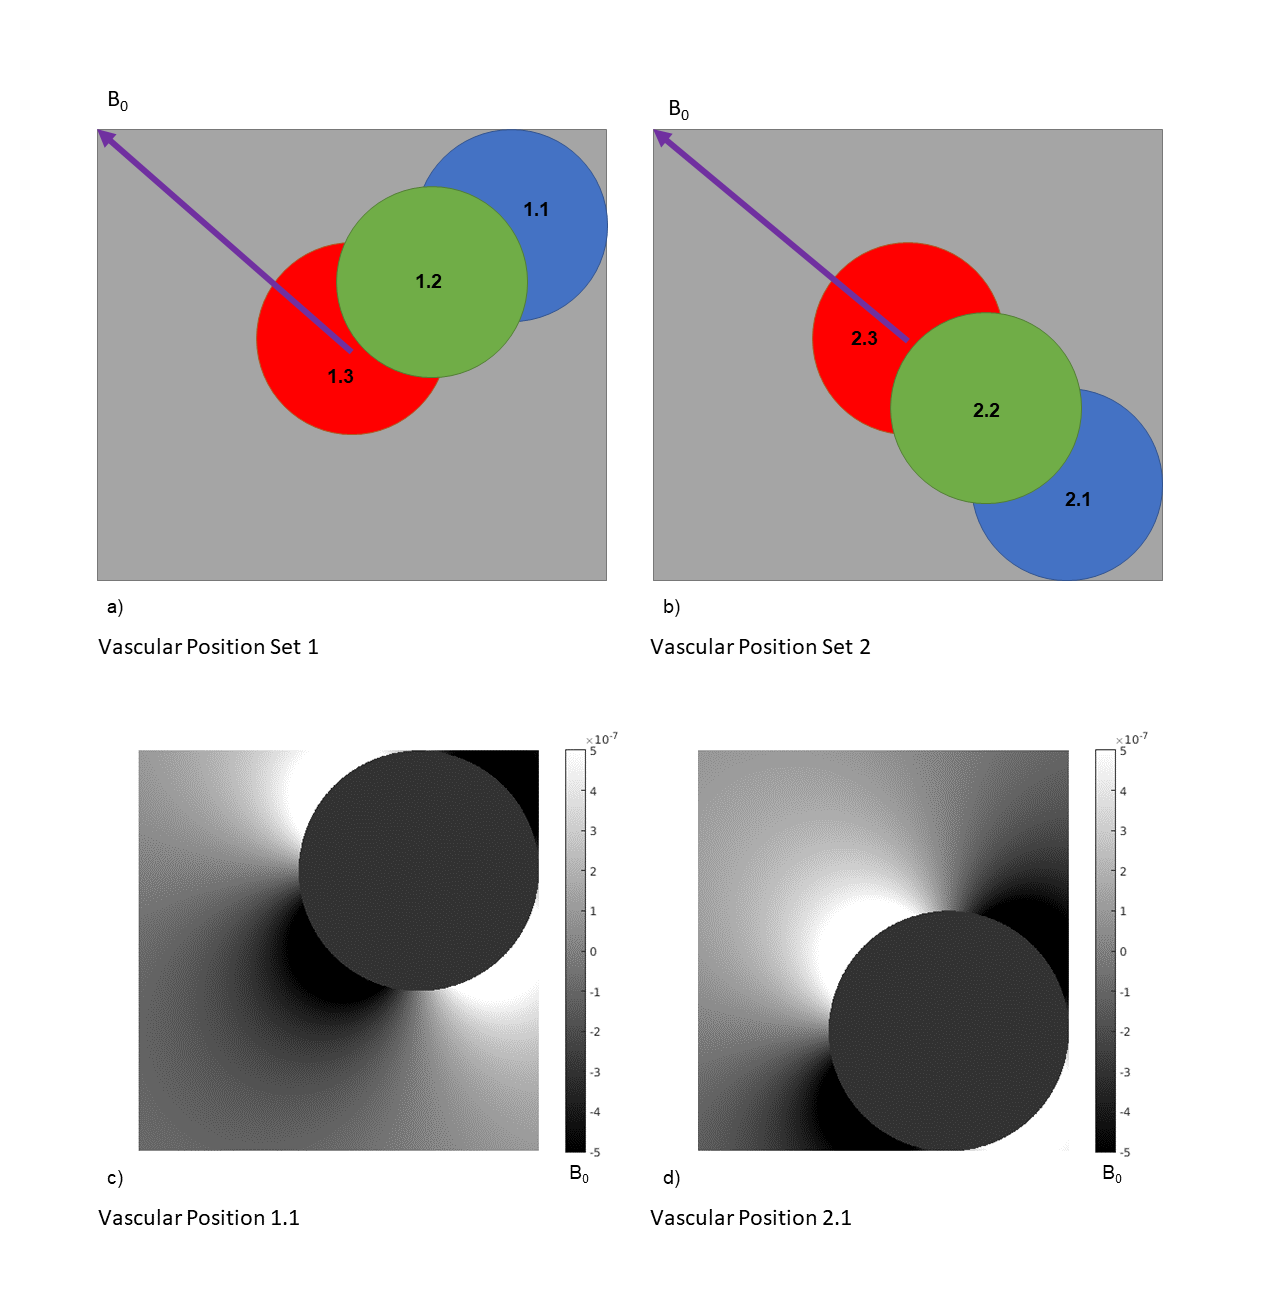
We assume a 2D voxel of 4 mm isotropic, composed of 16,000,000 1-um isotropic sub-voxels, with B0=3T, TR=2200ms, TE=27ms, and flip angle(α)=90o. The vascular occupancy (fCBV) is computed as the ratio of the 2D vascular cross-sectional area to the 2D voxel area. A large vessel is placed in the middle of the 2D voxel; diffusion and inflow effects are deemed negligible for the assumed static-dephasing regime and for the given scan parameters. Blood and tissue T1s are set to 1649ms5 and 1445ms6, respectively. The T2 of tissue and blood were calculated according to previous relaxometry studies7. Tissue oxygenation is set to 85%. We created two sets of vascular positions: the first set contains 3 positions aligned along the B0 direction, while the second set contains 3 positions aligned along an axis perpendicular to B0, each occupying a quadrant of the 2D voxel as shown in Fig. 1. ΔΦ ( the average spin phase) and the spin phase dispersion (standard deviation of spin phases) were calculated. Also, as shown in Fig. 2, we simulated artery-like vessels, whereby blood oxygenation (Y) remains constant but fCBV varies by ±32%, as well as vein-like vessels, whereby fCBV remains constant while Y varies by ±32%. Intravascular and extravascular T1 and T2 decay were weighted with fCBV before being averaged with R2’ decay to produce the total MR signal.
Results
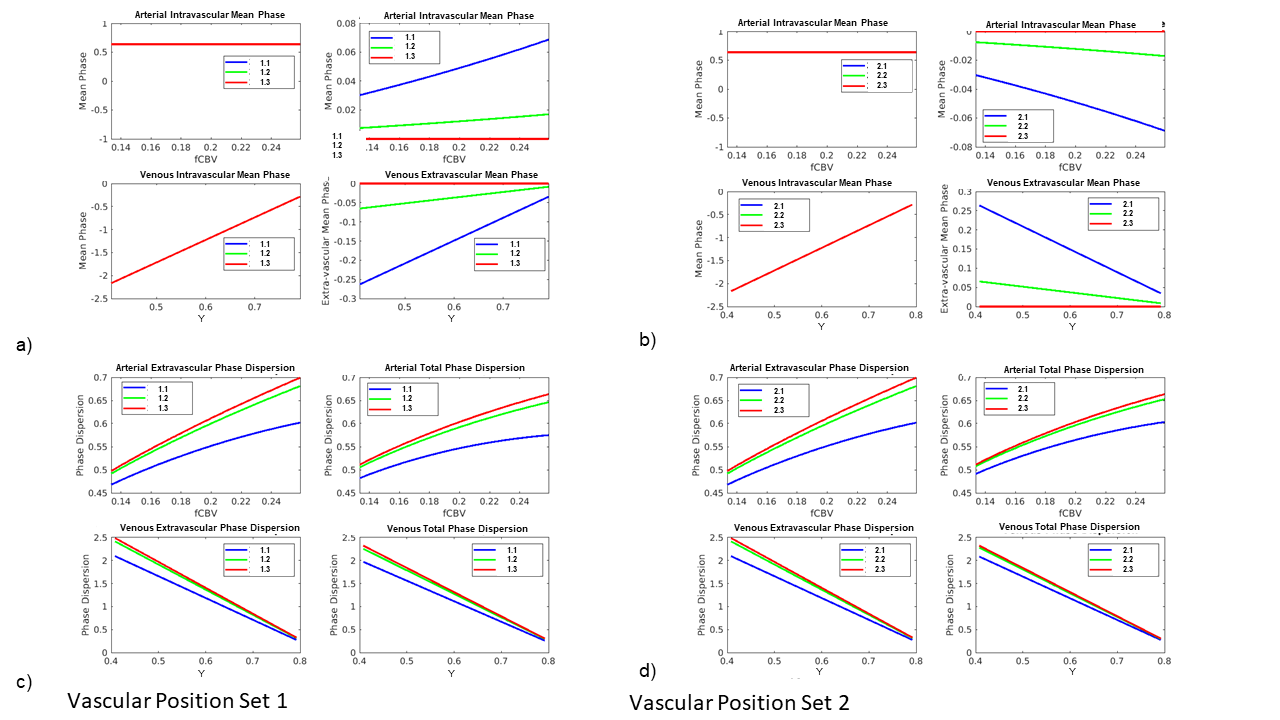
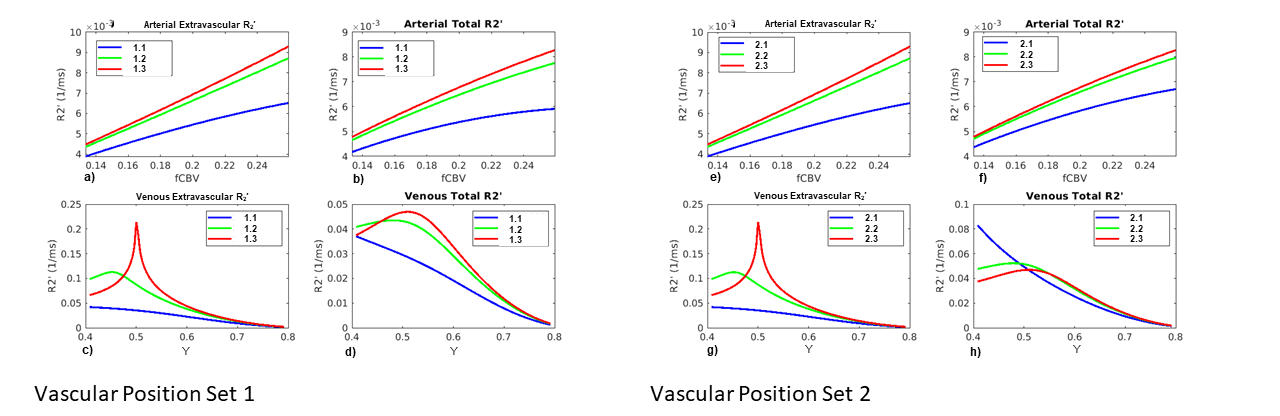
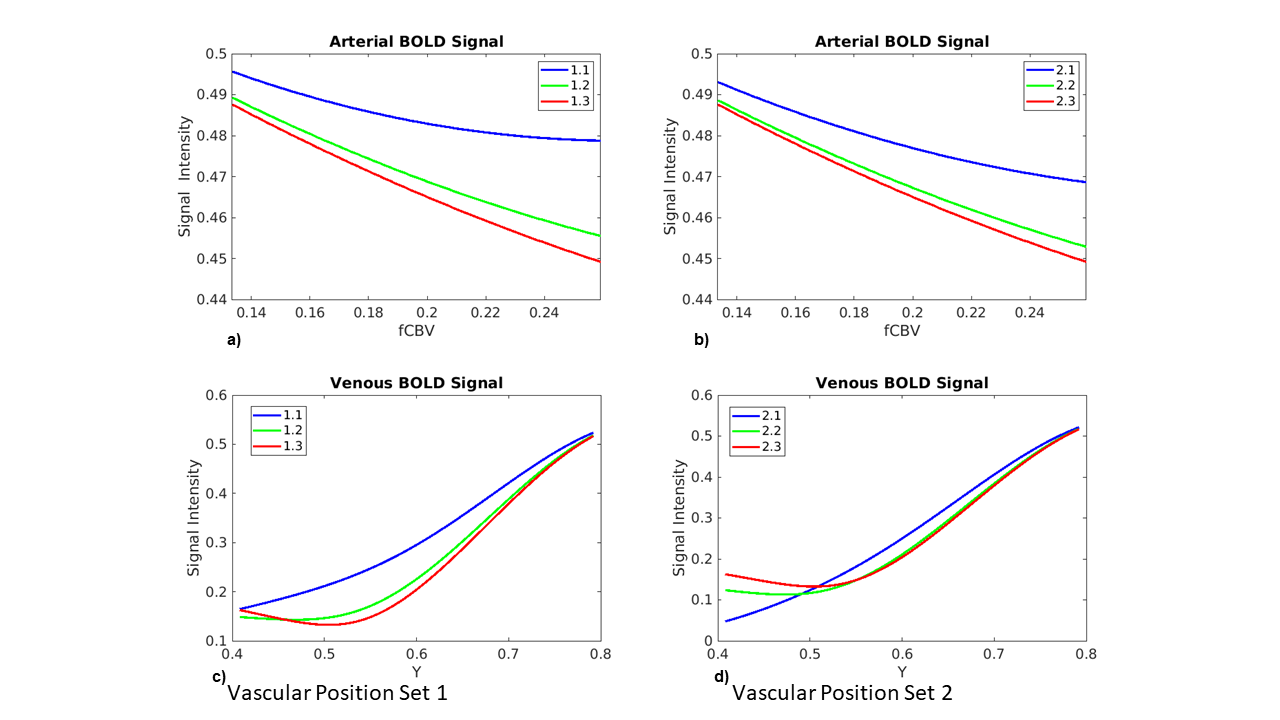
The cylindrical macrovasculature produces a magnetic dipole (see Fig. 1c, d). In a voxel with a vessel at one of the first set of positions (Fig. 1a), the voxel-wise B0 offset is dominated by the negative lobe of the field-offset dipole, while in the case of the second set of vascular positions, the voxel B0 offset is dominated by the positive lobe of the dipole. Correspondingly, the MR signal corresponding to the first set of vascular positions has positive mean phase while the MR signal for the second set of vascular positions has negative mean phase (Fig. 3 a, b). The extravascular mean phase approaches zero as the vessel approaches the center of the voxel in both cases. However, the MRI signal amplitude is determined by the phase dispersion, and while the extravascular phase dispersion is identical between the two sets of vascular positions, the total phase dispersion across the voxel is higher for the second set of vascular positions due to the contribution of intravascular dephasing (Fig. 3 c, d). Difference between the mean phase of intravascular and extravascular compartments will contribute to the voxelwise phase dispersion. If there is a greater difference between the two compartments, the intravascular compartment is more likely to have a larger positive contribution to total phase dispersion. Since R2’ is positively associated with phase dispersion, the second set of vascular positions generally results in a higher R2’ (Fig. 4), corresponding to greater signal decay (Fig. 5).Discussion
As shown in the simulation results, the R2’-based BOLD fMRI signal can differ depending on the position of a large blood vessel inside a voxel, which constitutes a macrovascular BOLD contribution beyond those of the vascular occupancy and orientation reported in our previous study1,7,8. The non-linear relationship between vascular position and the resulting BOLD signal further illustrates the complexities of the macrovascular effect on the fMRI signal. A more complicated effect could be the peaks shown in the extravascular R2’ values shown in Fig. 4 (c,d,g,h). In the presence of large spatial-scale field perturbances, R2' decay will follow a sinc pattern9, where zero-crossing points of the sinc function depend on Y. If the TE samples close to the zero crossings (closer to full signal decay), a high estimated R2' will result Thus, TE will determine the phase dispersion and the R2’ peak. Moreover, this study also illustrates that the intravascular contribution to the macroscopic B0 offset that modulates the BOLD signal decay depending on vascular position, which is non-negligible for BOLD fMRI at 3T.Acknowledgements
The authors acknowledge funding support from the Canadian Institutes of Health Research (CIHR) and the Natural Sciences and Engineering Research Council of Canada (NSERC).
References
1. Zhong X., Chen J.J. (2022) The frequency dependence of the resting-state fMRI signal on macrovascular volume and orientation. ISMRM
2. Tong, Y., Yao, J. F., Chen, J. J., & Frederick, B. D. (2019). The resting-state fMRI arterial signal predicts differential blood transit time through the brain. Journal of cerebral blood flow and metabolism : official journal of the International Society of Cerebral Blood Flow and Metabolism, 39(6), 1148–1160. https://doi.org/10.1177/0271678X17753329
3. Zhong X., Chen J.J. (2022) The dependence of the resting-state macrovascular fMRI signal power on vascular volume and orientation: A simulation study. ISMRM
4. Ogawa, S., Menon, R. S., Tank, D. W., Kim, S. G., Merkle, H., Ellermann, J. M., & Ugurbil, K. (1993). Functional brain mapping by blood oxygenation level-dependent contrast magnetic resonance imaging. A comparison of signal characteristics with a biophysical model. Biophysical journal, 64(3), 803–812. https://doi.org/10.1016/S0006-3495(93)81441-3
5. Zhang, X., Petersen, E. T., Ghariq, E., De Vis, J. B., Webb, A. G., Teeuwisse, W. M., Hendrikse, J., & van Osch, M. J. (2013). In vivo blood T(1) measurements at 1.5 T, 3 T, and 7 T. Magnetic resonance in medicine, 70(4), 1082–1086. https://doi.org/10.1002/mrm.24550
6.Lin C., Bernstein M., Huston H., Fain S. (2001). Measurements of T1 Relaxation times at 3.0T: Implications for clinical MRA. ISMRM
7. Uludağ, K., Müller-Bierl, B., & Uğurbil, K. (2009). An integrative model for neuronal activity-induced signal changes for gradient and spin echo functional imaging. NeuroImage, 48(1), 150–165. https://doi.org/10.1016/j.neuroimage.2009.05.051
8. Viessmann, O., Scheffler, K., Bianciardi, M., Wald, L. L., & Polimeni, J. R. (2019). Dependence of resting-state fMRI fluctuation amplitudes on cerebral cortical orientation relative to the direction of B0 and anatomical axes. NeuroImage, 196, 337–350. https://doi.org/10.1016/j.neuroimage.2019.04.036
9. Carr, H. Y., & Purcell, E. M. (1954). Effects of Diffusion on Free Precession in Nuclear Magnetic Resonance Experiments. Physics Review, 94(3), 630–638. https://doi.org/10.1103/PhysRev.94.630
Figures