2698
Extreme Value Theory as a Risk Analysis Tool to Infer Specific Absorption Rate Intersubject Variability Safety Margins
Igor Tyshchenko1, Simon Lévy2, Bahman Tahayori3, and Leigh A. Johnston1
1Department of Biomedical Engineering, The University of Melbourne, Melbourne, Australia, 2MR Research Collaborations, Siemens Healthcare Pty Ltd, Melbourne, Australia, 3The Florey Institute of Neuroscience and Mental Health, Melbourne, Australia
1Department of Biomedical Engineering, The University of Melbourne, Melbourne, Australia, 2MR Research Collaborations, Siemens Healthcare Pty Ltd, Melbourne, Australia, 3The Florey Institute of Neuroscience and Mental Health, Melbourne, Australia
Synopsis
Keywords: Safety, Parallel Transmit & Multiband, Safety margins, SAR estimation
Specific absorption rate (SAR) in parallel transmission (pTx) ultra-high field MRI is typically evaluated by performing offline electromagnetic simulations on a generic human model. Conventionally, a safety margin that addresses the issue of intersubject variability is selected by choice of the 99th or higher percentile of the SAR distribution. In this work, we argue that this approach underestimates the risk of exceeding the SAR limit. As an alternative, we propose the use of Extreme Value Theory (EVT) for controlling the probability of extremal events in the form of large SAR deviations.Purpose
The specific absorption rate (SAR) in parallel transmission (pTx) is typically evaluated by performing offline electromagnetic (EM) simulations on a generic human model. Conventionally, a safety margin that addresses the issue of intersubject variability is selected by choice of the 99th or higher percentile of the SAR distribution1. In this work, we argue that more direct control of SAR exceedances can be achieved using Extreme Value Theory (EVT). EVT states that the maxima of random variables are distributed according to the Generalised Extreme Value (GEV) distribution, analogous to the Central Limit Theorem’s statement that sums of random variables are Gaussian distributed. We demonstrate that modelling maximal SAR events provides control of SAR to acceptable risk levels and, as a result, can assist in making more informed selections of safety margins.Methods
SAR DistributionIt is assumed that the 10g peak local SAR (pSAR10g) distribution is known, found for example using the method of Le Garrec et al.1 Chosen anatomical parameters of interest, such as head breadth, head length, linear shifts and electrical properties, are modelled as Gaussian random variables. A set of representative anatomies is generated following the unscented transform sampling scheme2, followed by Q-matrix construction using a commercially available EM simulator. Assuming pSAR10g changes smoothly with respect to each of the parameters, a multivariate polynomial can be fit to the data. With estimates of the polynomial coefficients, pSAR10g for the whole population can be inferred. In this work, all reported SAR values are normalised by the average model.
Extreme Value Theory for SAR Modelling
Consider pSAR10g to be an independent and identically distributed (i.i.d.) random variable, $$$X$$$. For blocks of $$$n$$$ scans (for instance, the number of patients scanned in a given period of time), consider within each block the maximum SAR value, $$$M_{n}=max(X_{1}, ... , X_{n})$$$. According to the Fisher-Tippet-Gnedenko theorem, the distribution of $$$\frac{M_{n}-\mu}{\beta}$$$ converges asymptotically to the GEV distribution3,
$$\lim_{n\rightarrow \infty}P \left( \frac{M_{n}-\mu}{\beta} \le z \right) = GEV(z) \tag{1}$$
for some scale $$$\beta > 0$$$ and location $$$\mu \in \mathbb{R}$$$ parameters. The distribution of SAR maxima, $$$M_{n}$$$, is Gumbel distributed (Type I GEV) with the following cumulative and probability density functions:
$$F(z)=e^{-e^{-z}} \tag{2a}$$
$$f(z)=e^{-(z+e^{-z})} \tag{2b}$$
The parameters $$$\mu$$$ and $$$\beta$$$ can be estimated using maximum likelihood.
Let $$$r_{n,k}$$$ be the smallest pSAR10g value expected to be exceeded at least once in $$$k$$$ blocks. That is, for every block there is a $$$1/k$$$ % probability that the level $$$r_{n,k}$$$ is exceeded. The risk of underestimating pSAR10g is encapsulated by the ‘return’ level for $$$k$$$ blocks of size $$$n$$$,
$$P \left( M_{n}>r_{n,k} \right) = \frac{1}{k} \tag{3}$$
The total probability that SAR is underestimated at least once within $$$k$$$ blocks is therefore
$$P \left( \text{SAR is underestimated at least once} \right) = 1 - \left( 1-\frac{1}{k} \right) ^{k} \tag{4}$$
Results & Discussion
Conventional SAR control: A SAR cut-off value that corresponds to 1% in the right tail of a given pSAR10g distribution (Fig. 1) is equivalent to choosing the 99th percentile as a safety margin. The probability of underestimating pSAR10g at least once using the conventional approach rapidly approaches 1 for increasing numbers of scans (Fig. 2). Raising the safety margin by controlling 0.1% in the tail of the SAR distribution has the obvious effect of a larger number of scans before with probability 1 the SAR threshold is exceeded. For a given pTx coil, the question becomes one of how to select threshold values that control SAR exceedances to an acceptable level of risk.SAR control using EVT: Explicit in the EVT framework is the notion of block size, that is, the number of scans over which to control SAR exceedances. Two Gumbel distributions corresponding to $$$n=175$$$ and $$$n=750$$$ scans are depicted in Fig. 3. As expected, the distribution of the maxima shifts towards the higher values for the larger block size. For each Gumbel distribution, a return value curve was computed (Fig. 4). These curves aid risk profile comparison and the selection of acceptable SAR thresholds. For example, by establishing an acceptable probability of an extremal SAR being exceeded within any given block at $$$1/k=1/100=1$$$ %, we can set a safety margin at 1.72 and 1,62 for blocks of $$$n=750$$$ and $$$n=175$$$, respectively. Those margins would indicate, on average, a single SAR underestimation within $$$k=100$$$ blocks.
Conclusion
In this work, we have proposed the use of Extreme Value Theory as an intuitive framework by which to assess the risk of underestimating SAR and the subsequent choice of an appropriate safety margin. It was demonstrated that the conventional approach based on the raw distribution of pSAR10g values can result in a substantial probability of exceeding the SAR as scan numbers increase. In contrast, EVT provides the mechanism by which to select acceptable risk levels for given numbers of scans.Acknowledgements
No acknowledgement found.References
- Le Garrec M, Gras V, Hang MF, et al. Probabilistic analysis of the specific absorption rate intersubject variability safety factor in parallel transmission MRI. MRM. 2017;78(3):1217-23.
- Shao Y, Zeng P, Wang S. Statistical simulation of SAR variability with geometric and tissue property changes by using the unscented transform. MRM. 2015;73(6):2357-62.
- De Haan L, Ferreira A. Extreme value theory: an introduction. Springer Science & Business Media; 2006.
Figures
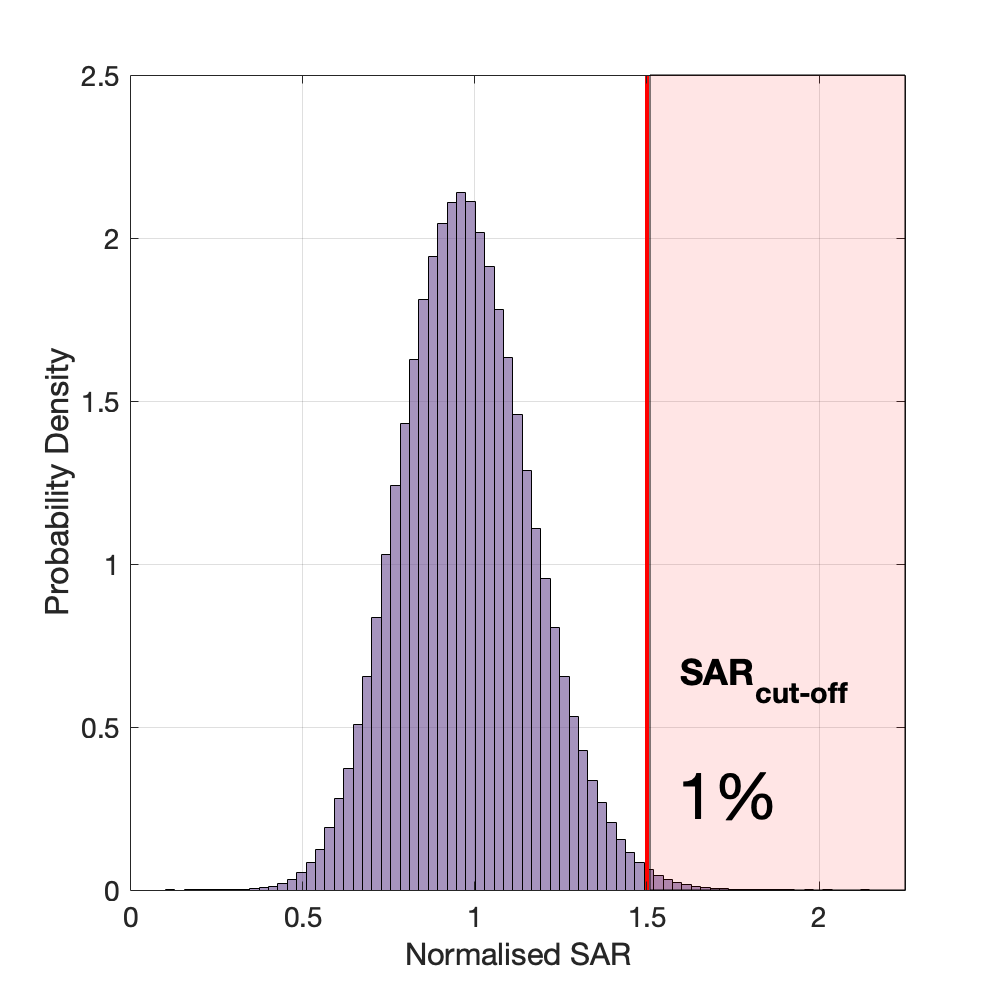
Figure 1. The conventional approach of determining the intersubject variability safety margin for a known SAR distribution is to set a threshold, SARcut-off, akin to a significance level in statistical hypothesis testing.
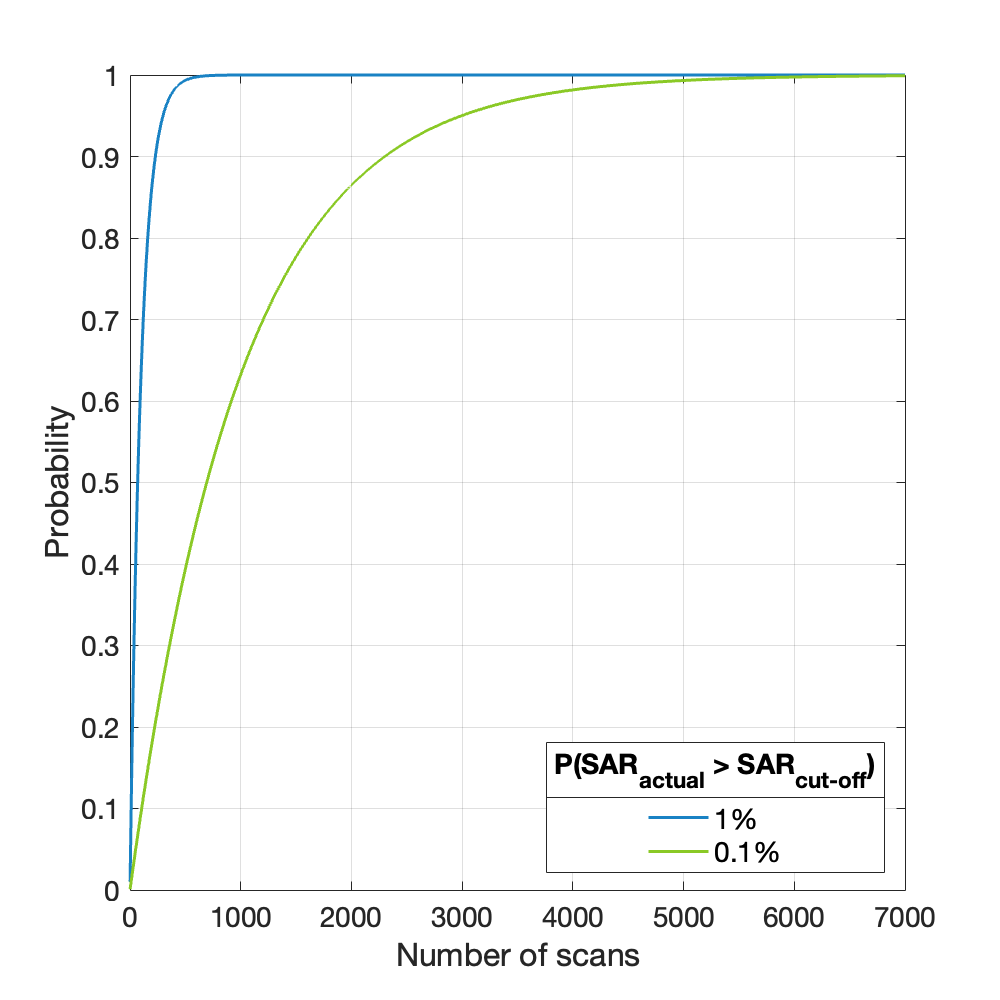
Figure 2. Probability of SAR exceeding the chosen SARcut-off value at least once for varying numbers of participants scanned.
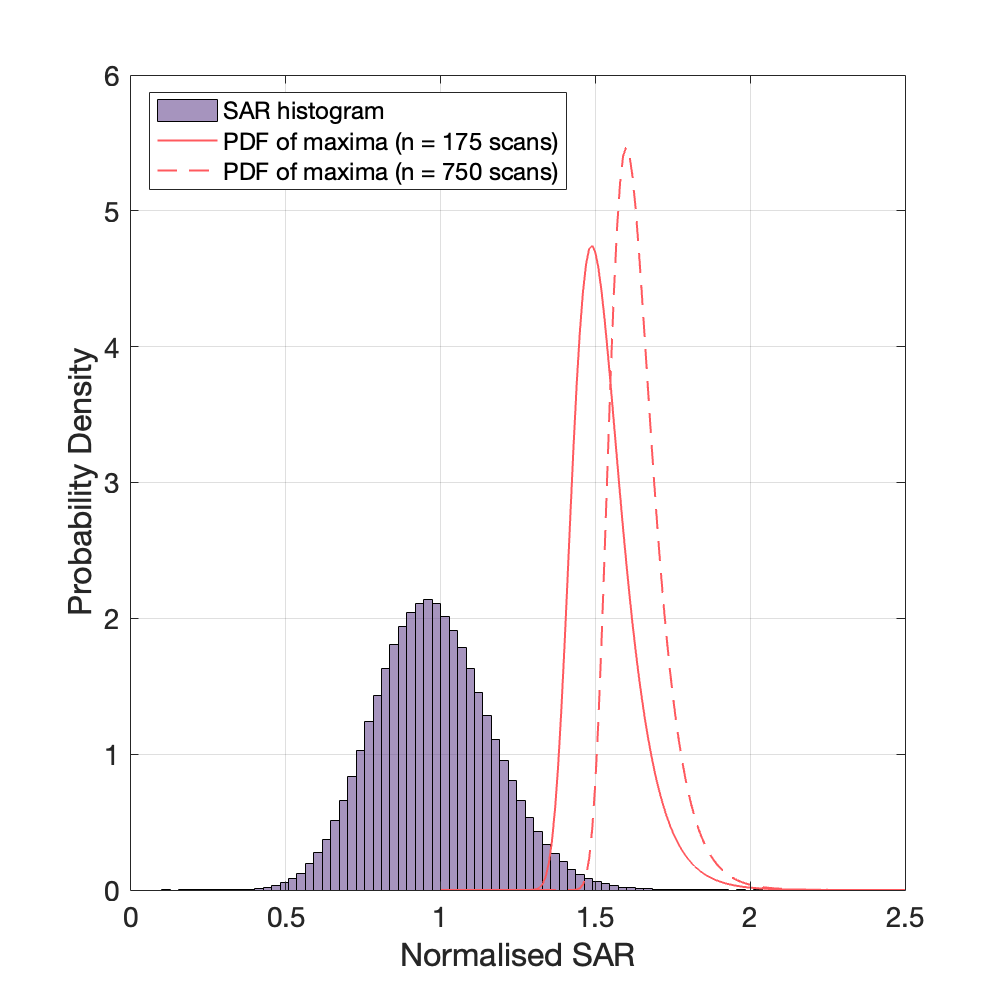
Figure 3. Comparison of the pSAR10g distribution with Gumbel distributions of pSAR10g maxima, computed for $$$n=175$$$ scans (red solid line) and $$$n=750$$$ scans (red dotted line).
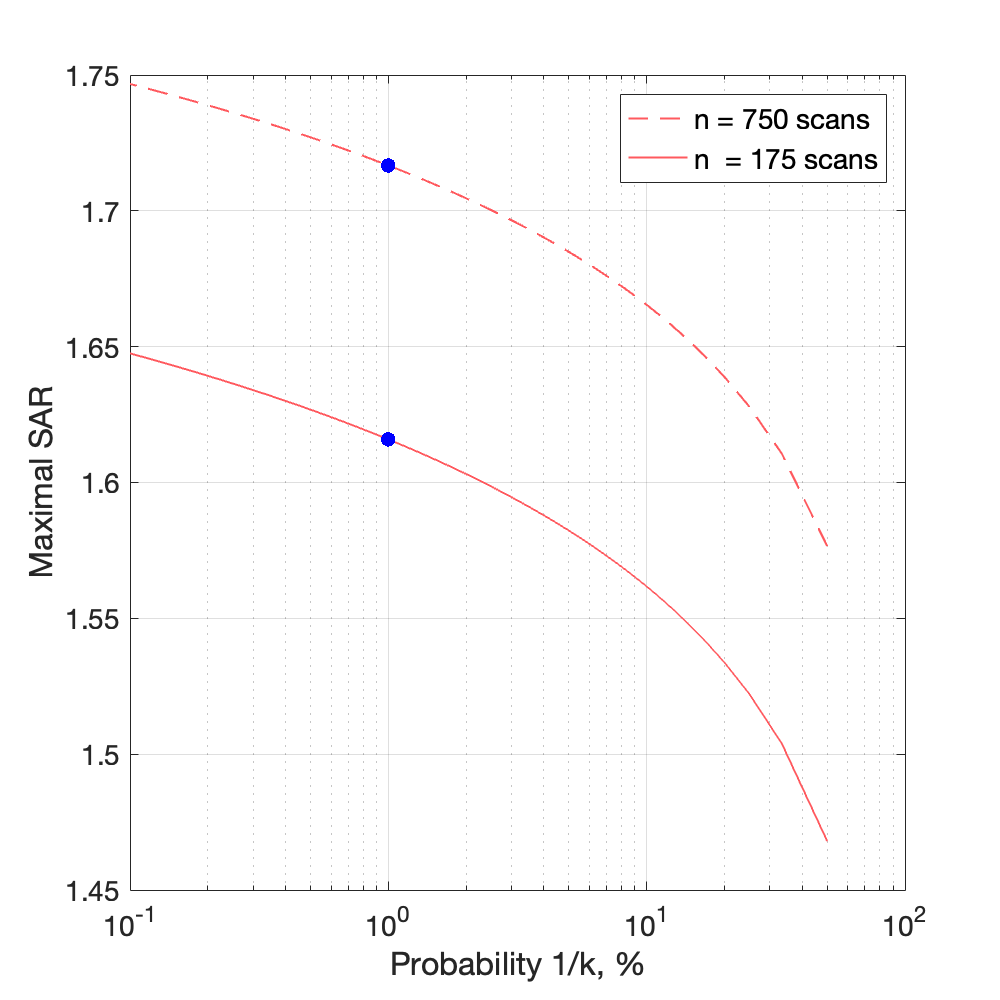
Figure 4. Probability $$$1/k$$$ of exceeding a maximal SAR level in any given block of $$$n$$$ scans. By selecting an acceptable underestimation rate $$$1/k$$$ % (which translates into average one underestimation over $$$k$$$ blocks), we can set an appropriate intersubject variability safety margin. For example, the margins set at 1.72 and 1.62 levels (blue dots) for blocks of $$$n=750$$$ and $$$n=175$$$, respectively, are expected to be exceeded within any given block with probability $$$1/k=1/100=1$$$ %,
DOI: https://doi.org/10.58530/2023/2698