2692
Towards Applying Deep Learning to Predict Rigid Motion-Induced Changes in Q-matrices from UHF-MRI pTx Simulations1Psychology, Cardiff University Brain Research Imaging Centre, Cardiff University, Cardiff, United Kingdom, 2Life Sciences & Medicine, Biomedical Engineering & Imaging Sciences, Department of Biomedical Engineering, King's College London, London, United Kingdom
Synopsis
Keywords: Safety, Parallel Transmit & Multiband, Specific absorption rate (SAR), ultra-high field MRI, deep learning
Patient motion affects the specific absorption rate (SAR), a safety parameter in MRI. SAR is often calculated using so-called Q-matrices. We used conditional generative adversarial networks (cGANs) to estimate the effect of motion on magnitude from Q-matrices, which were extracted from body models simulated in a parallel-transmit (pTx) coil tuned to operate at 7T. Networks trained on Q-matrices from two positions were extrapolated to nine others. Network-predicted Q-matrices corresponded well with simulated ground truth motion-affected Q-matrices.Introduction
Parallel transmit arrays (pTx) can alleviate wavelength-related flip-angle inhomogeneities at ultrahigh field (UHF) MRI. The potential for locally-increased power absorption has led to local specific absorption rate (SAR) becoming a pulse design constraint. The literature shows that participant movement may exacerbate SAR concerns1,2.A recent study used deep learning (DL) to estimate the effect of displacement on pTx B1+ distributions to decrease head motion-related error3. Here, we adapted that approach to safety, and used cGANs4 to predict the effect of head motion on SAR changes. The proposed approach, which is currently in development, is demonstrated on simulated Q-matrices.
Methods
Ella, Fats, Glenn, Billie, and Duke of the Virtual Population5 were simulated within a generic 8-channel pTx head coil tuned to 295MHz in Sim4Life (Zurich MedTech, Zurich, CH), similar to Ref.1. Fats and Duke were scaled by 90% to fit inside the coil (array radius: 115 mm). The simulated positions included combinations of 0/5/10/20mm right and 0/5/10mm posterior displacements. Fields were extracted from 50 slices per model.Q-matrices6,7 were 10-gram averaged over cubical volumes. Because mutual interactions between two channels (i.e., Qij and Qji where i, j are channels) are conjugates, 28 entries of the 8x8 Q-matrix are non-unique for each voxel. To prevent overfitting, these 28 entries were discarded (Figure 1b).
Figure 1a outlines the network architecture. Ella, Fats and Glenn were used for training, Billie for validation, and Duke for testing. Rightward (R) and posterior (P) motion were investigated for 5mm displacements. For each motion type, networks were trained using all combinations that yielded the same relative motion displacement (i.e., R5 vs R0 for reference, R10 vs R5 for reference), yielding 1,836 and 1,530 training datasets for R5 and P5 networks, respectively. Training each network took ~14h using a DGX-1 NVIDIA GPU. Off-axis displacements like R20, P10mm were evaluated by cascading R5 and P5 networks fourfold and twofold, respectively. To cascade, successive generators used the outputs of preceding ones as input until the target position was evaluated (Figure 1b). Finally, predicted images were smoothed with a Gaussian filter (standard deviation: 3 pixels) to mitigate high frequency artifacts from the networks.
Motion-induced error (center vs. off-center) in Q-matrices was compared with prediction error (off-center predicted vs. off-center ground truth (GT)). Comparisons provided here focus on the magnitude of Q-matrices, i.e., |Qij|. Comparisons include:
- Slice-by-slice: For each |Qij|, the normalized root-mean-squared-error (nRMSE, L2-norm) in |Qij| within the slice (along superior-inferior) was normalized with the within-slice mean of |Qij|.
- Channel-by-channel: The mean-magnitude-error (mmE, L1-norm) in the three-dimensional |Qij| was normalized with the overall mean of |Qij| (across three dimensions and all i,j).
Results and Discussion
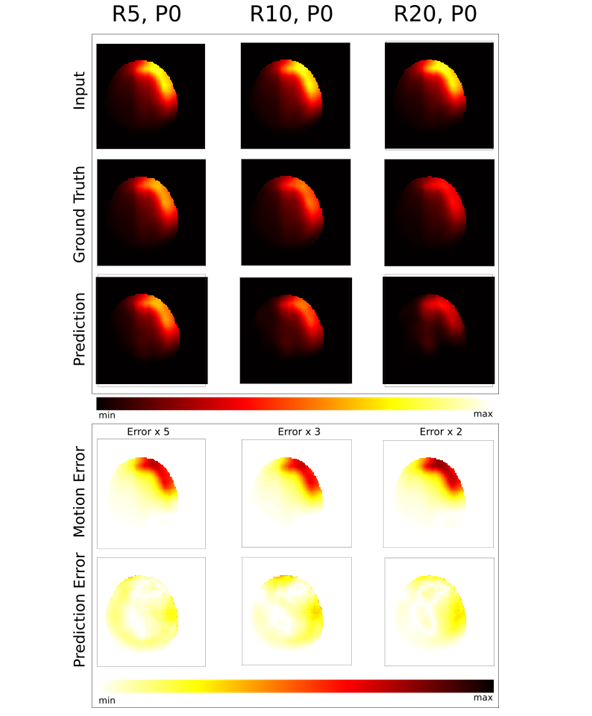
The networks reduced motion-induced error in Q-matrix magnitudes across movement types and channels. Magnitude Q-matrix displacements were predicted in ~0.5 seconds by the evaluation network.Figure 2 shows the simulated and estimated self-interactions of coil channel 2(Q22) for 5/10/20mm rightward displacements. The motion-induced and predicted error maps show that error is considerably reduced, especially in high-intensity regions near the coil. Predictions yielded lower error compared to motion for both trained and cascaded displacements. Cascading allows networks to be used for displacements outside the training dataset, and reduces the number of networks to train.
Figure 3 shows the nRMSE in the magnitude of the Q-matrix entries across all slices and channels for each displacement. The worst-case motion-induced nRMSE was 247.6%, while prediction peaked at 101.3%, with the mean errors yielding 49.80% ± 27.6% and 28.5% ±10.6%, respectively. nRMSE reduced in 76.16% of evaluations. Error values (motion-induced and predicted) are slightly scaled-up as they were normalized with the within-slice mean of the |Qij| entries.
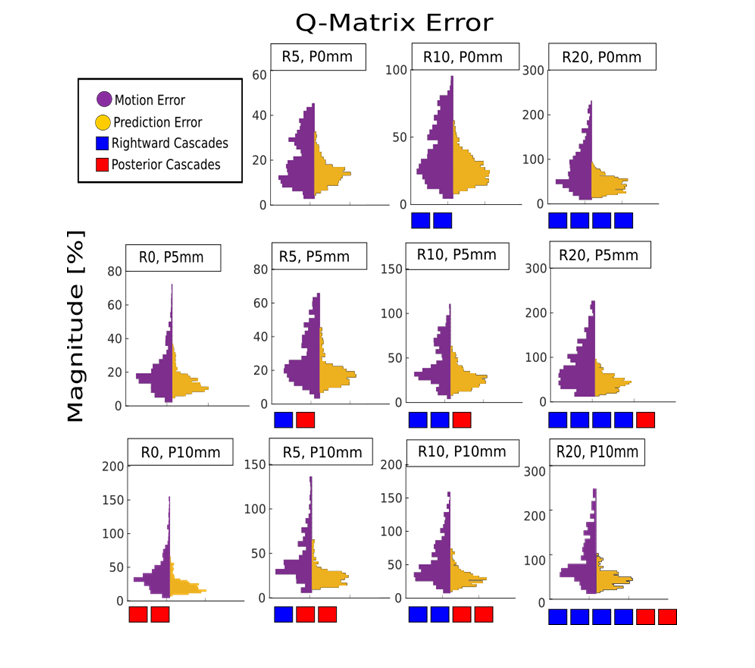
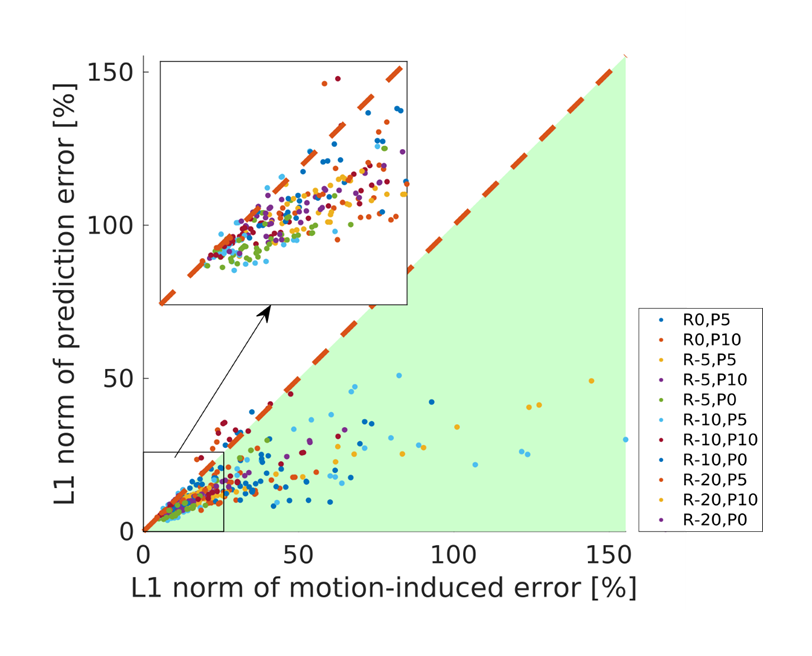
Figure 4 shows that prediction mmE averaged across slices and channels (i.e., |Qij| of Duke) is considerably lower than that of motion-induced error (max motion-induced: 176.77%; max predicted: 57.98%; mean motion-induced: 27.95% ± 8.19%, mean predicted: 15.78% ±3.86%).
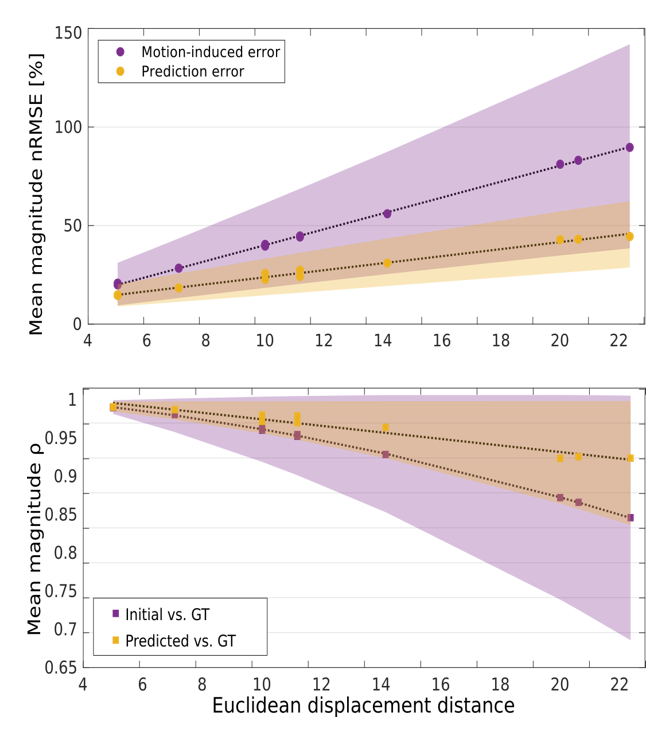
Figure 5 shows the mean error across |Qij| with respect to Euclidean displacement from the center. The lowest correlation between predicted and GT images was observed in R20, P10 with r(214)=0.32, p<0.00001. In this position, the correlation between the input and GT image was r(214)=0.00, p=1. Though an off-axis quadrupled rightward (4xR5) cascade combined with a doubled posterior cascade (2xP5) yielded the lowest correlation between prediction and GT, it was nevertheless moderate and outperformed the nonexistent correlation between motion-induced and GT matrices.
Accounting for motion-induced variations in SAR may be combined with recent work which developed subject-specific models for single-position personalized SAR predictions8. Moreover, predicting changes in positionally-varying SAR could alleviate UHF pTx acquisition from overly conservative SAR limits while maintaining patient safety.
Current evaluations focus on magnitude of |Qij|. Future work will focus on incorporating phase estimations by optimizing the present pipeline to cope with the multiple phase wrap boundaries caused by multi-channel interactions.
Conclusion
We demonstrated a preliminary method to predict movement-induced changes in magnitude from Q-matrices of 8-channel pTx coils at 7T.Acknowledgements
This project was supported in part by the Wellcome Trust [204824/Z/16/Z], by the Welsh Government [Wales Data Nation Accelerator project] and by the EPSRC [Doctoral Training Program].References
1. Kopanoglu E, Deniz CM, Erturk MA, Wise RG. Specific absorption rate implications of within‐scan patient head motion for ultra‐high field MRI. Magnetic resonance in medicine. 2020 Nov;84(5):2724-38.
2. Ajanovic A, Brackenier Y, Tomi-Tricot R, Hajnal JV, Malik S. Motion-Dependent Low-Order Predictive Linear Model for Patient Safety Assessment at 7T with Technically Feasible Coil Models.
3. Plumley A, Watkins L, Treder M, Liebig P, Murphy K, Kopanoglu E. Rigid motion‐resolved prediction using deep learning for real‐time parallel‐transmission pulse design. Magnetic Resonance in Medicine. 2022 May;87(5):2254-70.
4. Isola P, Zhu JY, Zhou T, Efros AA. Image-to-image translation with conditional adversarial networks. In Proceedings of the IEEE conference on computer vision and pattern recognition 2017 (pp. 1125-1134).
5. Andreas C, Wolfgang K, Eckhart GH, Katharina H, Marcel Z, Esra N, Wolfgang R, Rolf J, Werner B, Ji C, Berthold K, Peter S, Hans-Peter H, Jianxiang S, Michael O, Dominik S, Anthony K, Joshua WG, Niels K. The Virtual Family—development of surface-based anatomical models of two adults and two children for dosimetric simulations. Physics in Medicine & Biology 2010;55(2):N23.
6. Bardati F, Borrani A, Gerardino A, Lovisolo GA. SAR optimization in a phased array radiofrequency hyperthermia system. Specific absorption rate. IEEE Trans Biomed Eng 1995;42(12):1201-1207.
7. Graesslin I, Homann H, Biederer S, Bornert P, Nehrke K, Vernickel P, Mens G, Harvey P, Katscher U. A specific absorption rate prediction concept for parallel transmission MR. Magn Reson Med 2012;68(5):1664-1674.
8. Brink WM, Yousefi S, Bhatnagar P, Remis RF, Staring M, Webb AG. Personalized local SAR prediction for parallel transmit neuroimaging at 7T from a single T1‐weighted dataset. Magnetic Resonance in Medicine. 2022 Jul;88(1):464-75.
Figures
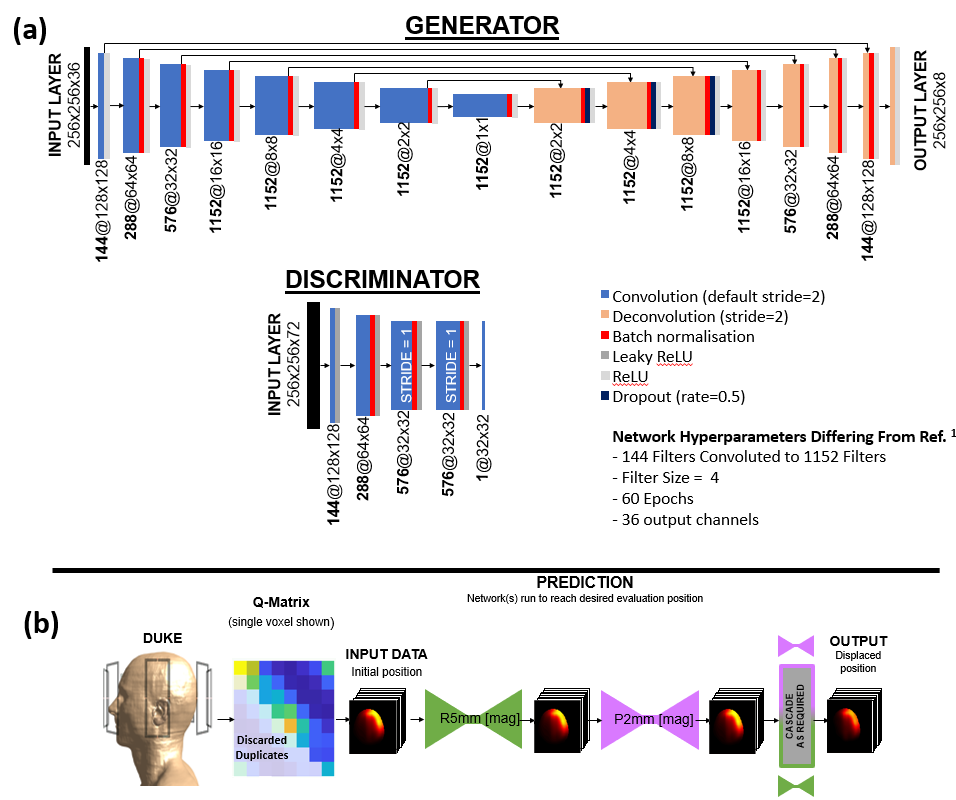
Fig.1 Adapted from Ref.3 a) cGAN architecture: Generators are U-Nets with 8 convolution and deconvolution layers, while discriminators contain 5 convolution layers. Each layer contains a rectified linear unit (ReLU) activation. Matrix size and filter quantity are below the layers. b) Testing workflow. Q-matrices are extracted from body models and duplicate entries are eliminated. Matrices from center position are input to the first trained generator. Generators were only trained for R5 and P5 but can be run sequentially until a target shifted position is reached (cascaded).