2689
Large-scale Modelling of Patient Motion for Head Coils at 7T1Biomedical Engineering Department, School of Biomedical Engineering and Imaging Sciences, King's College London, LONDON, United Kingdom, 2London Collaborative Ultra high field System (LoCUS), London, United Kingdom, 3MR Research Collaborations, SIEMENS Healthcare Limited, Frimley, United Kingdom
Synopsis
Keywords: Safety, Simulations, ultra-high field, RF arrays and systems, parallel transmit coils
The aim of this study is 2-fold. First, it is to demonstrate the practicality of using MARIE workflow to generate models with variation due to patient pose/motion. The second aim is to explore use of a simple 1st order linear model to visualise and predict the variation in B1+ and SAR with pose. Consequently, 4 different coils are simulated in more than 2200 positions with respect to body. Low variability in key metrics is observed. 1st order linear model relating position with these metrics is found to further reduce variability.Introduction
Comprehensive assessment of patient safety at 7T for parallel transmit (pTx) coils is a challenging task mainly because of the inability to address all modelling discrepancies with the computationally expensive electromagnetic (EM) simulations. Attempts have been made to address the variation in RF transmit field (B1+) and specific absorption rate (SAR) due to body shape, coil model inaccuracies or coil position with respect to body [1,5,6,7,8,9,11,12,13]. In addition, the uses of several models, mostly deep-learning-based, to predict that variation have been proposed [6,11,12]. The aim of this study is 2-fold. First, it is to demonstrate the practicality of using MR integral equation (MARIE) [1] workflow to generate models with variation due to patient pose/motion . The second aim is to explore use of a simple 1st order linear model to visualise and predict the variation in B1+ and SAR with pose.Methods
EM simulations are performed using MARIE [1] with MR Green’s Functions (MRGFs) that enable fast coil simulations for a given body model (here Duke [4]). The coils (2-channel birdcage (2ch-BCC), 2-channel shielded birdcage (2ch-sh-BCC), 8-channel planar loop array parallel transmit (8-ch-pTx) and 8-channel shielded pTx (8ch-sh-pTx)) are tune-and-matched to 298MHz using MARIE and circuit-co-simulation [2,3]. Patient motion is modelled by displacing the coils and keeping the model fixed. The analysis is focused on the circularly polarized (CP) mode of each coil. 561 coil positions were simulated for each coil, 61 of which were ‘on-axis’ (i.e. only changed one of the six rigid body transformation parameters) while the other ‘off-axis’ randomly changed all simultaneously.A distinction is made between ‘motion’ in which we imagine the patient is well-characterised at the start of the scan but subsequently moves, and ‘pose’ where we view inherent differences in the models. The former is achieved by normalising fields relative to the central ‘unperturbed’ position then examining differences; the latter is achieved by normalising fields from each position independently. In all cases, fields are normalised to the square-root of absorbed power.
First order models of both B1+ and SAR variation were also explored:
$$\Delta B_1^+(r) = B_1^0 + \alpha \Delta r \ \ (1)$$
and
$$\Delta SAR(r) = SAR^0 + \beta \Delta r \ \ (2)$$
$$$B_1^0$$$ and $$$SAR^0$$$ are the maps at the central model position; $$$\alpha$$$ and $$$\beta$$$ are coefficients corresponding to each of the rigid body transformation parameters $$$\Delta r$$$ (i.e. including rotations and translations).
The coefficients are spatially variable, and can be estimated by fitting to the simulated data. To test the practicality of using a simplistic 1st order model to predict B1+ and SAR distributions, the 560 models were separated into training (10%) and testing (90%) sets for each coil.
Results
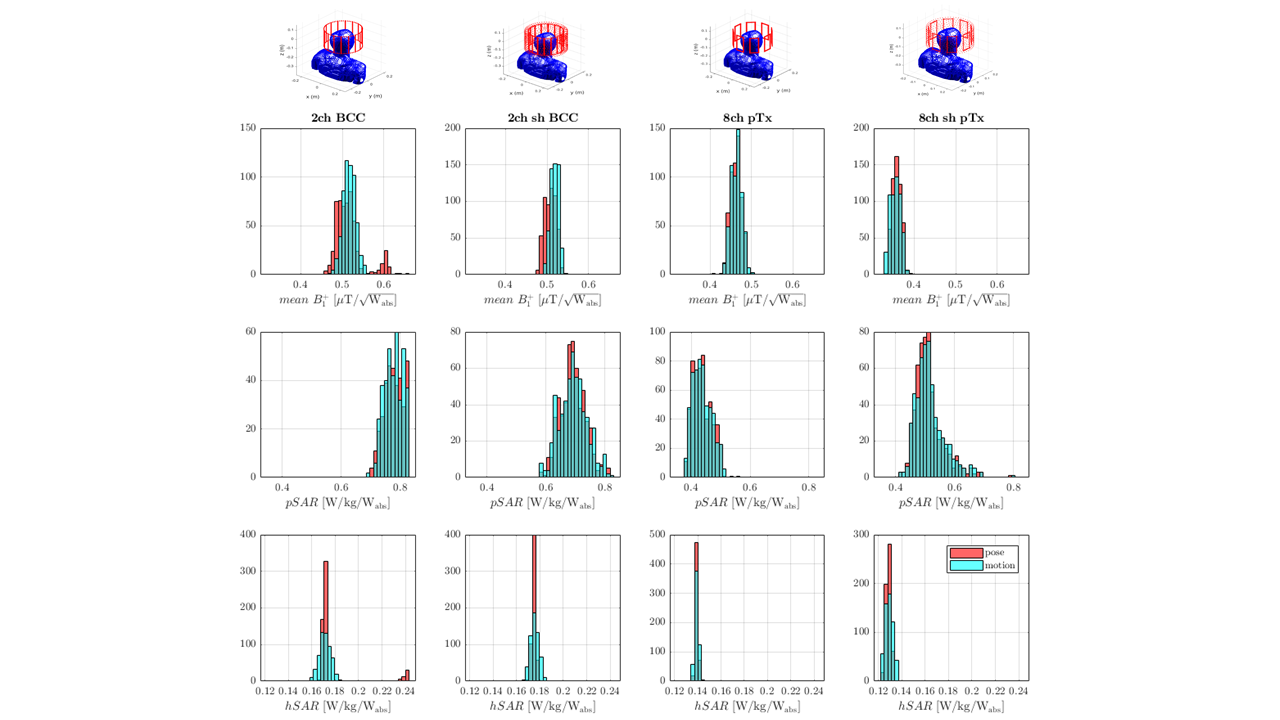
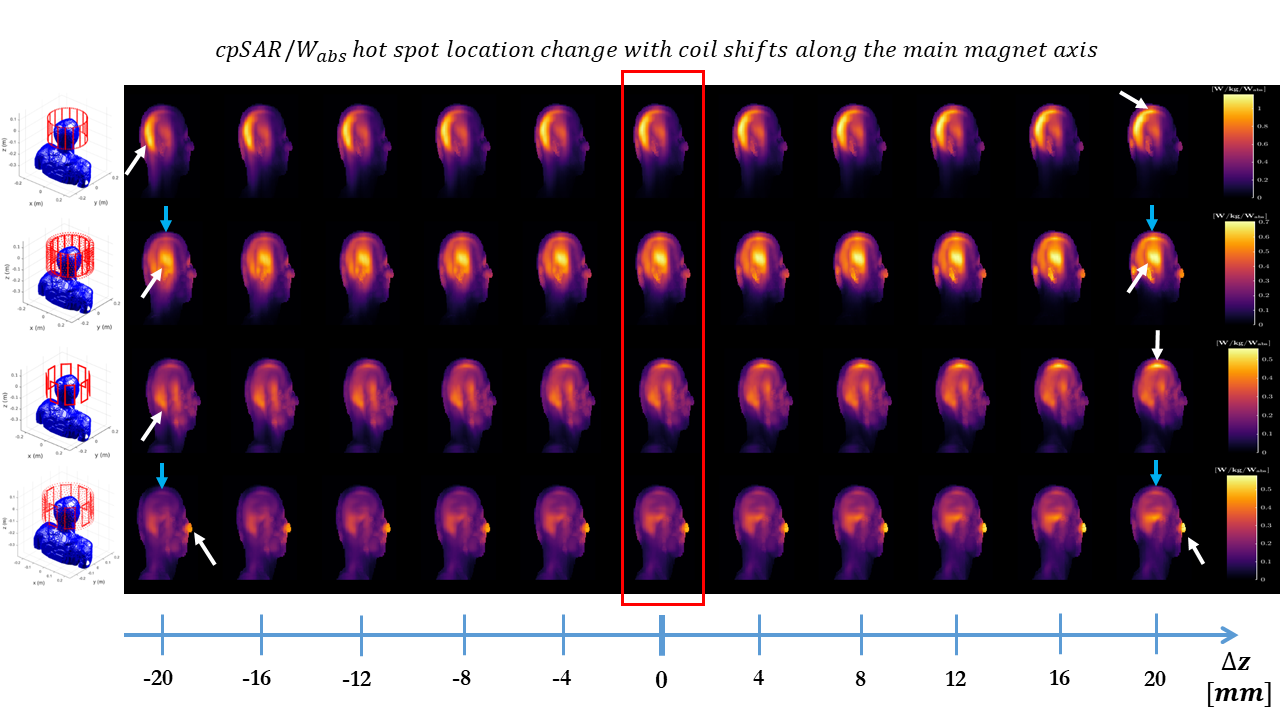
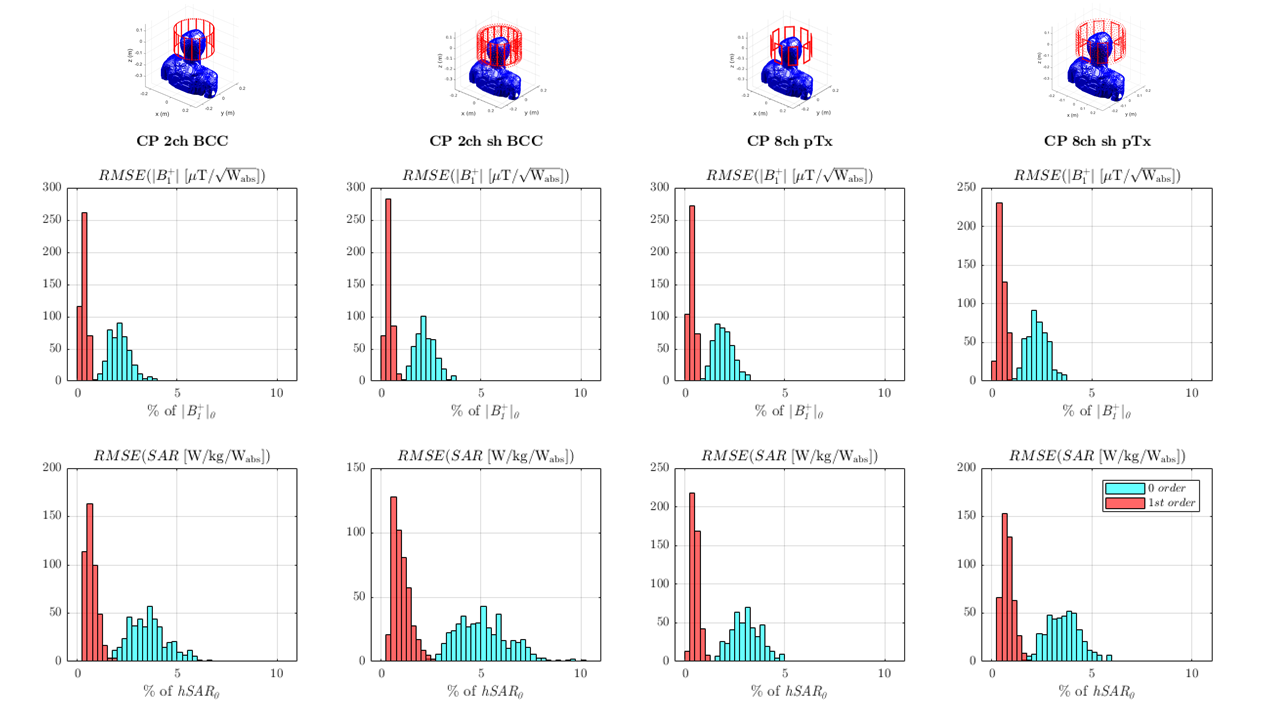
Fig.1 shows distributions of B1+, peak-SAR (pSAR) and head-averaged-SAR (hSAR) for motion and pose. In general the unshielded 8ch-pTx coil exhibits the lowest variability, and as expected hSAR is less sensitive to motion for all coil types. Distributions are similar for ‘pose’ and ‘motion’ cases, with motion results just slightly more variable.Figure 2 illustrates how the local SAR maximum (white arrows) changes location in the body as the coil is moved along the z-axis.
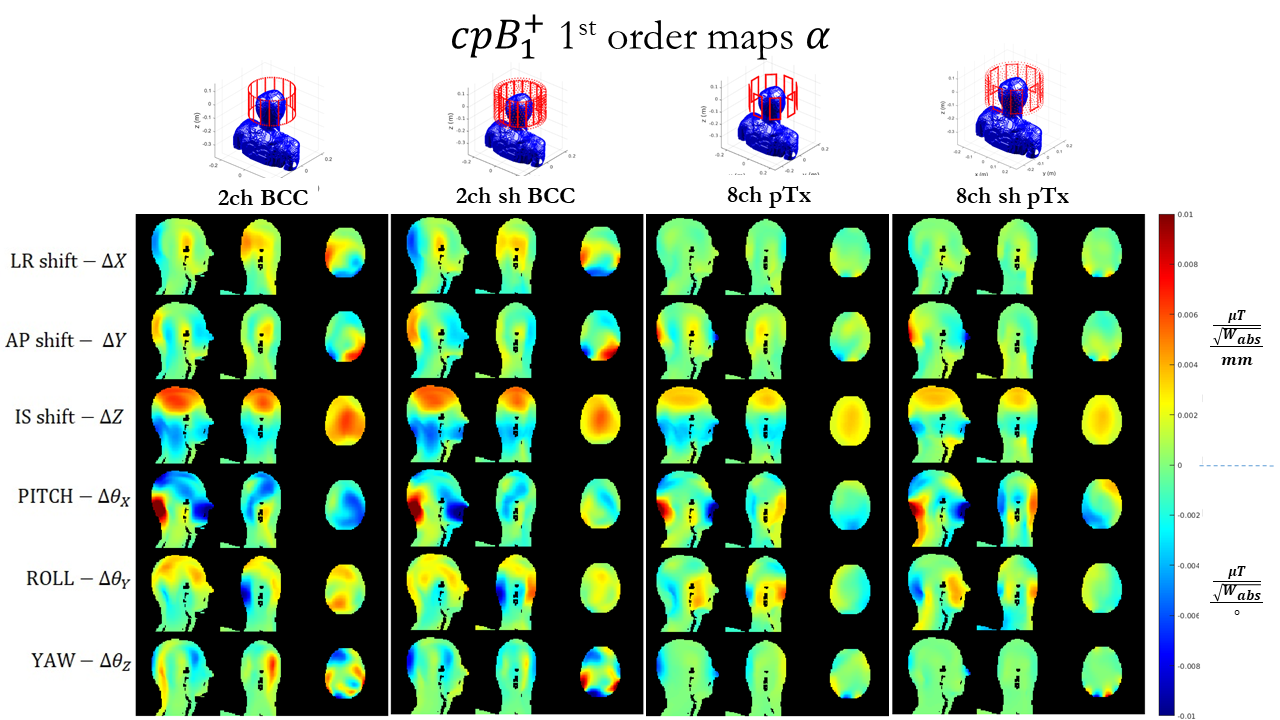
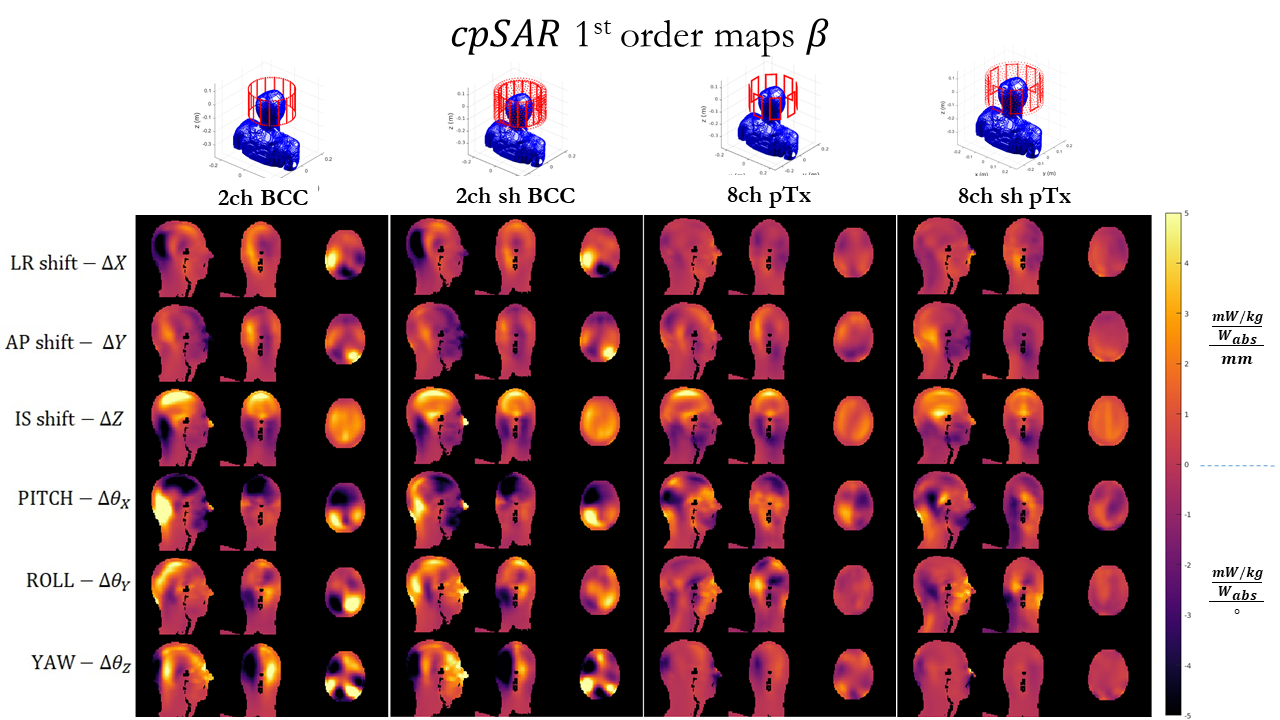
Figures 3 and 4 show coefficient maps and in units of B1+/SAR per mm of translation and per degree of rotation. Some trends are preserved between different coil designs – for example the response in B1+ to a shift in z, or to ‘pitch’ ($$$\Delta \theta_z$$$). Though there are also some differences between coils, particularly in how SAR changes with position.
Figure 5 illustrates the residuals when using these first order models, showing a clear reduction in error when compared with a 0-order model which does not account for spatial position. Errors drop from as high as 11% to <1% for SAR and from as high as 4% to <1% for B1+.
Discussion and Conclusions
This study proposes using MARIE for comprehensive exploration of over 2200 coil-body positions. Generally low variation in both B1+ (<10%) and SAR (<30% of pSAR) were observed. Use of a simple first order model relating position with these metrics was found to further reduce variability. The relatively low variation in B1+ and SAR with position was in good agreement with other published work using a similar birdcage head coil [7]. Kopanoglu and Plumley [5,13] show similar variation in the shifts along IS axis, but higher variation in AP direction for the 8ch-PTX coil. A difference that may have contributed to this is coil size – the coil simulated in this study is of larger radius, meaning that the driven ports are further away from the head, which has been demonstrated to lead to lower SAR results.This work goes hand in hand with the current studies creating protocols for comprehensive patient-specific safety prediction or analysis with or without an initial localizer scan [11,13] and assessing custom-built multi-channel RF coils with EM modelling uncertainties [12], and other explorative studies [1,5,6,7]. Combination of these studies should lead to a creation of a comprehensive protocol that addresses the 3 main modelling discrepancies at 7T and predict the necessary safety measures in real time. This in turn should help reach full potential of high-field MRI.
Acknowledgements
This work is funded by the King’s College London & Imperial College London EPSRC Centre for Doctoral Training in Medical Imaging (EP/L015226/1). This work was supported by the core funding from the Wellcome/EPSRC Centre for Medical Engineering [WT203148/Z/16/Z] and by the National Institute for Health Research (NIHR) Biomedical Research Centre based at Guy’s and St Thomas’ NHS Foundation Trust and King’s College London and/or the NIHR Clinical Research Facility. The views expressed are those of the author(s) and not necessarily those of the NHS, the NIHR or the Department of Health and Social Care.References
[1] Villena, J F, Polimeridis A G, Eryaman Y, Adalsteinsson E, Wald L L, White J K, Luca Daniel D. (2016). Fast Electromagnetic Analysis of MRI Transmit RFCoils Based on Accelerated Integral Equation Methods. IEEE Transactions on Biomedical Engineering, 63(11), 2250-2261.;
[2] Kozlov M, Turner R. (2009). Fast MRI coil analysis based on 3‐D electromagnetic and RF circuit co‐simulation. J Magn Reson. 200, 147–152.
[3] Beqiri A, Hand J W, Hajnal J V, Malik S J, Comparison between simulated decoupling regimes for speciffic absorption rate prediction in parallel transmit MRI. Magn. Reson. Med., 74(5), 1423–1434.
[4] Christ, A et al. (2009).The Virtual Family—development of surface-based anatomical models of two adults and two children for dosimetric simulations. Phys. Med. Biol. 55 N23
[5] Kopanoglu E, Deniz CM, Erturk MA, Wise RG. Specific absorption rate implications of within-scan patient head motion for ultra-high field MRI. Magn Reson Med. 2020 Nov;84(5):2724-2738.
[6] Plumley A, Watkins L, Murphy K, and Kopanoglu E (2020). Motion-resolved B1+ prediction using deep learning for real-time pTx pulse-design. ISMRM-2021.
[7] Malik SJ, Hand JW, Satnarine R, Price AN, Hajnal JV. (2021). Specific absorption rate and temperature in neonate models resulting from exposure to a 7T head coil. Magn Reson Med. Sep;86(3):1299-1313.
[8] Ajanovic, A, Hajnal J, Malik S. (2020). Positional Sensitivity of Specific Absorption Rate in Head at 7T. ISMRM-2020.
[9] Ajanovic, A, Tomi-Tricot R, Hajnal J, Malik S. (2021). Motion and Pose Variability of SAR Estimation with Parallel Transmission at 7T. ISMRM-2021.
[10] Hurley, S.A., Yarnykh, V.L., Johnson, K.M., Field, A.S., Alexander, A.L. and Samsonov, A.A. (2012), Simultaneous variable flip angle–actual flip angle imaging method for improved accuracy and precision of three-dimensional T1 and B1 measurements. Magn. Reson. Med., 68: 54-64.
[11] Brink, W. et al. Fast Subject-Specific Local SAR and B1+ Prediction for PTx at 7T using only an Initial Localizer Scan. ISMRM-2022.
[12] Sadeghi-Tarakameh, A. Safety Assessment of Custom-Built Multi-Channel RF Coils: EM Modeling Uncertainties. ISMRM-2022.
[13] Plumley, A. et al. Inter-subject differences in SAR sensitivity to motion with parallel-transmit at 7T ISMRM 2022. ISMRM-2022.
Figures