2688
Workflow proposal to test SAR virtual observation points with convex optimization: application to intersubject variability at 11.7T MRI1CEA, CNRS, BAOBAB, Neurospin, University of Paris Saclay, Gif sur Yvette, France, 2IRFU, Paris Saclay University, Gif-sur-Yvette, France
Synopsis
Keywords: Safety, Brain Connectivity
Efficient monitoring of the specific absorption rate (SAR) in parallel-transmission MRI is performed by evaluating the RF power deposition on specific SAR matrices called Virtual Observation Points (VOPs). But given the various sources of uncertainties that occur in practice (head placement, anatomy, precision of the body model to name a few), a challenging task remains to determine a suitable safety margin to be applied on the VOPs to offer a tradeoff between safety and scanning performance. In this work, as a first step towards this, we propose a workflow to tackle this problem for brain imaging at 11.7 Tesla.Introduction
Parallel transmission (pTX) is a versatile solution to enable UHF MRI of the human body, where radiofrequency (RF) field inhomogeneity appears very challenging. Today, monitoring of the specific absorption rate (SAR) in pTX essentially relies on precise electromagnetic simulations (SAR model) able to return the local SAR distribution inside the body in response to any applied pTX RF waveform1-3. SAR monotoring is then performed by evaluating the RF power deposition on specific SAR matrices called Virtual Observation Points (VOPs)3, obtained by compression of the SAR model3-6. In that framework, given the various sources of uncertainties that occur in practice, a challenging task remains to determine a suitable safety margin to be applied on the VOPs to offer a tradeoff between safety and scanning performance7-9. In this work, as a first step towards this, we propose a workflow to tackle this problem for a 11.7 Tesla head imaging setup.Theory
$$$\newcommand{\Q}{\mathbf{\mathrm{Q}}}\newcommand{\Qset}{\mathcal{Q}}\newcommand{\x}{\mathbf{x}}\newcommand{\r}{\mathbf{r}}\newcommand{\M}{\mathcal{M}}\newcommand{\sar}{\mathrm{SAR}}\newcommand{\sed}{\mathrm{SED}}\newcommand{\C}{\mathrm{R}_{\mathcal{Q}^*}(\mathbf{\mathrm{Q}})}\newcommand{\X}{\mathbf{\mathrm{X}}}\newcommand{\Y}{\mathbf{\mathrm{Y}}}\newcommand{\H}{\mathcal{H}_+^{N_c}}\newcommand{\tr}{\mathrm{trace}}$$$Provided that the electric field distribution per Watt of forward RF power is known for every transmitter, the local SAR at a given position in the body can be expressed mathematically as the evaluation of a complex Hermitian matrix $$$\Q(\r)$$$ on the vector $$$\x(t)=\left(x_i(t)\right)_{1\le i\le{N_c}}$$$ formed by the complex RF voltages applied to the channels $$$1{\cdots}N_c$$$ of the TX array, i.e. $$$\sar(\Q(\r),\x(t))=\x(t)^H\Q(\r)\x(t)$$$ ($$$\cdot^H$$$ for the Hermitian conjugate). In what follows, given a body model $$$\M$$$, $$$\Qset_\M:=\left\{\Q(\r);\r\in\M\right\}$$$ is called the SAR model on $$$\M$$$.An unconditionally safe VOP model is a set of positive definite matrices $$$\Qset^*$$$ that guarantees that for any model $$$\M$$$ and for any pTX RF waveform $$$\x(t)$$$:$$\forall\Q\in\Qset_\M,\exists\Q^*\in\Qset^*\:\mathrm{such\:that}:\:\forall t;\sed(\Q,\x,t)\le\sed(\Q^*,\x,t)$$where:
$$\sed(\Q,\x,t)=\int_{0}^{t}\sar(\Q,\x(t))dt'\label{cond_sed}$$
This condition implies that for any RF shim $$$\x$$$:
$$\exists\Q^*\in\Qset^*\:\mathrm{such\:that}:\:\sar(\Q,\x)\le\sar(\Q^*,\x)\label{cond_sar}$$
We can show that:
- The above condition is satisfied on $$$\Q$$$ if the so-called safety criterion $$$\C$$$ defined as:
does not exceed 1;
2. the above defined criterion can be computed by convex programming:
$$\C=\max_{\x}\left(\x^H\Q\x\right)\:\mathrm{subject\:to}:\:\x^H\Q^*\x\le1\:\forall\:\Q^*\in\Qset^*$$.
To summarize, given a VOP set $$$\Qset^*$$$, the criterion $$$\C$$$ provides a mathematically proven worst-case across all possible RF shims. Importantly, this worst-case does not necessarily correspond to an eigenvalue of $$$\Q$$$.
Material and methods
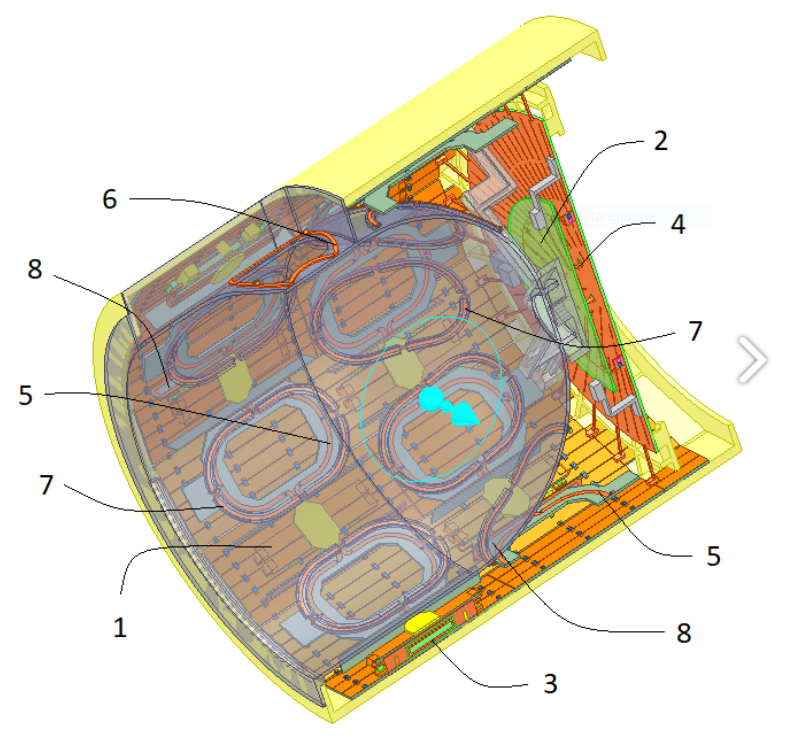
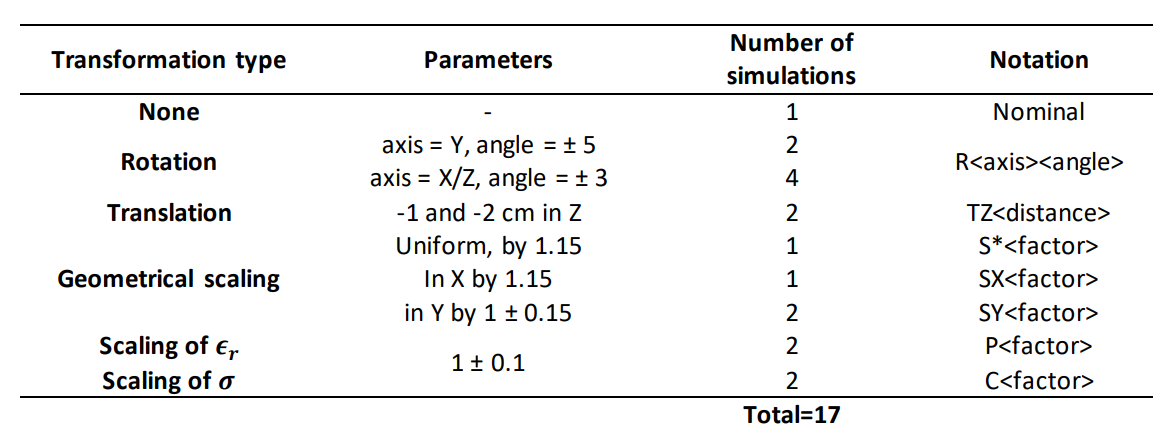
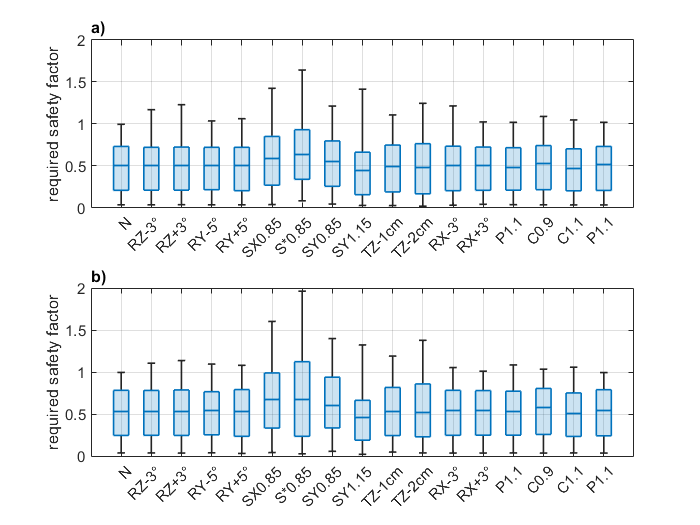
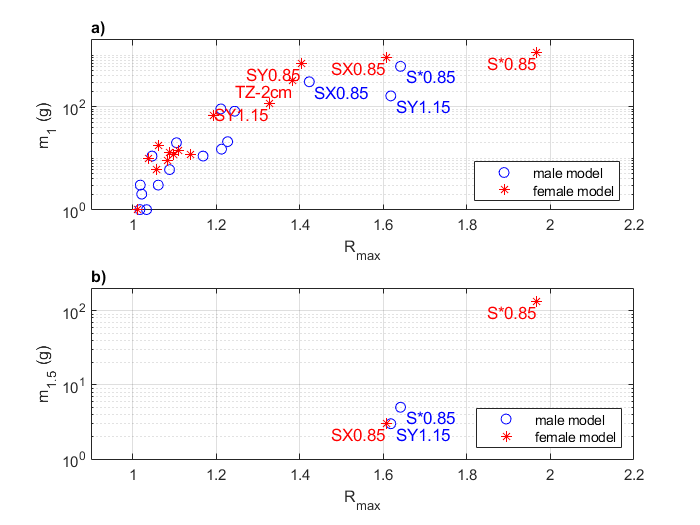
Safety criterion maps were computed numerically on a collection of simulation data on a 16TX head coil array model tuned at 500 MHz10 (Iseult coil for 11.7T brain MRI) (see Figure 1). Two numerical head models (male and female) comprising nine different tissues were used for this study. Electromagnetic simulations were performed with HFSS. A set of 16 transformations (see Table 1) was applied to each model in order to mimic a variation of the placement of the head, its size and its electric properties. From each simulation, the theoretical 10g-average SAR matrix was computed voxel-wise . A VOP set was computed from the two "nominal" simulations using a VOP compression parameter of 1/kg. For each simulation, the safety criterion was computed voxel by voxel using a sequential quadratic programing algorithm provided in the Optimization Toolbox of Matlab. We computed on each R-map:- The maximum (Rmax)
- The mass of tissue in gram where R>1 (m1)
- The mass of tissue in gram where R>1.5 (m1.5)
Results
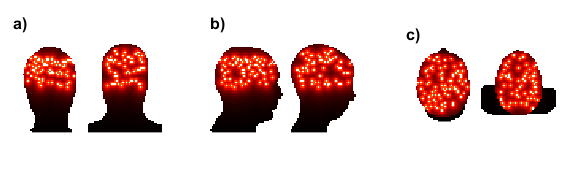
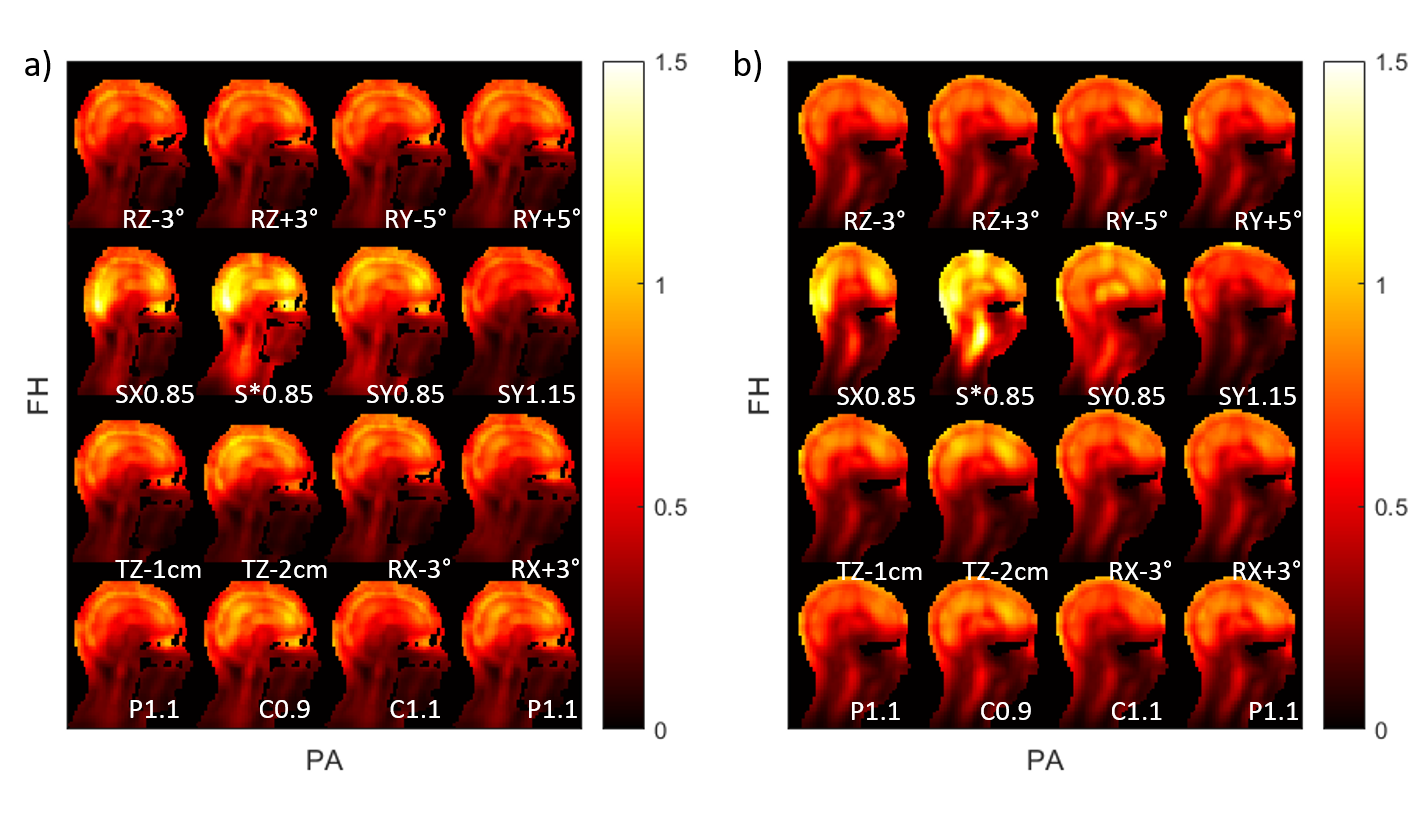
After compression, the number of VOPs was 150. A graphical representation of these VOP is provided in Figure 2. The R-maps for all 16 transformations and both body models are shown in Figure 3 (sagittal view). Box plots of the safety criterion across voxels are reported in Figure 4. It appears that the most influencing transformations are the geometrical scaling S*0.85, SX0.85, SY0.85 and SY1.15 (Rmax ~ 1.4 or above), the translation TZ-2cm (Rmax ~ 1.3). The rotations did not lead to a Rmax greater than 1.3. Finally, the variations in the dielectric properties had the smallest influence (Rmax < 1.1). A value less than 1 guarantees that a given Q matrix is upper-bounded by the VOP set. In Figure 4, we report the Rmax, m1 and the m1.5 metrics for both body models. We observe that m1.5 reaches in the worst case 100 gram.Discussion and conclusion
Given the high dimensionality offered by pTX, testing random excitations hardly approaches the worst-case scenario hinted by computation of the R-map. Interestingly also, Rmax can directly be used as the (worst case) necessary safety margin, introduced in the literature for the use of VOPs in practice7-9. The safety criterion method has been applied on two sets of 17 electromagnetic simulations to quantify the effect of experimental uncertainties (head position, head shape, tissue electric properties) on local SAR monitoring using VOPs. We found here that a multiplicative safety factor of 1.5 on the VOP model was likely to be sufficient to confidently operate with the generated VOP model, a factor of 2 being the absolute worst case in this test study. This factor is consistent with the safety factor normally applied for 7T brain MRI9, suggesting that the increase in the Larmor frequency does not lead to a dramatic increase in the interindividual variability of the SAR as compared to 7T. Naturally, to gain confidence on the safety factor estimate, it would be beneficial to add new body models transformation combinations. The mass of tissue being potentially SAR underestimated with a VOP model (m1) also provides useful information for risk assessment.Acknowledgements
No acknowledgement found.References
1. S. Wolf, D. Diehl, M. Gebhardt, J. Mallow, et O. Speck, « SAR simulations for high-field MRI: How much detail, effort, and accuracy is needed? », Magnetic Resonance in Medicine, vol. 69, no 4, Art. no 4, 2013, doi: 10.1002/mrm.24329.
2. Graesslin, I. et al. (2012) ‘A specific absorption rate prediction concept for parallel transmission MR’, Magn Reson Med, 68(5), pp. 1664–1674. doi:10.1002/mrm.24138.
3. Eichfelder, G. and Gebhardt, M. (2011) ‘Local specific absorption rate control for parallel transmission by virtual observation points’, Magn Reson Med, 66(5), pp. 1468–1476. doi:10.1002/mrm.22927.
4. J. Lee, M. Gebhardt, L. L. Wald, et E. Adalsteinsson, « Local SAR in parallel transmission pulse design », Magn Reson Med, vol. 67, no 6, Art. no 6, 2012, doi: 10.1002/mrm.23140.
5. Kuehne, A. et al (2017). ‘Massively accelerated VOP compression for population-scale RF safety models’, In proceedings of the 25th ISMRM conference, Honolulu, HI, United States. Available: https://cds.ismrm.org/protected/17MPresentations/abstracts/0478.html.
6. S. Orzada, T. M. Fiedler, H. H. Quick, et M. E. Ladd, « Local SAR compression algorithm with improved compression, speed, and flexibility », Magn. Reson. Med., vol. 86, no 1, p. 561‑568, juill. 2021, doi: 10.1002/mrm.28739.
7. M. de Greef, O. Ipek, A. J. E. Raaijmakers, J. Crezee, et C. A. T. van den Berg, « Specific absorption rate intersubject variability in 7T parallel transmit MRI of the head », Magn Reson Med, vol. 69, no 5, Art. no 5, 2013, doi: 10.1002/mrm.24378.
8. Y. Shao, P. Zeng, et S. Wang, « Statistical simulation of SAR variability with geometric and tissue property changes by using the unscented transform: Statistical SAR », Magnetic Resonance in Medicine, vol. 73, no 6, Art. no 6, juin 2015, doi: 10.1002/mrm.25367.
9. M. Le Garrec, V. Gras, M.-F. Hang, G. Ferrand, M. Luong, et N. Boulant, « Probabilistic analysis of the specific absorption rate intersubject variability safety factor in parallel transmission MRI », Magnetic Resonance in Medicine, sept. 2016, doi: 10.1002/mrm.26468.
10. Luong, M. et al. ‘A Compact 16Tx-32Rx Geometrically Decoupled Phased Array for 11.7T MRI’, In proceedings of the ISMRM-ESMRMB & ISMRT 31st Annual Meeting, Abstract 707 (June 2022). https://index.mirasmart.com/ISMRM2022/PDFfiles/0707.html.
Figures