2686
Specific Absorption Rate (SAR) Simulations for Ultra-low-field (<0.1 T) MRI Systems1C.J.Gorter MRI center, Department of Radiology, Leiden University Medical Center, Leiden, Netherlands, 2Percuros B.V., Leiden, Netherlands
Synopsis
Keywords: Low-Field MRI, Safety, specific absorption rate, transmit efficiency, electromagnetic simulations
Simulations of the magnetic and electric fields produced by RF coil commonly used at ultra-low field systems (from 0.05 to 0.1 tesla) have been performed. The highest SAR locations is present in tissues such as the nose and skull that are closest to the coil. Based on these simulations, the specific absorption rate (SAR) efficiency can be derived to ensure safe operation on point-of-care (POC) MRI systems.Introduction
The development of low field point-of-care (POC) MRI systems for neuroimaging has grown significantly in recent years with different field strengths from ~0.05 to 0.1 Tesla1-9. Under conditions in which tissue conductivity is frequency-independent, and the RF skin depth is large compared to the dimensions of the object, then the specific absorption rate (SAR) scales as the square of the frequency. Indeed, most publications simply state that SAR is much less or even not a problem at low field. However, due to limited space in POC, the RF transmit coils are typically tight-fitting around the head, which means that the electric fields surrounding the coil conductors can penetrate into the skull. Most RF coils are variations on a solenoidal geometry, which produces relatively high conservative electric fields. Another factor is that the B0 homogeneity over the brain in POC systems is many orders of magnitude lower than for conventional whole-body superconducting clinical magnets, and so shorter RF pulses are typically required to excite the relatively large bandwidth of the proton resonances: shorter pulses require higher B1 strength for a given tip angle, and this results in an increased SAR. Even with these factors, SAR is still much less than clinical field strengths. A few experimental and analytical studies on SAR at ultra-low fields have been reported. However, none of these studies considered the practical condition of POC systems 10,12,15.In this work we performed detailed electromagnetic (EM) simulations at four different fields strength, using semi-elliptical helix RF coil geometries16 designed for adult neuroimaging. The coil was considered to be very close fitting to the head. The transmit magnetic field efficiency (B1+ per $$$\sqrt{W}$$$input power), transmit electric field, SAR (10 gram averaged), and SAR efficiency (B1+ per $$$\sqrt{W/Kg})$$$ were characterized. Experimental B1+ maps were acquired to compare with simulation results. The effect of a close-fitting RF shield was quantified in terms of changes in transmit efficiency and SAR efficiency.
Methods
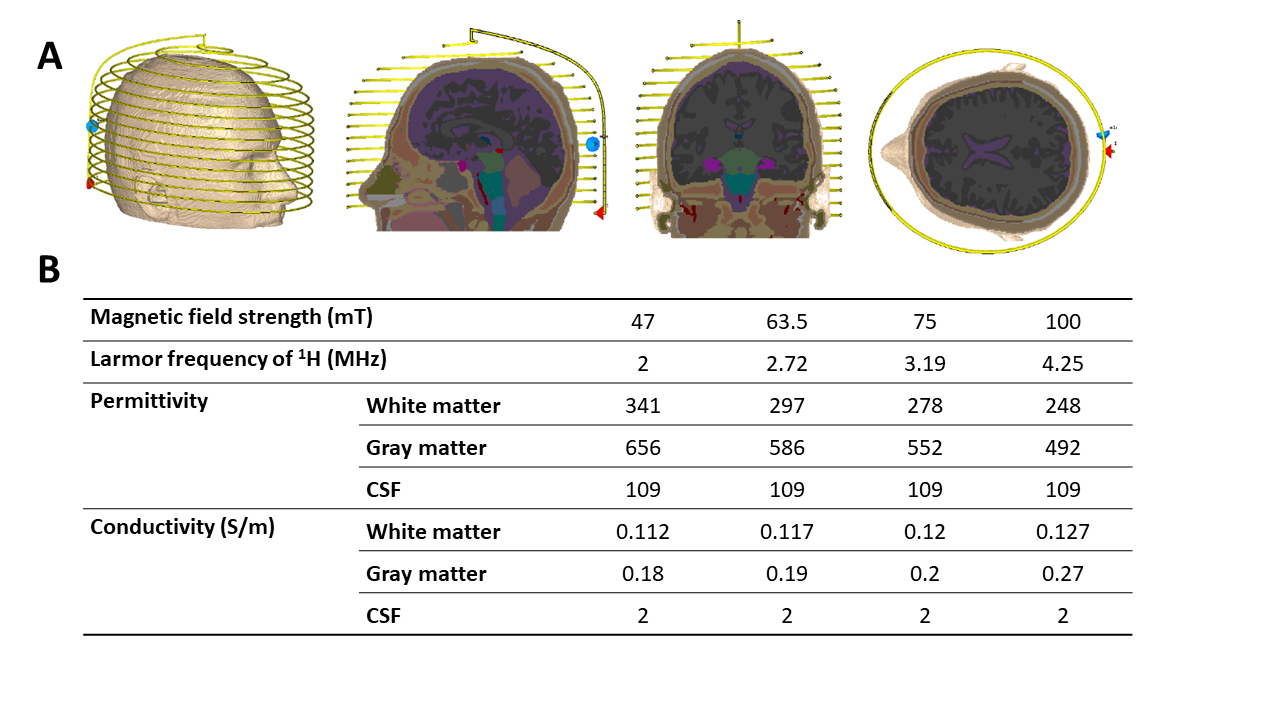
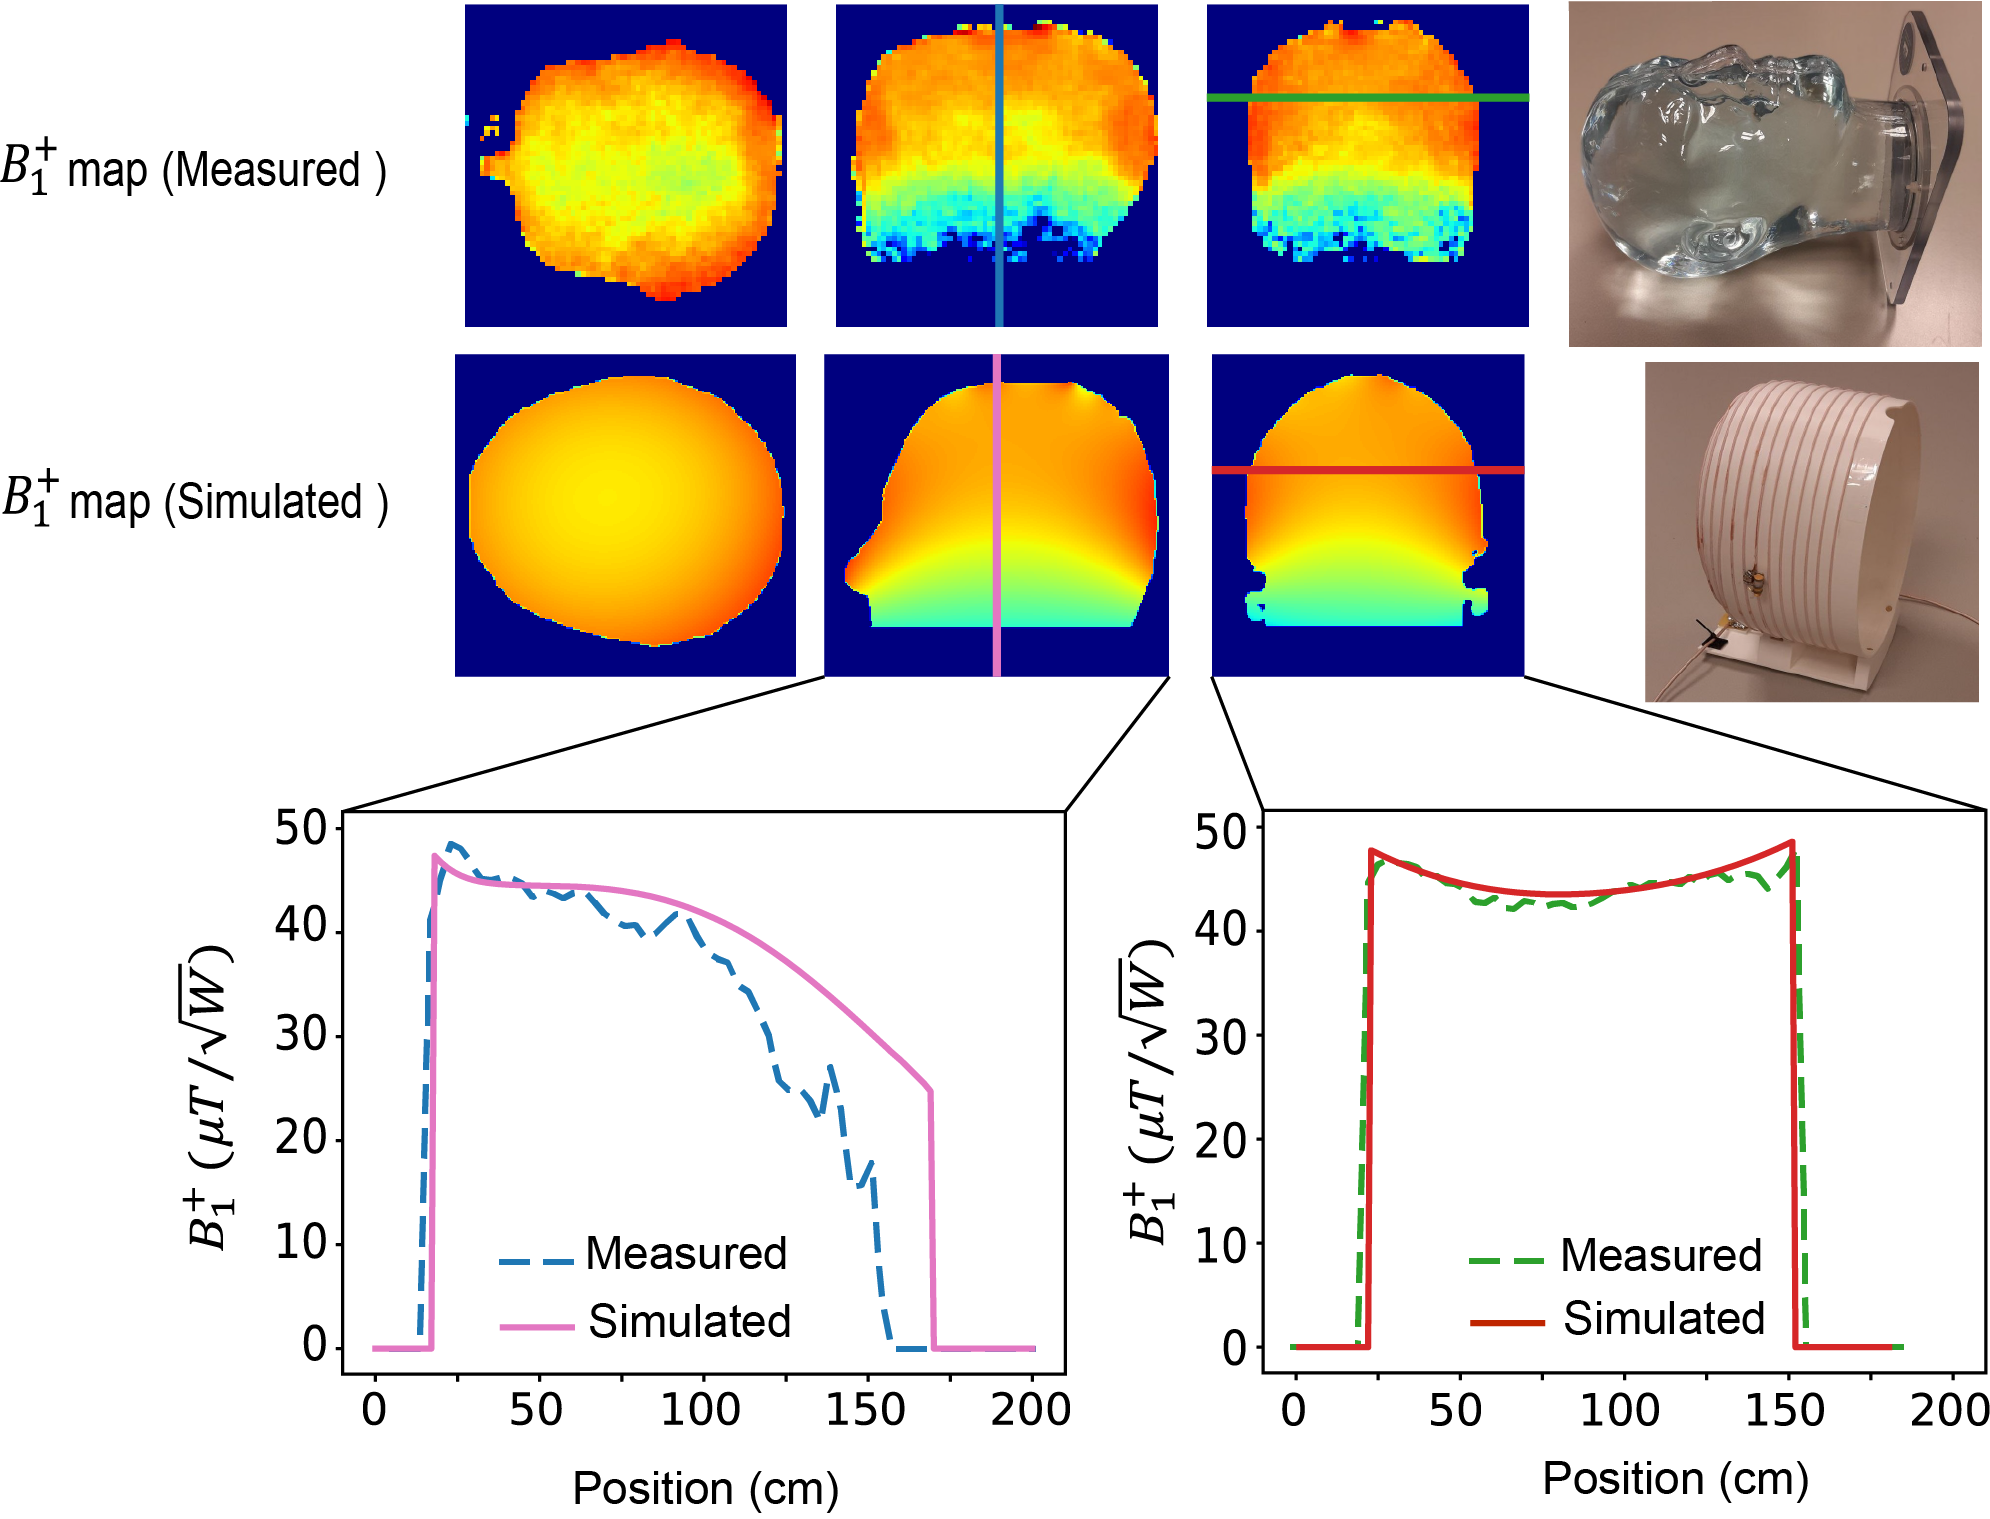
Electromagnetic simulations: Electromagnetic simulations were performed in CST Microwave Studio (CST GmbH, Darmstadt, Germany ). A semi-elliptical helix, consisting of 15 turns of copper wire of 1.5 mm diameter, with one capacitive segmentation halfway along the wire length was simulated. The coil was tuned and matched to its respective Larmor frequency. The coil had dimensions of 180 mm width, 240 mm height, and 170 mm depth. The RF shield was 300 mm in diameter with a length of 350 mm and a copper thickness of 60 mm. Figure 1A shows the setups for the EM simulations for the coil. Figure 1B lists permittivity and conductivity varying with frequency for the main brain constituents (white matter, gray matter, and cerebrospinal fluid) used in the simulations. These simulations took into account the frequency-dependence of the permittivity and conductivity of different head tissues.Experimental B1+ Mapping: To validate the simulation data, a B1+ map from the semi-elliptical helix coil was acquired at 2 MHz on a low field system 8,13, and compared with simulation data at the same frequency. A three-dimensional double angle mapping (DAM) method was used16 with two 3D gradient echo (GRE) sequences with flip angles of 60° and 120°. The B1+ maps were calculated on a pixel-by-pixel basis from the corresponding tip angle (a) maps using the formula:
$$\alpha=\cos^{-1}\left(\frac{S_2}{2S_1}\right)=\gamma B_1^+\tau \;\;\;\;[1]$$
where S1 and S2 are the signal intensity of images acquired 60° and 120°, respectively, and $$$\tau$$$ is the RF pulse duration time.
Results
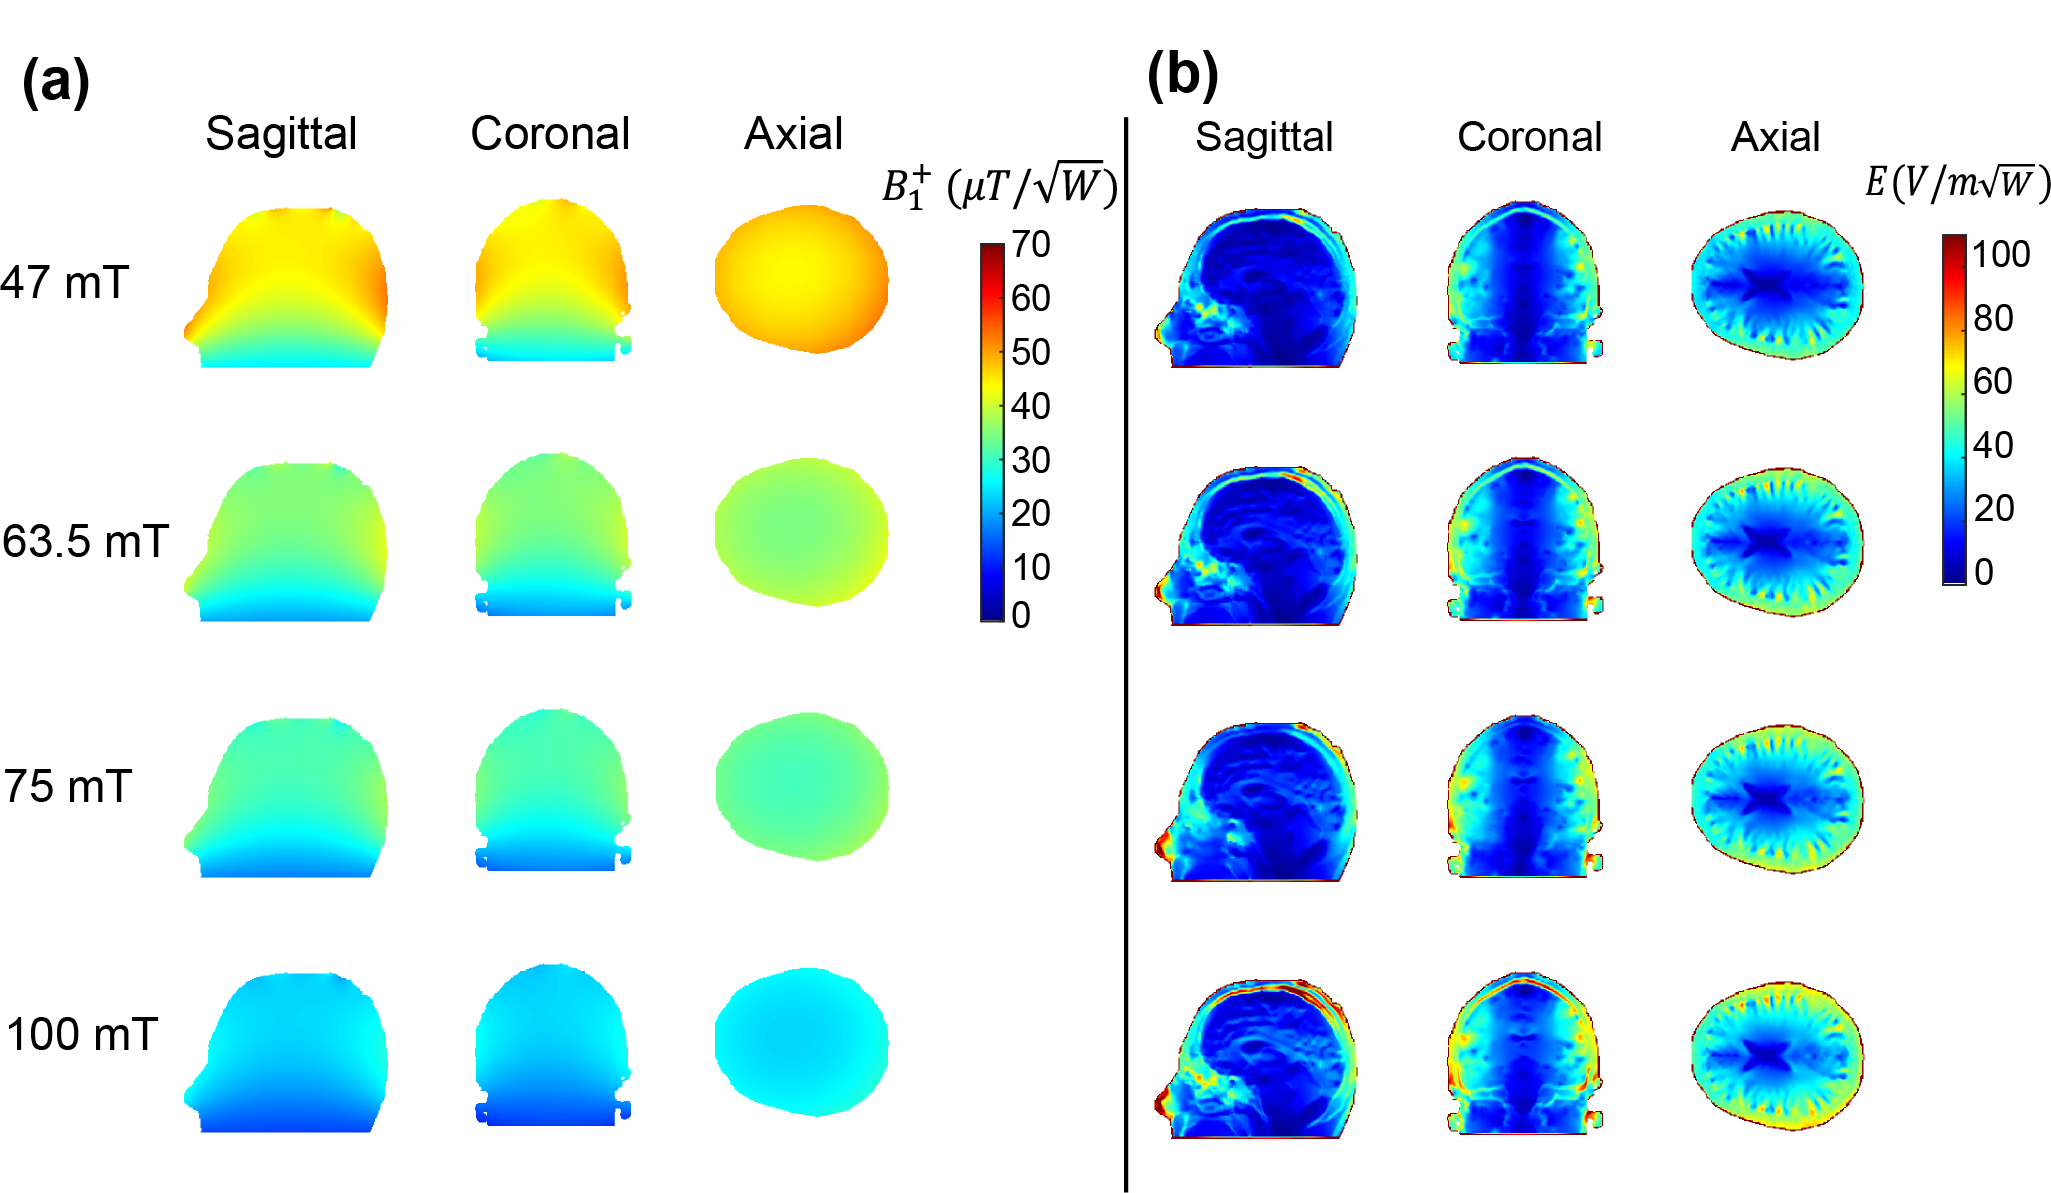
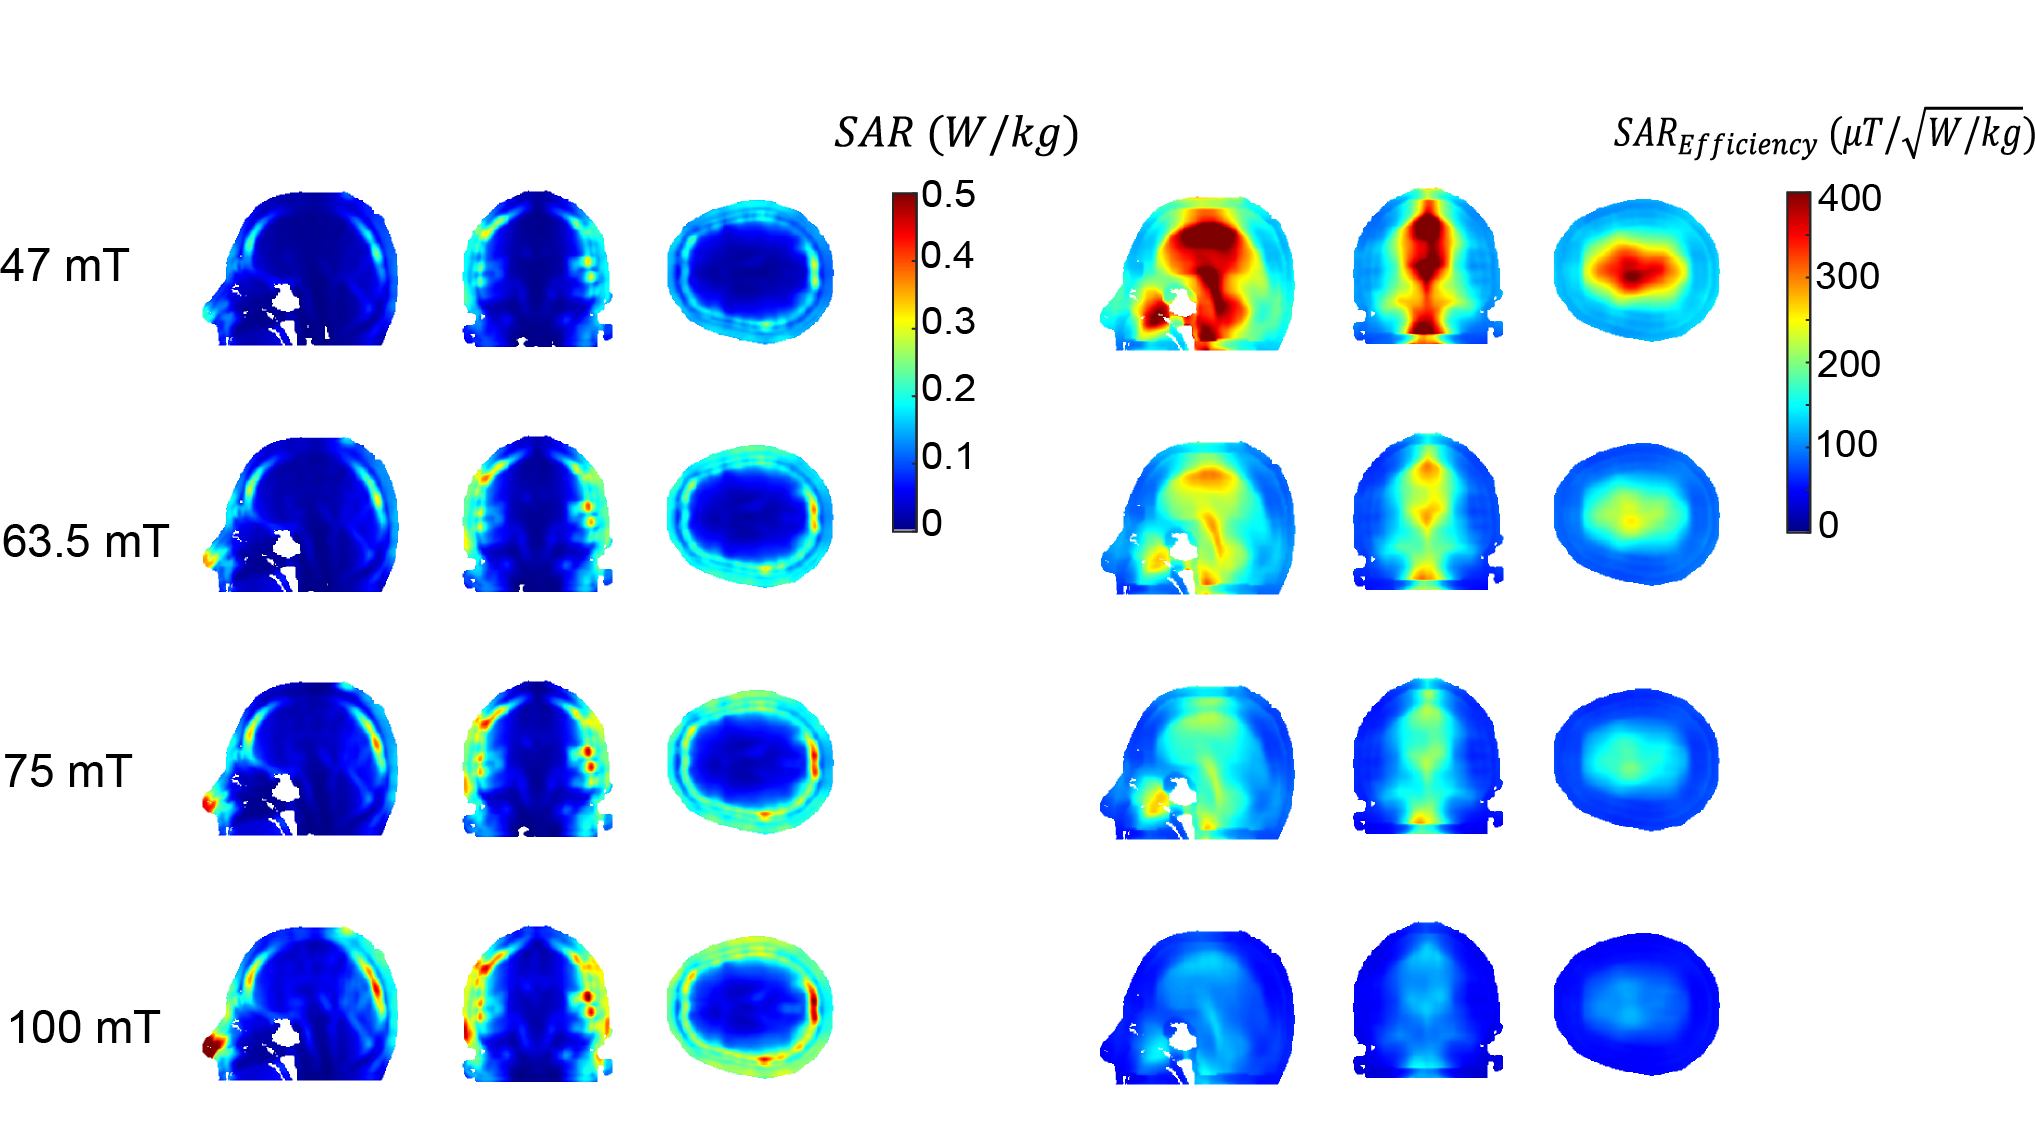
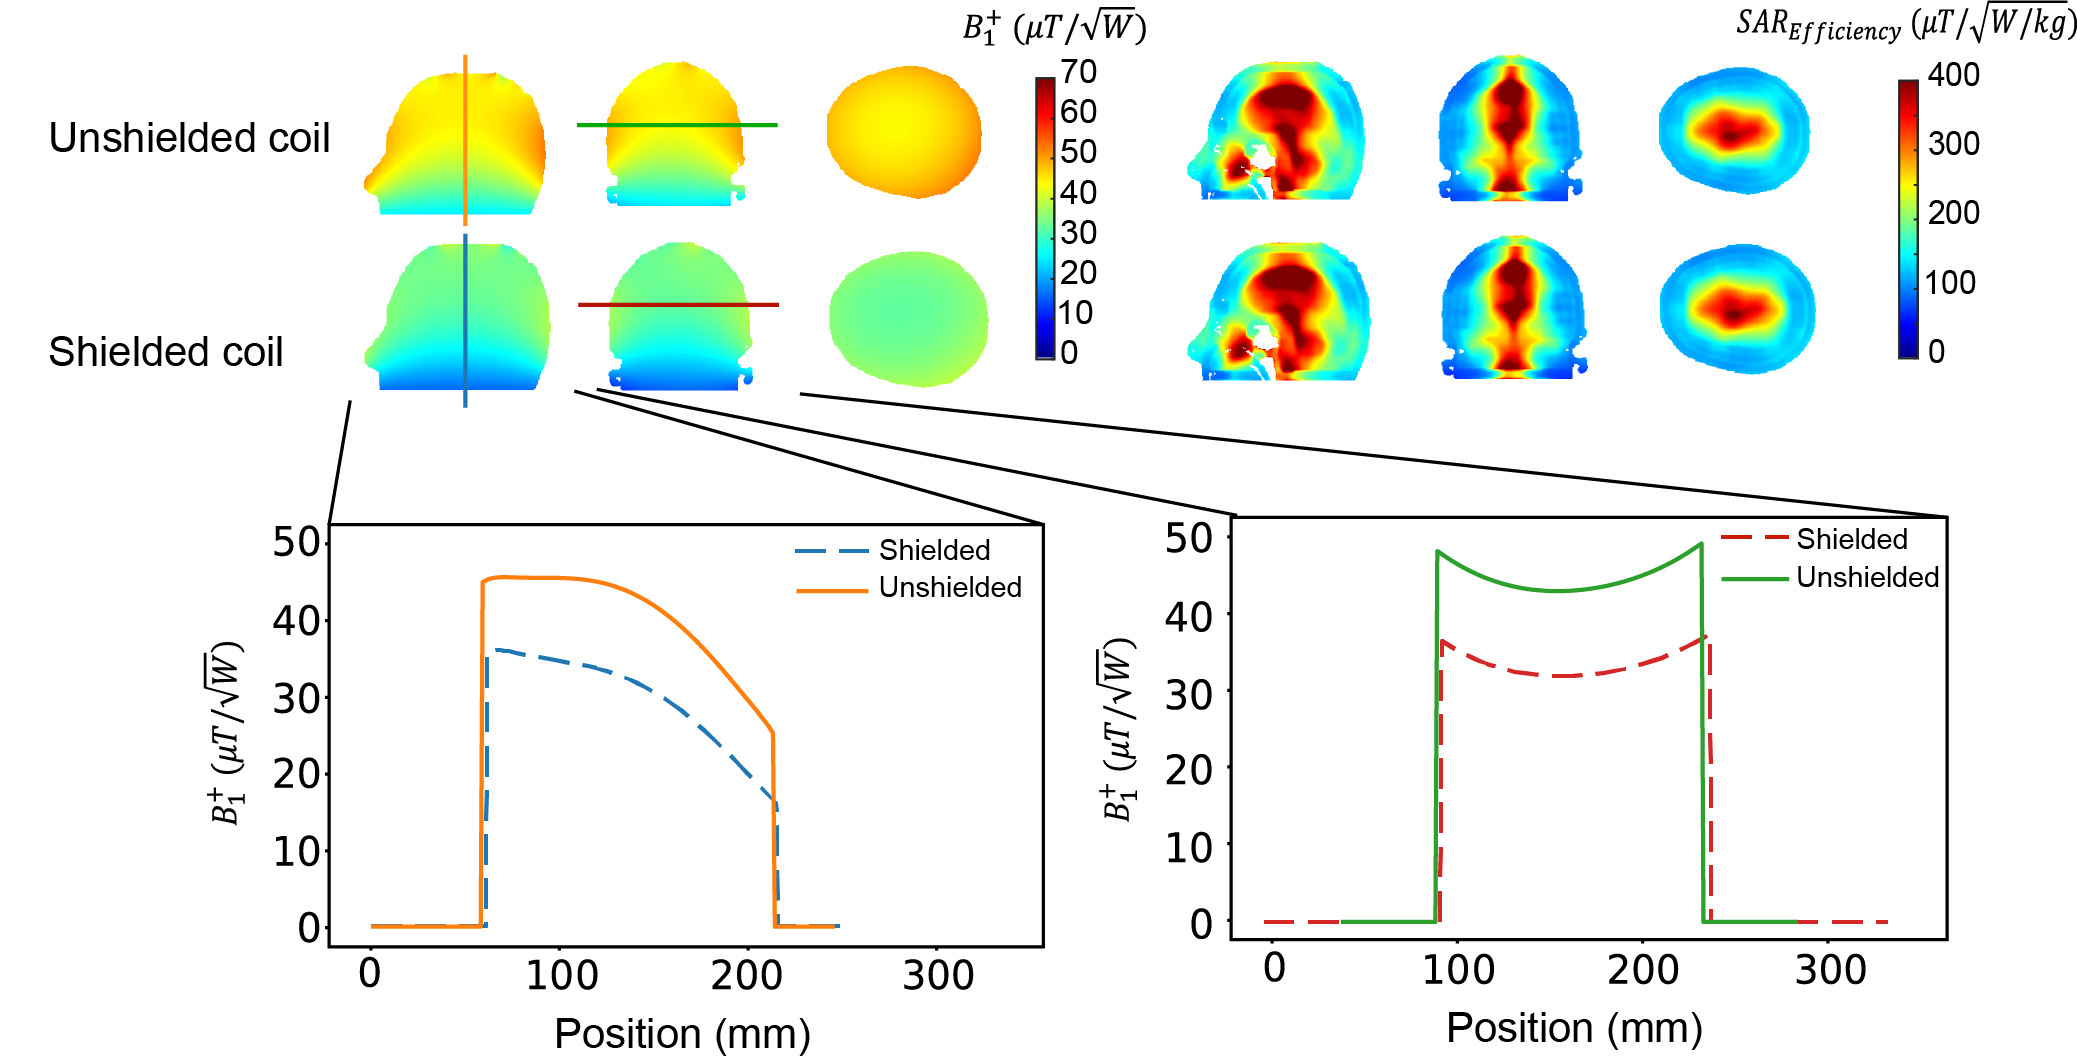
Figure 2 shows the simulated B1+ efficiency ($$$\mu T/\sqrt{W}$$$) and electric field for 1 W input power ($$$V/m\sqrt{W}$$$) for the four different field strengths. The transmit efficiency drops as a function of frequency and the electric field increases with frequency. Figure 3 shows the measured and simulated B1+ map in three dimensions at 2MHz with a reasonable agreement between experimental and simulation data. Simulated SAR10g and SAR10g efficiencies at the four different frequencies are shown in Figure 4. The effect of the shield on B1+ efficiency SAR efficiency is shown in Figure 5, with approximately a 25% reduction. However, there are negligible changes in the SAR efficiency.Discussion and Conclusion
This work presents an overview of the transmit and SAR efficiencies for an RF coil used for POC MRI neuroimaging. Simulations of RF coil characteristics and B1+ transmit efficiencies agreed well with corresponding experimentally determined parameters. Overall, the SAR efficiency was, as expected, higher at lower frequencies, and many orders of magnitude greater than at conventional clinical field strengths. The tight-fitting transmit coil results in the highest SAR in the nose and skull, which are not thermally sensitive tissues. While SAR is not a problem for conventional sequences, the values derived here should be useful for RF intensive sequences such as T1ρ or sequences which use very short, high power pulses.Acknowledgements
This work was funded by H2020-MSCA-ITN-ETN-2019 (NOVA-MRI 859908) and a Horizon 2020 ERC Advanced Grant (670629).References
1. Sarracanie M, Salameh N Low-Field MRI: How Low Can We Go? A Fresh View on an Old Debate. Front Phys-Lausanne 8,2020.
2. Wald LL, McDaniel PC, Witzel T, Stockmann JP, Cooley CZ Low-cost and portable MRI. J Magn Reson Imaging doi:10.1002/jmri.26942,2019.
3. Beekman R, Crawford A, Mazurek MH, Prabhat AM, Chavva IR, Parasuram N, Kim N, Kim JA, Petersen N, de Havenon A, Khosla A, Honiden S, Miller PE, Wira C, Daley J, Payabvash S, Greer DM, Gilmore EJ, Kimberly WT, Sheth KN Bedside monitoring of hypoxic ischemic brain injury using low-field, portable brain magnetic resonance imaging after cardiac arrest. Resuscitation 176:150-158,2022.
4. Mazurek MH, Cahn BA, Yuen MM, Prabhat AM, Chavva IR, Shah JT, Crawford AL, Welch EB, Rothberg J, Sacolick L, Poole M, Wira C, Matouk CC, Ward A, Timario N, Leasure A, Beekman R, Peng TJ, Witsch J, Antonios JP, Falcone GJ, Gobeske KT, Petersen N, Schindler J, Sansing L, Gilmore EJ, Hwang DY, Kim JA, Malhotra A, Sze G, Rosen MS, Kimberly WT, Sheth KN Portable, bedside, low-field magnetic resonance imaging for evaluation of intracerebral hemorrhage. Nat Commun 12,2021.
5. Mazurek MH, Yuen MM, Cahn BA, Rosen MS, Gobeske KT, Gilmore EJ, Hwang D, Kaddouh F, Kim JA, Falcone G, Petersen N, Siner J, Spudich S, Sze G, Kimberly WT, Sheth KN Low-Field, Portable Magnetic Resonance Imaging at the Bedside to Assess Brain Injury in Patients with Severe COVID-19. Neurology 96 (15),2021.
6. Sheth KN, Mazurek MH, Yuen MM, Cahn BA, Shah JT, Ward A, Kim JA, Gilmore EJ, Falcone GJ, Petersen N, Gobeske KT, Kaddouh F, Hwang DY, Schindler J, Sansing L, Matouk C, Rothberg J, Sze G, Siner J, Rosen MS, Spudich S, Kimberly WT Assessment of Brain Injury Using Portable, Low-Field Magnetic Resonance Imaging at the Bedside of Critically Ill Patients. Jama Neurol 78 (1):41-47,2021.
7. Cooley CZ, McDaniel PC, Stockmann JP, Srinivas SA, Cauley SF, Sliwiak M, Sappo CR, Vaughn CF, Guerin B, Rosen MS, Lev MH, Wald LL A portable scanner for magnetic resonance imaging of the brain. Nat Biomed Eng 5 (3):229-239,2021.
8. de Vos B, Parsa J, Abdulrazaq Z, Teeuwisse WM, Van Speybroeck CDE, de Gans DH, Remis RF, O'Reilly T, Webb AG Design, Characterisation and Performance of an Improved Portable and Sustainable Low-Field MRI System. Front Phys-Lausanne 9,2021.
9. O'Reilly T, Teeuwisse WM, de Gans D, Koolstra K, Webb AG In vivo 3D brain and extremity MRI at 50 mT using a permanent magnet Halbach array. Magn Reson Med 85 (1):495-505,2021.
10. Van Speybroeck CDE, O'Reilly T, Teeuwisse W, Arnold PM, Webb AG Characterization of displacement forces and image artifacts in the presence of passive medical implants in low-field (<100 mT) permanent magnet-based MRI systems, and comparisons with clinical MRI systems. Phys Med 84:116-124,2021.
11. Guallart-Naval T, Algarin JM, Pellicer-Guridi R, Galve F, Vives-Gilabert Y, Bosch R, Pallas E, Gonzalez JM, Rigla JP, Martinez P, Lloris FJ, Borreguero J, Marcos-Perucho A, Negnevitsky V, Marti-Bonmati L, Rios A, Benlloch JM, Alonso J Portable magnetic resonance imaging of patients indoors, outdoors and at home. Sci Rep-Uk 12 (1),2022.
12. Hayden ME, Bidinosti CP, Chapple EM Specific absorption rates and signal-to-noise ratio limitations for MRI in very-low magnetic fields. Concept Magn Reson A 40a (6):281-294,2012.
13. O'Reilly T, Teeuwisse WM, de Gans D, Koolstra K, Webb AG In vivo 3D brain and extremity MRI at 50 mT using a permanent magnet Halbach array. Magn Reson Med, doi:10.1002/mrm.28396 ,2020.
14. Hayden ME, Hardy WN Technique for measuring magnetic filling factors with applications to cryogenic magnetic resonance experiments. Rev Sci Instrum 67 (5):1905-1911, 1996.
15. Bottomley PA, Edelstein WA Power Deposition in Whole-Body Nmr Imaging. Med Phys 8 (4):510-512,1981.
16. Stollberger R, Wach P Imaging of the active B1 field in vivo. Magn Reson Med 35 (2):246-251, 1996.
Figures