2685
Application of Diffusion MRI to Characterize Connectome Changes Associated with EED Ablation1Centre for Advanced Imaging, The University of Queensland, Brisbane, Australia, 2The School of Biomedical Sciences, The University of Queensland, Brisbane, Australia
Synopsis
Keywords: Brain Connectivity, Genetic Diseases, Tractography, Connectome, EED, Neurodevelopment, MRI, HARDI
Mutation in embryonic ectoderm development (EED) gene in mice have been shown to exhibit microcephaly at birth, however, the adult phenotype is unknown. This study investigates brain connectivity changes arising from EED ablation in adult mice using high angular resolution diffusion imaging. Three groups of adult mice (homozygotes, heterozygotes, controls) were scanned using 16.4 T to acquire diffusion data. Data was then used to compute iFOD2 maps, probabilistic whole brain tractograms, and the connectomes. Connectomic were compared both connectivity- and network-wise. Homozygotes had abnormal connectivity and network metrics suggesting brain under-development, highlighting the importance of EED’s role in brain development.
Introduction
Embryonic ectoderm development (EED) is one of the core components of PRC2 1,2. EED is believed to have a regulatory role in neurogenesis and intelligence-associated brain development 3,4. Pei-Pei et al reported EED’s potential role in preserving neural stem cells at postnatal periods, as well as its functionality throughout the entire neurogenesis 5. The ablation of EED gene appeared to shift postnatal neural stem/progenitor cells (NSPC) toward oligodendrogenesis, affected long-term neuronal differentiation in the hippocampus, and forebrain development resulting in forebrain microcephaly 5. This study aims to investigate and characterize brain connectivity changes in EED-Emx1-iCre adult mouse model of microcephalic forebrain compared to wild type, using our previously optimized pipeline of magnetic resonance diffusion data acquisition and processing (ISMRM 2023, abstract #4859).Methods
Animal Preparation
24 samples (8 controls, 8 heterozygotes, and 8 homozygotes) of adult C57BL6/J mice were used in this study. Animals were perfused using phosphate buffered solution (PBS; BioWhittaker, USA) then fixated using 4% paraformaldehyde (PFA) (pH 7.4; Sigma Aldrich, USA). Skulls were collected then further post-fixed in 4% PFA for 24 hours then immersed in 0.1 M PBS with 0.2% gadobutrol (Gadovist, Bayer, Ontario, Canada) to enhance MRI contrast. Brain data were acquired using the 16.4 T Bruker Ultrashield Plus 700 WB spectrometer equipped with a 15 mm linear surface acoustic wave coil and a Micro 2.5 gradient (Gmax 1.5 T/m) and running Paravision 6.0.1.Diffusion MRI Data Acquisition
Two sets of scans were obtained: a high-resolution 3D T1 weighted Fast Low Angle Shot at 30 μm Isotropic resolution for structural information imaging; and 3D Stejskal-Tanner DWI spin-echo in 30 directions. DWI data was obtained using the following parameters: repetition time = 400 ms, echo time = 21 ms, 100 μm Isotropic resolution, and b value of 5000 s/mm2 with three b=0 images. A zero-filling factor of 1.5 was used during Fourier Transform of the DWI data to improve the digital resolution and fiber tracking process 6.Data Pre-processing and Analysis
MRtrix3 was used to denoise the data, calculate the response function, compute iFOD2 map and perform fibretracking 7. To construct the structural connectome, A 106 regions of interest atlas of adult C57BL/6 mouse was used to define the nodes in the connectome 8. The atlas was registered to each subject’s b0 image using FMRIB’s Linear Image Registration Tools (FLIRT) rigid-body registration, followed by affine and nonlinear deformation using ANTs 9-11. The edges between these nodes were then computed using MRtrix3 7.Structural Connectome Analysis and VBM Analyses
The connectome was studied network-wise by graph theory analysis and connection-wise using the Network-Based Statistic Toolbox (NBS) 12,13. For NBS, connectomes were compared over multi-thresholds ranging between t = 2.1 to t = 6.5 with an increment of 0.1 each time to compute the FWER-corrected p-value for each component. For graph theory analysis, network metrics were measured over 10 thresholds ranging between t = 0.05 to t = 0.5 of the network sparsity. These metrics include degree centrality, betweenness, small worldness, and modularity.To detect brain structures most significantly affected by EED ablation, Diffusion Tensor Imaging derived maps were computed using MRtrix3 7, and Voxel-based morphometry (VBM) analysis was performed using Threshold-Free Cluster Enhancement (TFCE) with controlled family-wise error (FWE) rate 14.
Results
Connection-wise, no significant change has been detected between the controls and heterozygotes groups. However, several nodes in the homozygotes group showed significantly less connectivity compared to both controls and heterozygotes. Some nodes were affected severely by EED-ablation (higher degree of change) while others were only moderately affected (Fig 2).Network-wise, no significant change was seen between controls and heterozygotes. Homozygotes had significantly decreased degree (p < 0.05, corrected) compared to controls. However, small-worldness and betweenness metrics were significantly increased (p < 0.05, corrected). In terms of modularity on the other hand, no significant change was detected between the three groups.
Compared to controls and heterozygotes, VBM analysis revealed distinct significant reduction of fractional anisotropy (FA) (FWE-corrected, p < 0.05) in part of the dentate gyrus in homozygotes. A less stringent statistical analyses using uncorrected TFCE with p <0.01 showed reductions of FA in parts of the dentate gyrus, external capsules, entorhinal cortex, primary somatosensory cortex, retrosplenial area, and superior colliculus (Fig 4).
Discussion
NSB and graph theory analysis revealed reduced connectivity in homozygotes (Fig 2). Also, homozygotes had significantly longer path length and higher clustering coefficient representing a more regular network compared to controls. Higher intellectual performance is correlated with shorter path length 15-17. These findings suggest under-development of brain structure and function 18. Moreover, homozygotes had significantly increased betweenness indicating higher nodal influence on information transfer across the network 19,20. These findings are consistent with EED phenotype reported in the literature. Pei-Pei et al confirmed the expression of EED in NSPC in cortex, hippocampus, and DG indicating its potential role in preserving neural stem cells at postnatal periods and the possibility of its continual functionality throughout the entire neurogenesis process 21.Conclusion
EED ablation leads to abnormal brain development resulting in reduced nodal connectivity and under-developed brain network. Our pipeline can reliably detect changes in connectivity and network metrics resulting from EED ablation. This makes it a suitable tool to investigate connectomic changes associated with neurodevelopmental disorders.Acknowledgements
We acknowledge the supports from the Queensland NMR Network and the National Imaging Facility (a National Collaborative Research Infrastructure Strategy capability) for the operation of 16.4T MRI at the Centre for Advanced Imaging, the University of Queensland. MA would like to acknowledge Jordan University of Science and Technology for PhD scholarship.
References
1. Pereira JD, Sansom SN, Smith J, Dobenecker M-W, Tarakhovsky A, Livesey FJ. Ezh2, the histone methyltransferase of PRC2, regulates the balance between self-renewal and differentiation in the cerebral cortex. Proceedings of the National Academy of Sciences. 2010;107(36):15957-15962.
2. von Schimmelmann M, Feinberg PA, Sullivan JM, et al. Polycomb repressive complex 2 (PRC2) silences genes responsible for neurodegeneration. Nature neuroscience. 2016;19(10):1321-1330.
3. Imagawa E, Higashimoto K, Sakai Y, et al. Mutations in genes encoding polycomb repressive complex 2 subunits cause Weaver syndrome. Human mutation. 2017;38(6):637-648.
4. Zhang J, Ji F, Liu Y, et al. Ezh2 regulates adult hippocampal neurogenesis and memory. Journal of Neuroscience. 2014;34(15):5184-5199.
5. Liu PP, Xu YJ, Dai SK, et al. Polycomb Protein EED Regulates Neuronal Differentiation through Targeting SOX11 in Hippocampal Dentate Gyrus. Stem Cell Reports. 2019;13(1):115-131.
6. Alomair OI, Brereton IM, Smith MT, Galloway GJ, Kurniawan ND. In vivo high angular resolution diffusion-weighted imaging of mouse brain at 16.4 Tesla. PloS one. 2015;10(6):e0130133.
7. Tournier J-D, Smith R, Raffelt D, et al. MRtrix3: A fast, flexible and open software framework for medical image processing and visualisation. NeuroImage. 2019;202:116137.
8. Liu C, Li Y, Edwards TJ, Kurniawan ND, Richards LJ, Jiang T. Altered structural connectome in adolescent socially isolated mice. Neuroimage. 2016;139:259-270.
9. Jenkinson M, Smith S. A global optimisation method for robust affine registration of brain images. Medical image analysis. 2001;5(2):143-156.
10. Jenkinson M, Bannister P, Brady M, Smith S. Improved optimization for the robust and accurate linear registration and motion correction of brain images. Neuroimage. 2002;17(2):825-841.
11. Avants BB, Tustison N. Advanced normalization tools (ANTS).
12. Wang J, Wang X, Xia M, Liao X, Evans A, He Y. GRETNA: a graph theoretical network analysis toolbox for imaging connectomics. Frontiers in human neuroscience. 2015;9:386.
13. Zalesky A, Fornito A, Bullmore ET. Network-based statistic: identifying differences in brain networks. Neuroimage. 2010;53(4):1197-1207.
14. Winkler AM, Ridgway GR, Webster MA, Smith SM, Nichols TE. Permutation inference for the general linear model. NeuroImage. 2014;92:381-397.
15. Langer N, Pedroni A, Gianotti LR, Hänggi J, Knoch D, Jäncke L. Functional brain network efficiency predicts intelligence. Human brain mapping. 2012;33(6):1393-1406.
16. Li Y, Liu Y, Li J, et al. Brain anatomical network and intelligence. PLoS computational biology. 2009;5(5):e1000395.
17. Van Den Heuvel MP, Stam CJ, Kahn RS, Pol HEH. Efficiency of functional brain networks and intellectual performance. Journal of Neuroscience. 2009;29(23):7619-7624.
18. Cao M, Shu N, Cao Q, Wang Y, He Y. Imaging functional and structural brain connectomics in attention-deficit/hyperactivity disorder. Molecular neurobiology. 2014;50(3):1111-1123.
19. Barthelemy M. Betweenness centrality in large complex networks. The European physical journal B. 2004;38(2):163-168.
20. Freeman LC. A set of measures of centrality based on betweenness. Sociometry. 1977:35-41.
21. Liu P-P, Xu Y-J, Dai S-K, et al. Polycomb protein EED regulates neuronal differentiation through targeting SOX11 in hippocampal dentate gyrus. Stem cell reports. 2019;13(1):115-131.
22. Liao X, Vasilakos AV, He Y. Small-world human brain networks: Perspectives and challenges. Neuroscience & Biobehavioral Reviews. 2017;77:286-300.
Figures
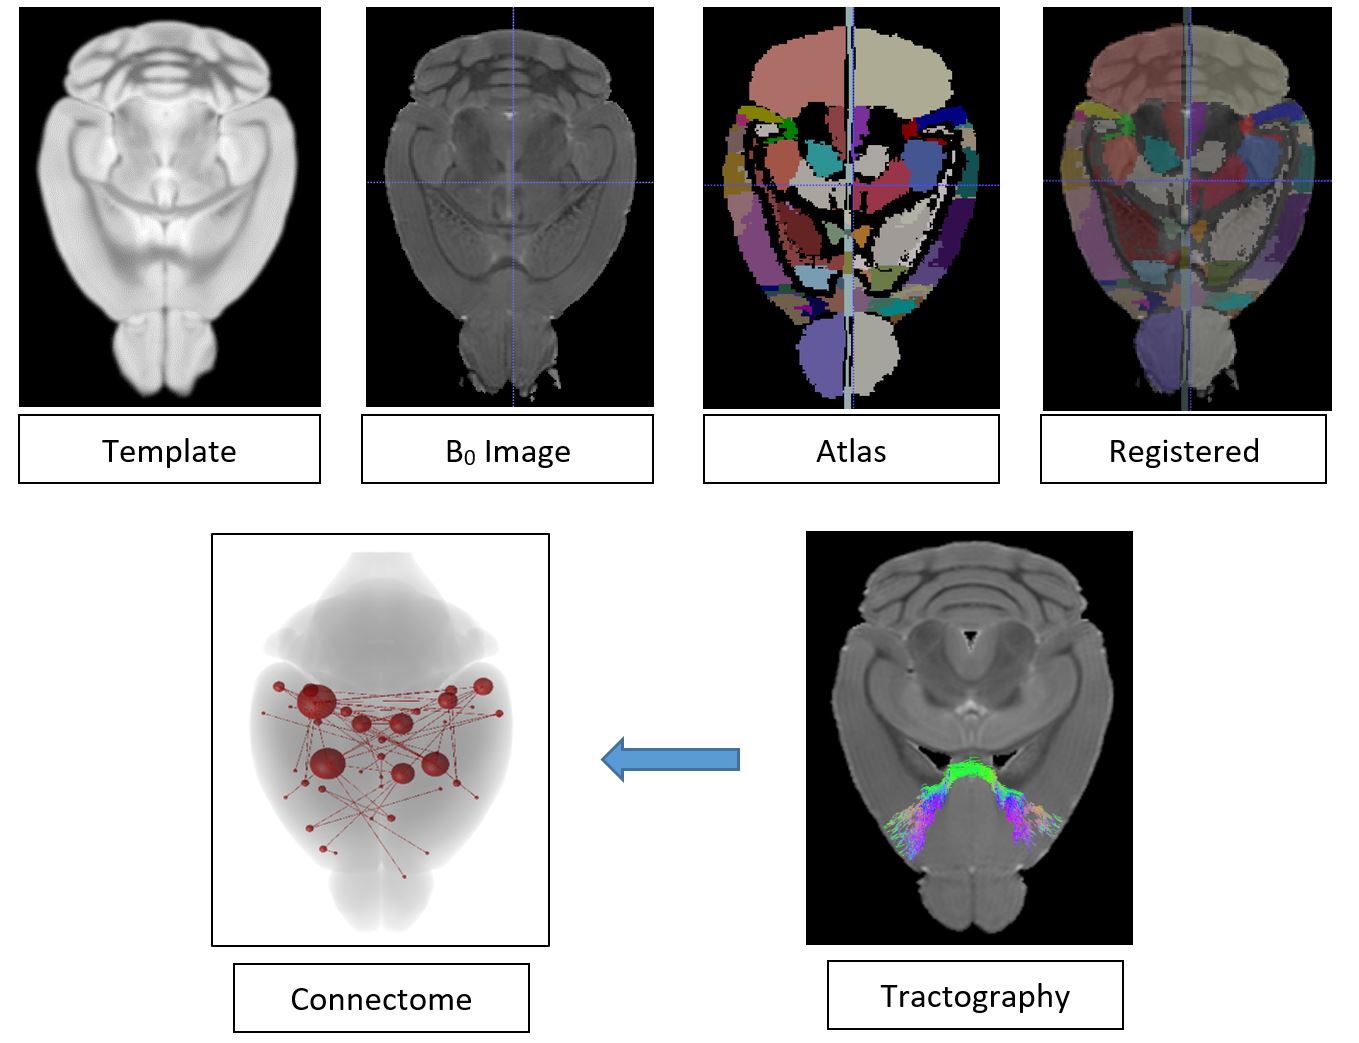
Fig 1: Processing pipeline. Both mouse brain template and atlas images were transformed into the subject space using the subject b=0 image. Subsequently whole brain probabilistic tractography were performed and processed to generate structural connectome.
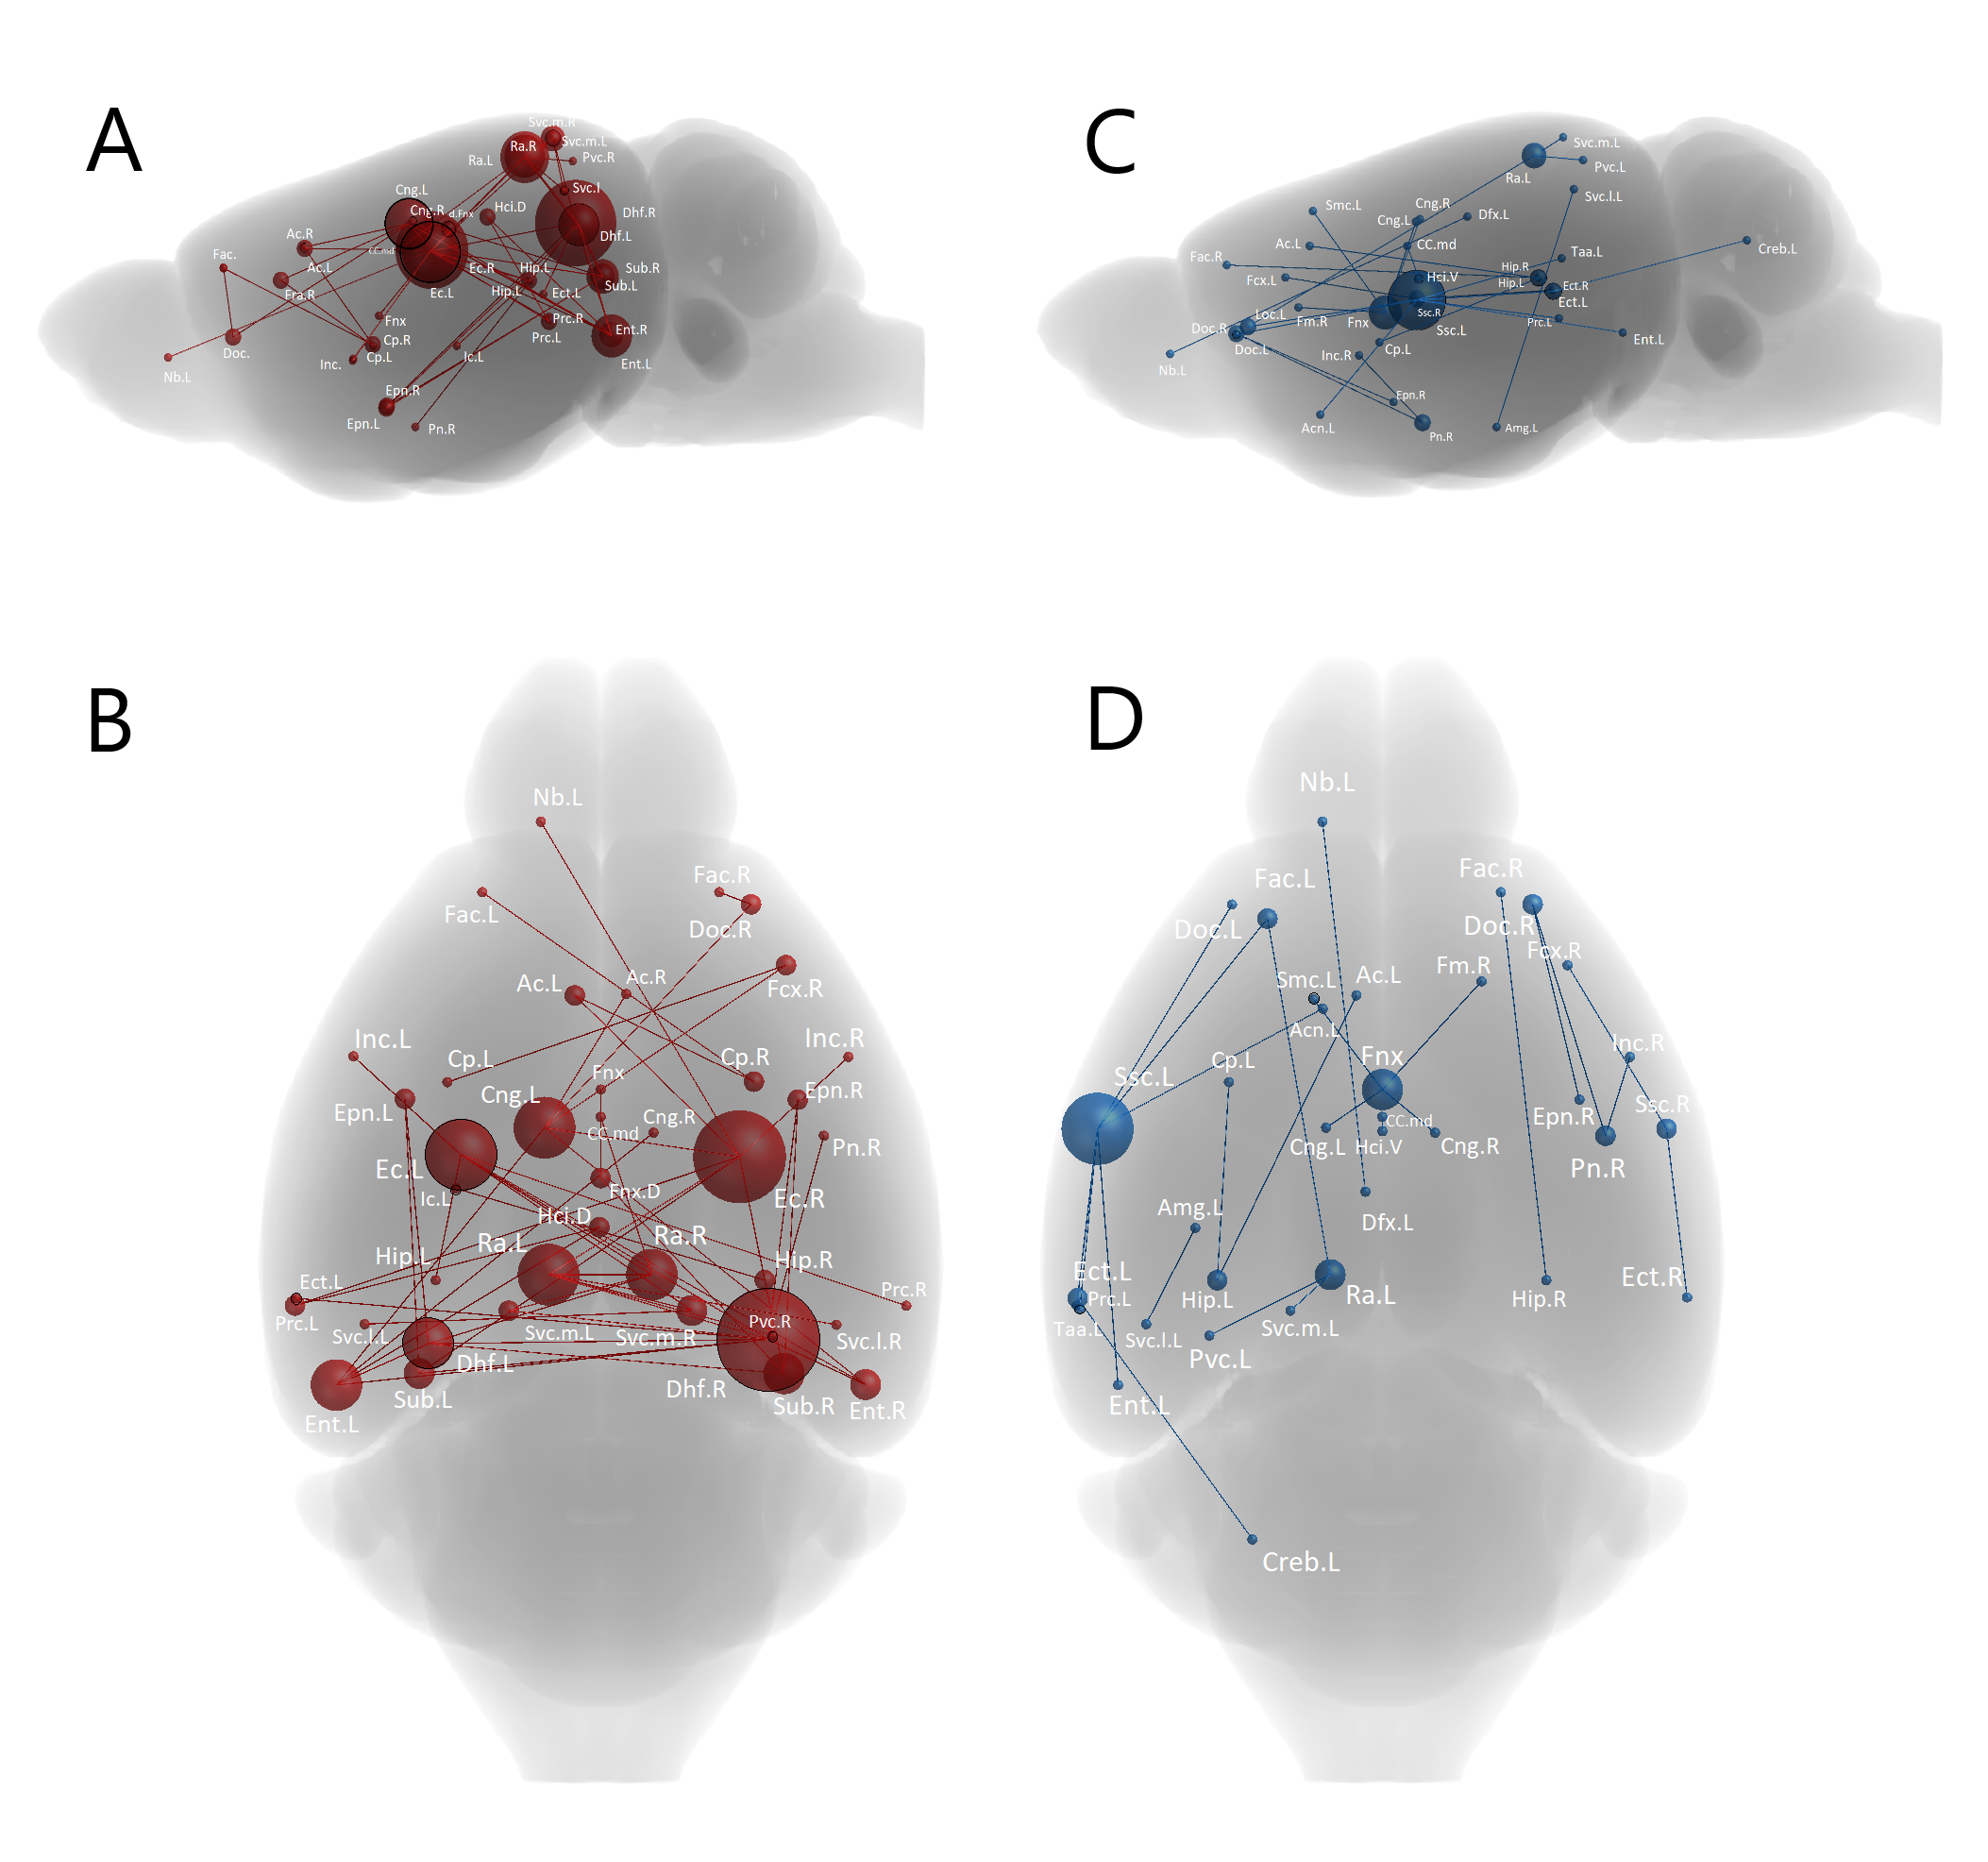
Fig 2: NBS analysis showing abnormal inter-nodal connectivity in the homozygotes compared to controls. The analysis was performed under primary threshold (t=3.8) as it showed the highest significance level (p < 0.005). The nodes’ size is scaled to the degree of change in their connectivity (range = 0 – 15). Nodes with significantly decreased connectivity are depicted in red (A and B) while those with significantly increased (C and D) are in blue. Dorsal hippocampal fissure (Dhf) and entorhinal (Ent), ectorhinal (Ect), and left somatosensory (Ssc.L) cortices had high degree of change.
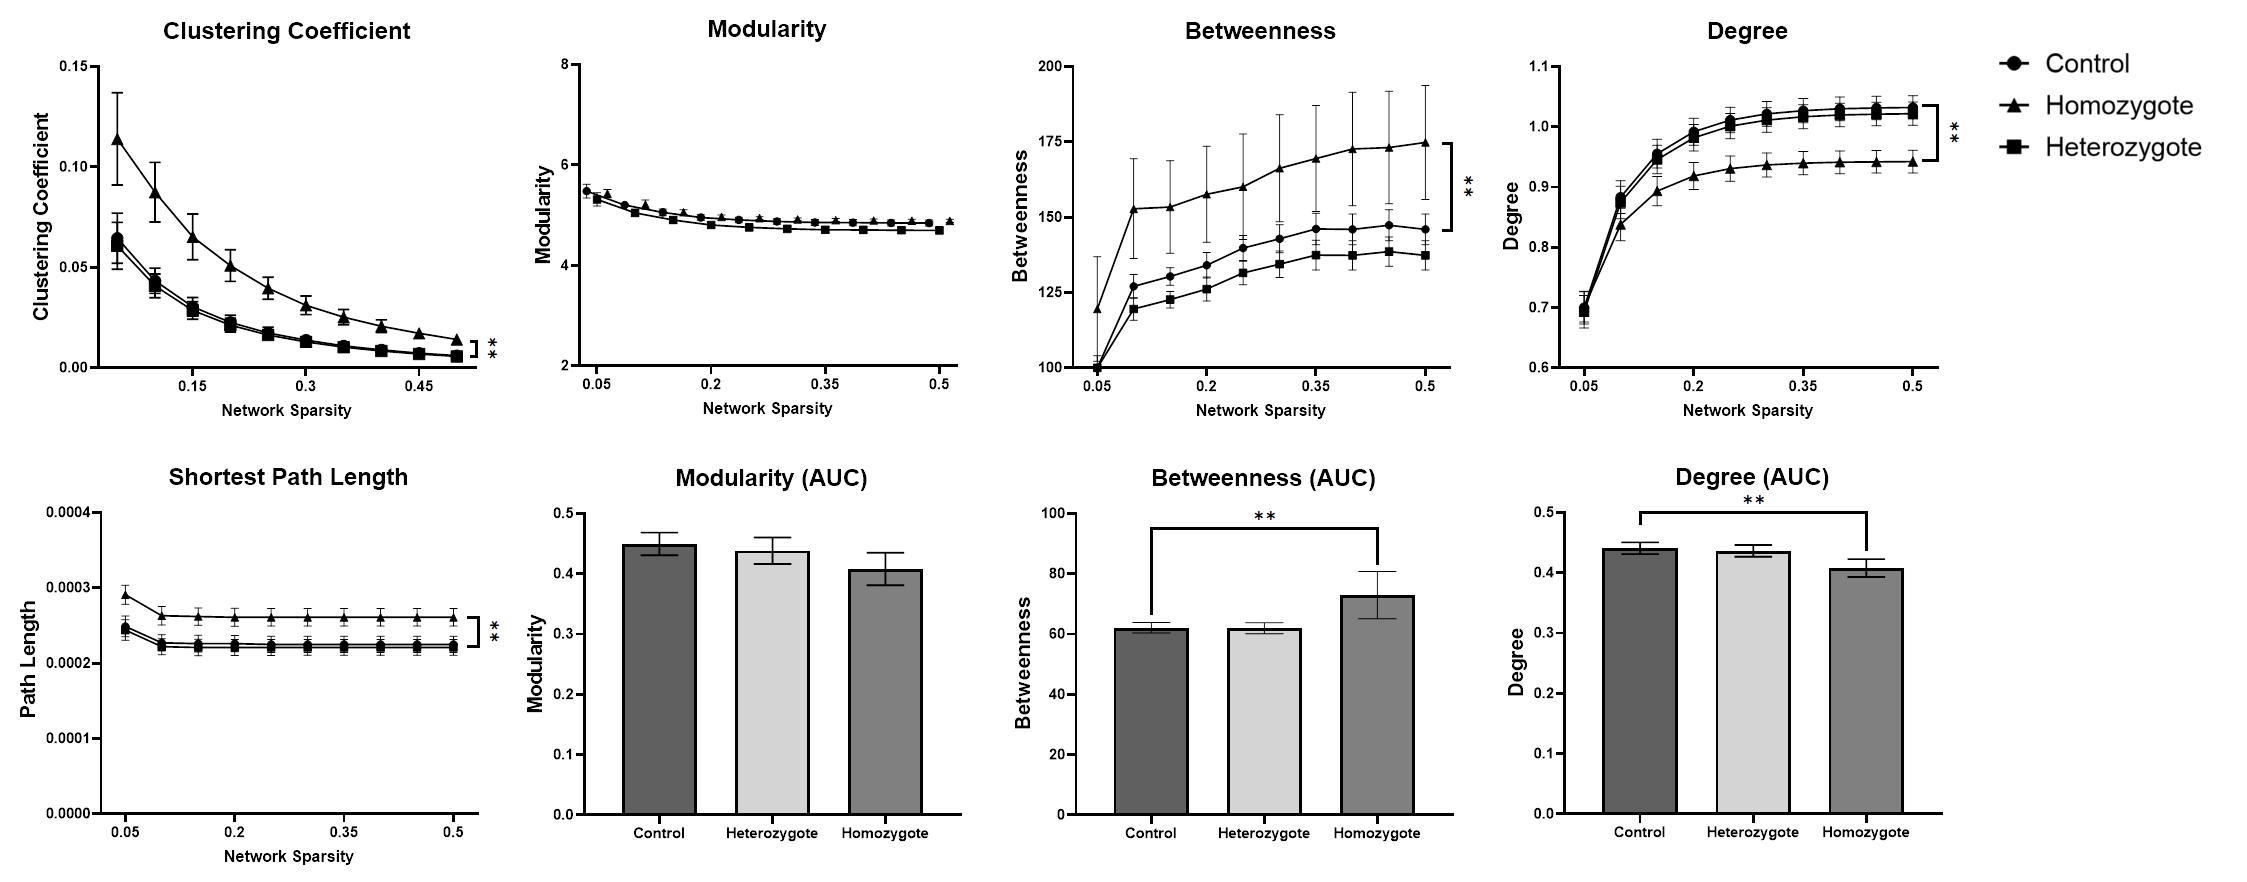
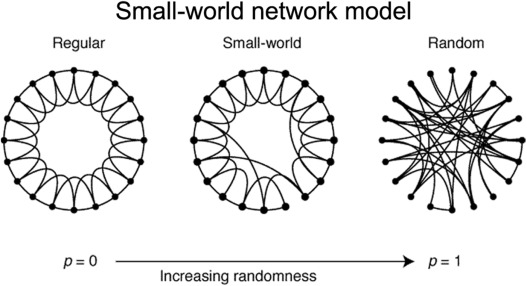
Fig 3: Graph theory analysis revealing abnormal network metrics in homozygotes. Homozygotes connectome shows reduced degree but increased betweenness and more regularity in terms of small-worldness. Asterisks (*) indicates that p < 0.05.
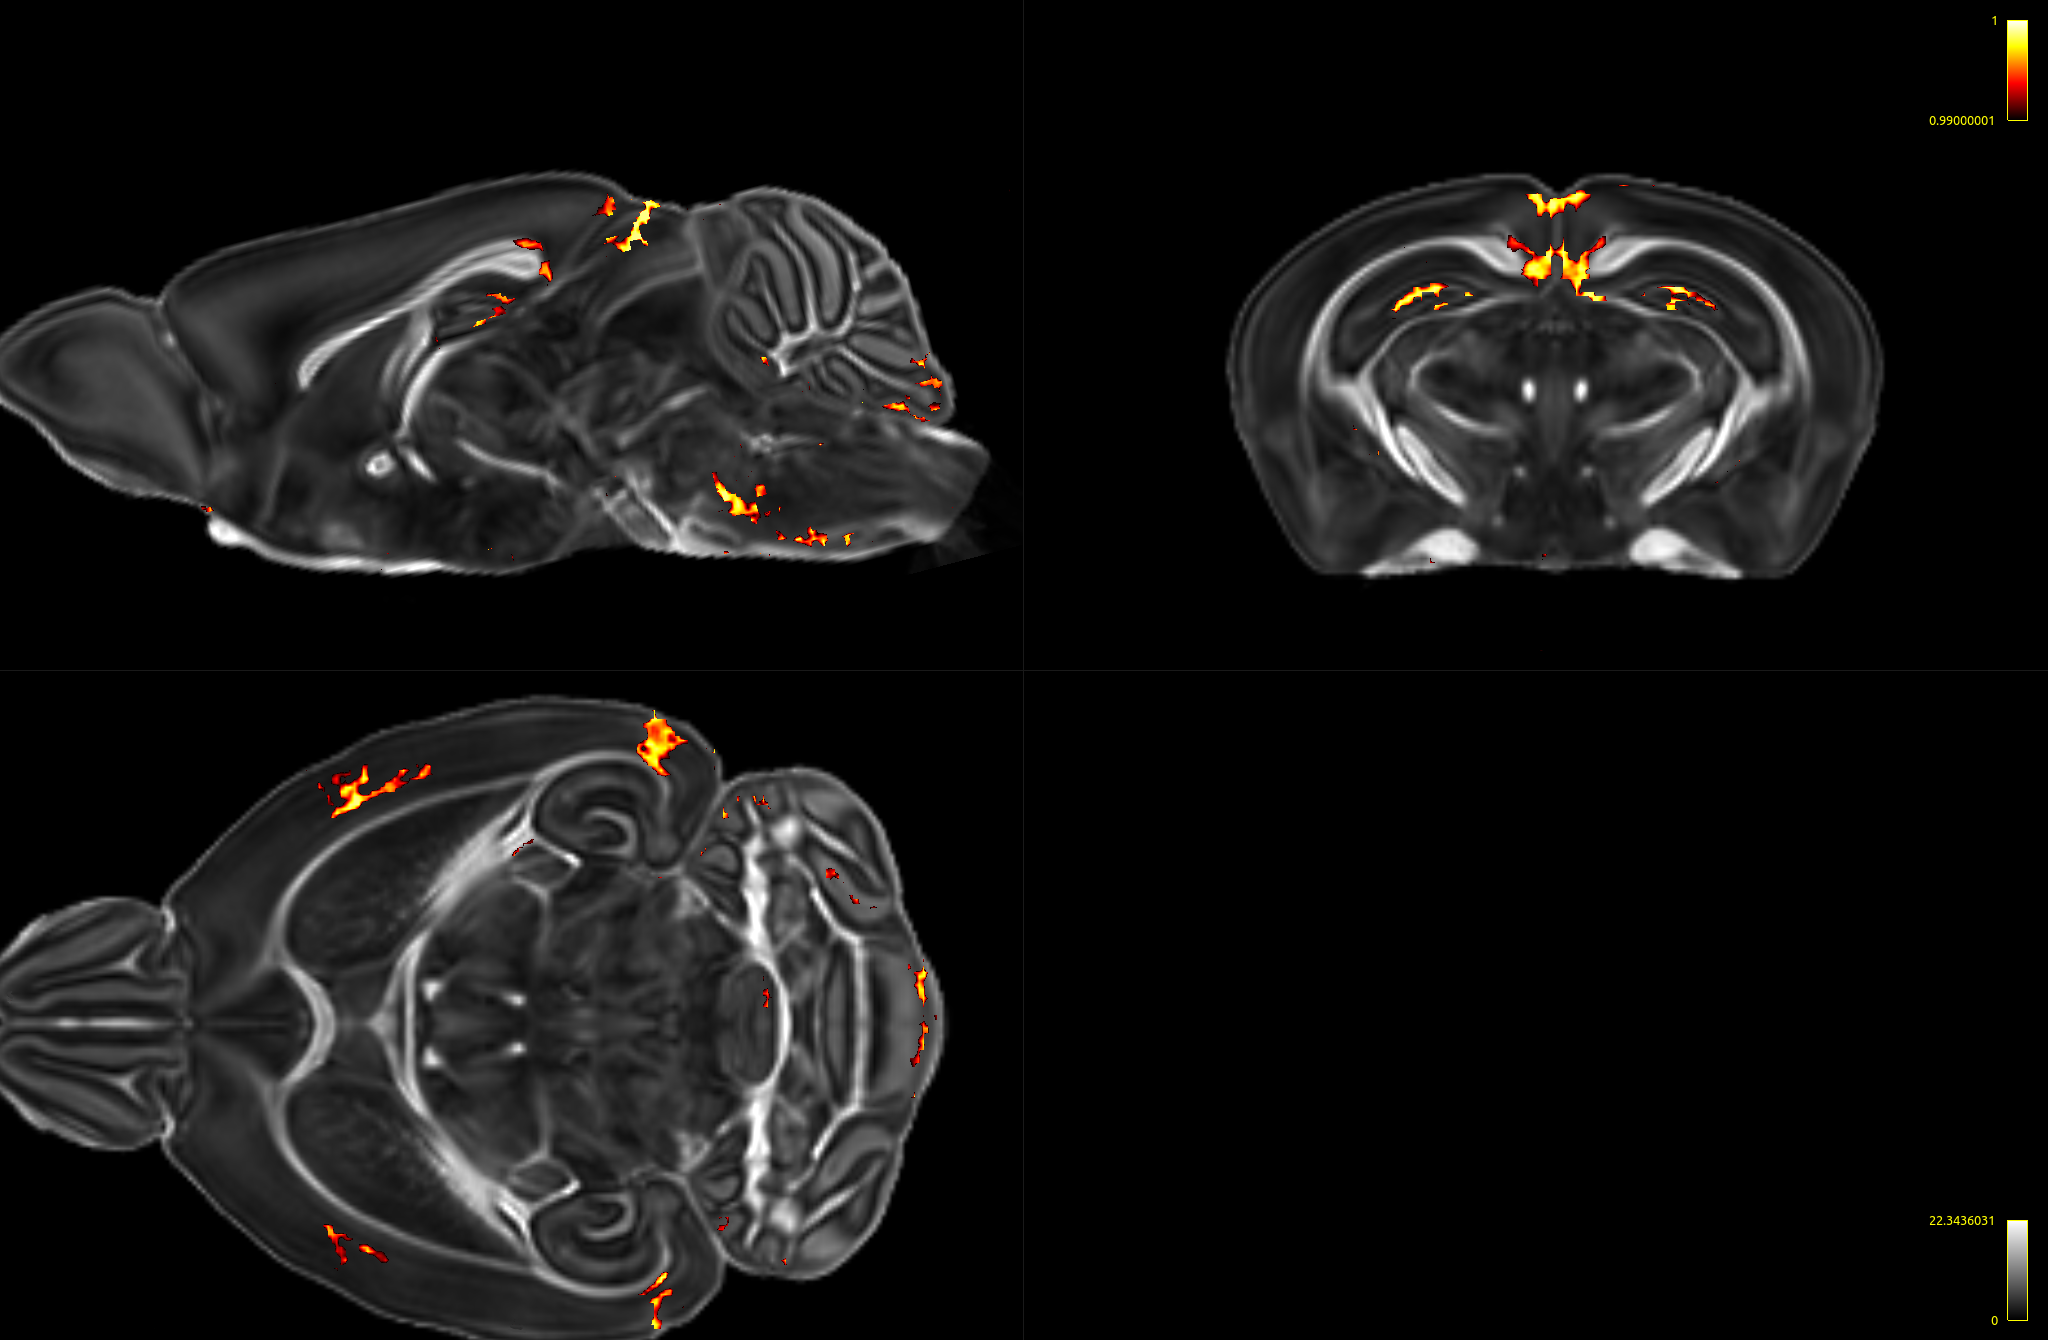
Fig 4: FA map overlaid with the 1-p map showing areas with significant decrease (p < 0.01) in FA in the homozygotes compared to controls.