2682
DTI reveals altered structural connectivity of pain-associated regions in a genetic variant of small fiber neuropathy1Department of Radiology & Nuclear Medicine, School for Mental Health and Neuroscience, Maastricht University Medical Center, Maastricht, Netherlands, 2Department of Neurology, Maastricht University Medical Center, Maastricht, Netherlands, 3Boston Children's Hospital, Boston, MA, United States, 4School for Mental Health & Neuroscience, Maastricht University Medical Center, Maastricht, Netherlands
Synopsis
Keywords: Brain Connectivity, Diffusion Tensor Imaging, Chornic pain
Patients with small fiber neuropathy (SFN) suffer from chronic pain, which may lead to cerebral changes. Here, we studied structural network changes in idiopathic- and genetic-SFN compared to controls using diffusion-MRI. We found that for the genetic-SFN group pain-associated regions take a more prominent place in the network (in terms of nodal importance). Furthermore, in the genetic-SFN group, a higher nodal importance of pain-associated regions related to lower self-reported pain. This shows that genetic-SFN has a distinct structural pain pathway, which may be indicative of a compensatory mechanism where the structural organization is altered to inhibit the response to pain.Introduction
Small fiber neuropathy (SFN) is a neuropathic disorder associated with chronic pain [1]. Around 5% of SFN patients harbour a mutation in SCN9A, the gene encoding for voltage-gated sodium channel Nav1.7, which is essential in generating and conducting action potentials in the physiological pain pathway [2]. While previous neuroimaging studies have already revealed that chronic pain may lead to morphological and structural changes in the brain [3],[4], it is still unclear whether the SCN9A mutation may lead to specific cerebral pain patterns. Therefore, in this study, we will investigate the structural brain network using diffusion tensor imaging (DTI) in terms of nodal importance of pain-associated regions in patients with iSFN and SCN9A-SFN as well as healthy controls (HC).Methods
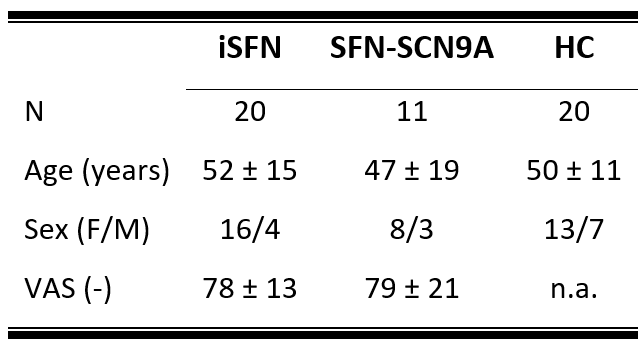
Study populationThree diagnostic subject groups comprising eleven SFN-SCN9A patients, twenty iSFN patients, and twenty HCs were included (table 1).
MRI acquisition
All subjects underwent 3T-MRI (Philips Achieva, Best, the Netherlands) using a 32-element phased-array coil. For anatomical reference, 3D T1-weighted images (TR/TE=9.7/4ms;flip angle=12°;matrix=256x256; voxel size=1mm3) were acquired. Next, a diffusion-weighted scan (70 transverse 2-mm thick slices; matrix=112x112;pixel size=2x2mm;TR/TE=8068/75ms, 66 gradient directions with b-value=1200s/mm2 and one b-value=0s/mm2 image) was acquired. Besides MRI, for the SFN patients, a measure of maximum self-reported pain was also collected using a visual analog scale (VAS) score.
Preprocessing
The structural images were automatically parcellated into 68 cortical and 16 sub-cortical regions using Freesurfer based on the Desikan-Killiany atlas [5]. The diffusion-weighted images were corrected for subject motion and eddy currents, and non-linearly registered to the undistorted and T1w image using ExploreDTI [6]. Whole brain tractography was performed using constrained spherical deconvolution.
Graph Analysis
The 84 Freesurfer-derived regions were used as nodes in the network, and two nodes were considered connected if they have at least 2 streamlines between them. Moreover, only the nodes, and edges present in the network of at least half of the subjects are considered in the graph analysis (i.e., group thresholding) [7]. The number of edges in each network is varied such that they are 71-90% sparse, with intervals of 1%. To investigate the influence of pain-associated regions on the structural network, we have estimated the average nodal importance of the postcentral gyrus, insular cortex, anterior cingulate cortex, and thalamus [8] using the betweenness centrality (BC) and eigenvector centrality (EC). Both the BC and EC are measures of nodal importance, where the BC relates to how many times a specific node is included in the shortest path, and the EC is a measure of the relative importance of a node in the network.
Statistics
Potential group (iSFN, SFN-SCN9A and HC) differences of the BC and EC of the pain-associated regions were evaluated using multivariable linear regression analysis, corrected for age and sex. To ensure that our results are driven by differences of nodal importance in the pain-associated regions and not by global differences, we have normalized the BC and EC of the pain-associated regions to the average BC and EC of all regions. Subsequently, to investigate whether the nodal importance of the pain-associated regions relate to the self-reported maximum pain, multivariable linear regression models were used, where the BC and EC of the pain-associated regions were used as independent variable, and the VAS-score as dependent variable with age and sex as covariates. Moreover, to assess whether the relation differs between the iSFN and SFN-SCN9A groups, an interaction effect model was used where group (iSFN and SFN-SCN9A) and an interaction term (group*VAS-score) were added to the model.
Results
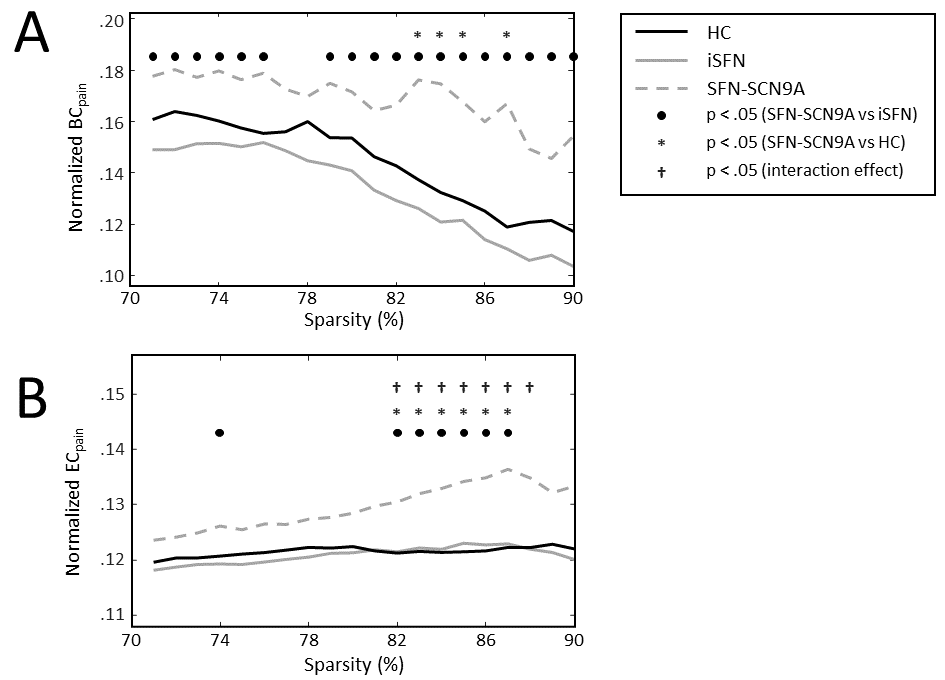
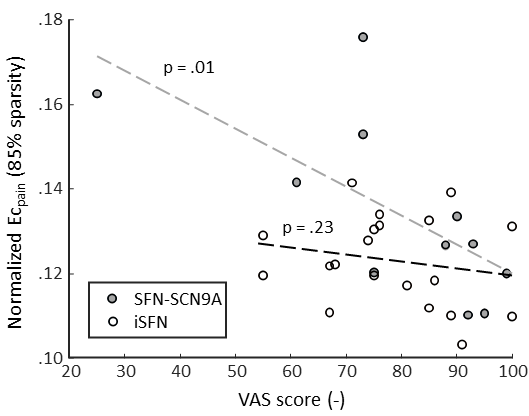
The BC of the pain-associated regions (BCpain) was higher in the SFN-SC9A group compared to HCs (sparsity ranges 71-76% and 79-90%) as well as compared to iSFN (sparsity values 83-85% and 87%) (Figure 1A). The EC of the pain-associated regions (ECpain) was also higher in the SFN-SC9A group compared to HCs (sparsity values 74% and 82-87%) as well as compared to iSFN (sparsity range 82-87%) (Figure 1B). The BCpain did not relate to the VAS-score for either the iSFN or the SFN-SCN9A group. However, the ECpain did relate significantly to the VAS-score in the SFN-SCN9A group (sparsity values 74% and 80-87%). Moreover, the interaction model revealed a significant interaction, i.e., that the relation between ECpain and VAS-score is significantly different between the iSFN and SFN-SCN9A groups (sparsity value 82-88%). The relation between ECpain and VAS-score is shown in Figure 2 for 85% sparse networks.Discussion & Conclusion
We observed cerebral white matter network differences in genetic SFN compared to iSFN and HC. Both measures of nodal importance reveal an increase in centrality of the pain-associated regions in the SFN-SCN9A group with respect to iSFN and HC. Interestingly, a prior study also reported a higher nodal importance in pain associated regions in subjects with burning mouth syndrome [9]. Moreover, in the SFN-SCN9A group, a higher ECpain related to a lower self-reported maximum pain. Combined with the group differences, where a higher ECpain was found in the SFN-SCN9A group, this shows that SCN9A-associated SFN has a distinct structural pain pathway, which may be indicative of a compensatory mechanism where the organization of the structural network is altered to inhibit the response to pain.Acknowledgements
No acknowledgement found.References
[1] G. Devigili et al., “Diagnostic criteria for small fibre neuropathy in clinical practice and research,” Brain, vol. 142, no. 12, pp. 3728–3736, 2019, doi: 10.1093/brain/awz333.
[2] I. Eijkenboom et al., “Yield of peripheral sodium channels gene screening in pure small fibre neuropathy,” J. Neurol. Neurosurg. Psychiatry, vol. 90, no. 3, pp. 342–352, 2019, doi: 10.1136/jnnp-2018-319042.
[3] P. Y. Geha, M. N. Baliki, R. N. Harden, W. R. Bauer, T. B. Parrish, and A. V. Apkarian, “Clinical Study The Brain in Chronic CRPS Pain : Abnormal Gray-White Matter Interactions in Emotional and Autonomic Regions,” Neuron, vol. 60, no. 4, pp. 570–581, 2008, doi: 10.1016/j.neuron.2008.08.022.
[4] B. M. Ellingson et al., “Diffusion tensor imaging detects microstructural reorganization in the brain associated with chronic irritable bowel syndrome,” Pain, vol. 154, no. 9, pp. 1528–1541, 2013, doi: 10.1016/j.pain.2013.04.010.
[5] R. S. Desikan et al., “An automated labeling system for subdividing the human cerebral cortex on MRI scans into gyral based regions of interest,” Neuroimage, vol. 31, no. 3, pp. 968–980, 2006, doi: 10.1016/j.neuroimage.2006.01.021.
[6] A. Leemans, B. Jeurissen, J. Sijbers, and D. Jones, “ExploreDTI: a graphical toolbox for processing, analyzing, and visualizing diffusion MR data,” in Proceedings 17th Scientific Meeting, International Society for Magnetic Resonance in Medicine, 2009, vol. 17, no. 2, p. 3537.
[7] M. A. De Reus and M. P. Van Den Heuvel, “Estimating false positives and negatives in brain networks,” Neuroimage, vol. 70, pp. 402–409, 2013, doi: 10.1016/j.neuroimage.2012.12.066.
[8] N. Witting, R. C. Kupers, P. Svensson, and T. S. Jensen, “A PET activation study of brush-evoked allodynia in patients with nerve injury pain,” Pain, vol. 120, no. 1–2, pp. 145–154, 2006, doi: 10.1016/j.pain.2005.10.034.
[9] R. Kurokawa et al., “Structural connectivity changes in the cerebral pain matrix in burning mouth syndrome: a multi-shell, multi-tissue-constrained spherical deconvolution model analysis,” Neuroradiology, vol. 63, no. 12, pp. 2005–2012, 2021, doi: 10.1007/s00234-021-02732-9.
Figures