2680
Measuring structural connectivity in migraine: the impact of correcting for region volumes1Institute for Systems and Robotics- Lisboa and Department of Bioengineering, Instituto Superior Técnico, Universidade de Lisboa, Lisbon, Portugal, 2Learning Health, Hospital da Luz, Lisbon, Portugal, 3Imaging Department, Hospital da Luz, Lisbon, Portugal, 4Neurology Department, Hospital da Luz, Lisbon, Portugal, 5Center for Interdisciplinary Research in Health, Universidade Católica Portuguesa, Lisbon, Portugal
Synopsis
Keywords: Brain Connectivity, Data Analysis, Migraine
When studying structural brain connectivity, there are many normalization strategies that can be employed, however, there is still no consensus on which one is best to use. Hence, in this study, we investigated the impact of normalizing by the region volumes in the context of migraine as this is sometimes done to avoid bias towards higher connectivity in bigger regions. Several metrics showed significant differences between normalization strategies and, more critically, nodal metrics displayed different behaviours when compared between controls and migraineurs.Introduction
Migraine is one of the most prevalent neurological disorders in the world, affecting about 17% of the population worldwide1. Recent studies have suggested that its causative mechanisms have a neural basis1 and so there has been an increase in studies investigating microstructural changes in the brain of migraineurs. Brain function relies on a complex wiring architecture with efficient local processing (segregation) and rapid information exchange (integration); in a neurological disease such as migraine, the balance between integration and segregation can be disrupted. Many researchers have studied brain structural connectivity based on tractography performed on diffusion MRI (dMRI) using graph theory approaches to investigate these alterations2-5. However, there is currently no consensus on whether normalization by the average volume of the connected regions is advisable to avoid a possible bias towards increased connectivity in bigger regions. In this study we evaluated the impact of applying such a normalization in the context of migraine.Methods
Data acquisition and preprocessing: dMRI images were acquired in 14 episodic menstrual migraine patients without aura (36±9yrs) during the interictal phase, and a control group of 15 healthy women (31±7yrs) scanned in the corresponding phase of their menstrual cycle (post-ovulation). The images were acquired in a 3T Siemens Vida MRI system with a 64-channel RF-receive head coil with the following parameters: TR=6800, TE=89ms, 66 slices, in-plane GRAPPA factor 2, SMS factor 3, 2mm isotropic resolution. The sampling scheme included three diffusion shells with b=400, 1000, 2000s/mm2 along 32, 32, 60 gradient directions, respectively, and 8 non-diffusion-weighted volumes. Data preprocessing was done following the DESIGNER pipeline6. The distribution of region volumes considering the AAL116 atlas parcelation7 was also calculated across all subjects.Tractography and Connectomics: To estimate the fibre orientation density functions, multi-shell multi-tissue constrained spherical deconvolution was used in MRtrix8. The anatomically constrained tractography framework9 was used and thus, prior to tractography, five-tissue-type segmentation images were obtained. Afterwards, probabilistic tractography was performed, with 10 million streamlines per subject, with a maximum length of 25cm and a step size of 1mm. The next step was to apply the Spherical-deconvolution Informed Filtering of Tractograms (tcksift2) algorithm10. After this, the connectivity matrix was built from the streamlines calculated and the AAL116 atlas. This matrix is symmetric and self-connections were set to zero. The impact of normalization by the volume of the regions - (N1) using the "-scale_invnodevol" option in tck2connectome was evaluated versus no normalization (N2). Afterwards, five global metrics were calculated - the average normalized node strength, the normalized characteristic path length, the normalized global efficiency, the average clustering coefficient, and the modularity - as well as two nodal metrics - normalized nodal strength and the betweenness centrality - for each connectivity matrix of each subject using the Brain Connectivity Toolbox11 in MATLAB. The term “normalized” for the metrics indicates that the ratio was computed for the respective metric relative to a random equivalent network. The metrics were compared between N1 and N2 using a t-test and between controls and migraineurs using a Mann Whitney U test.
Results and Discussion
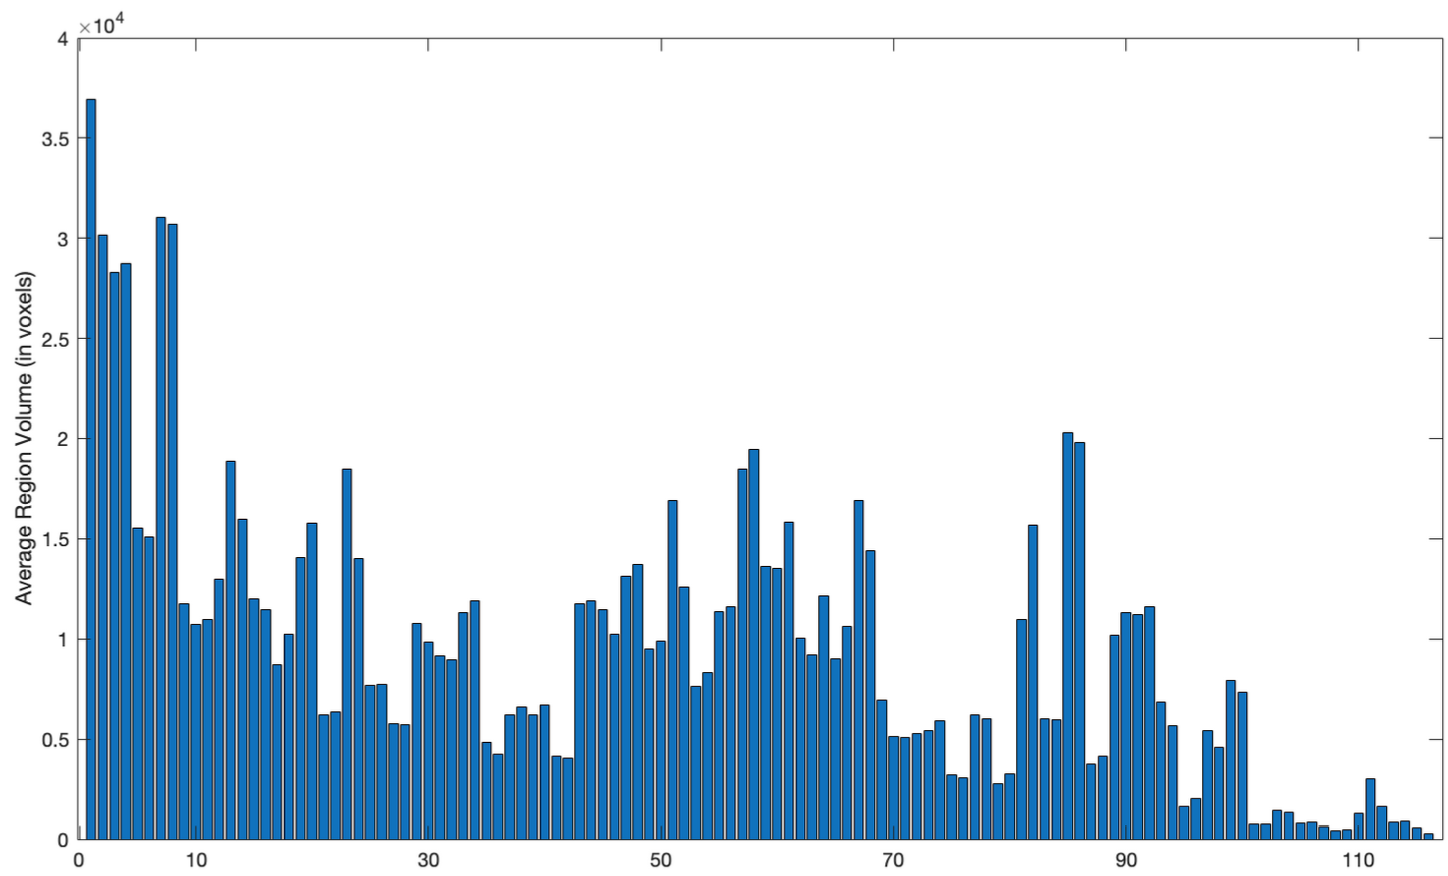
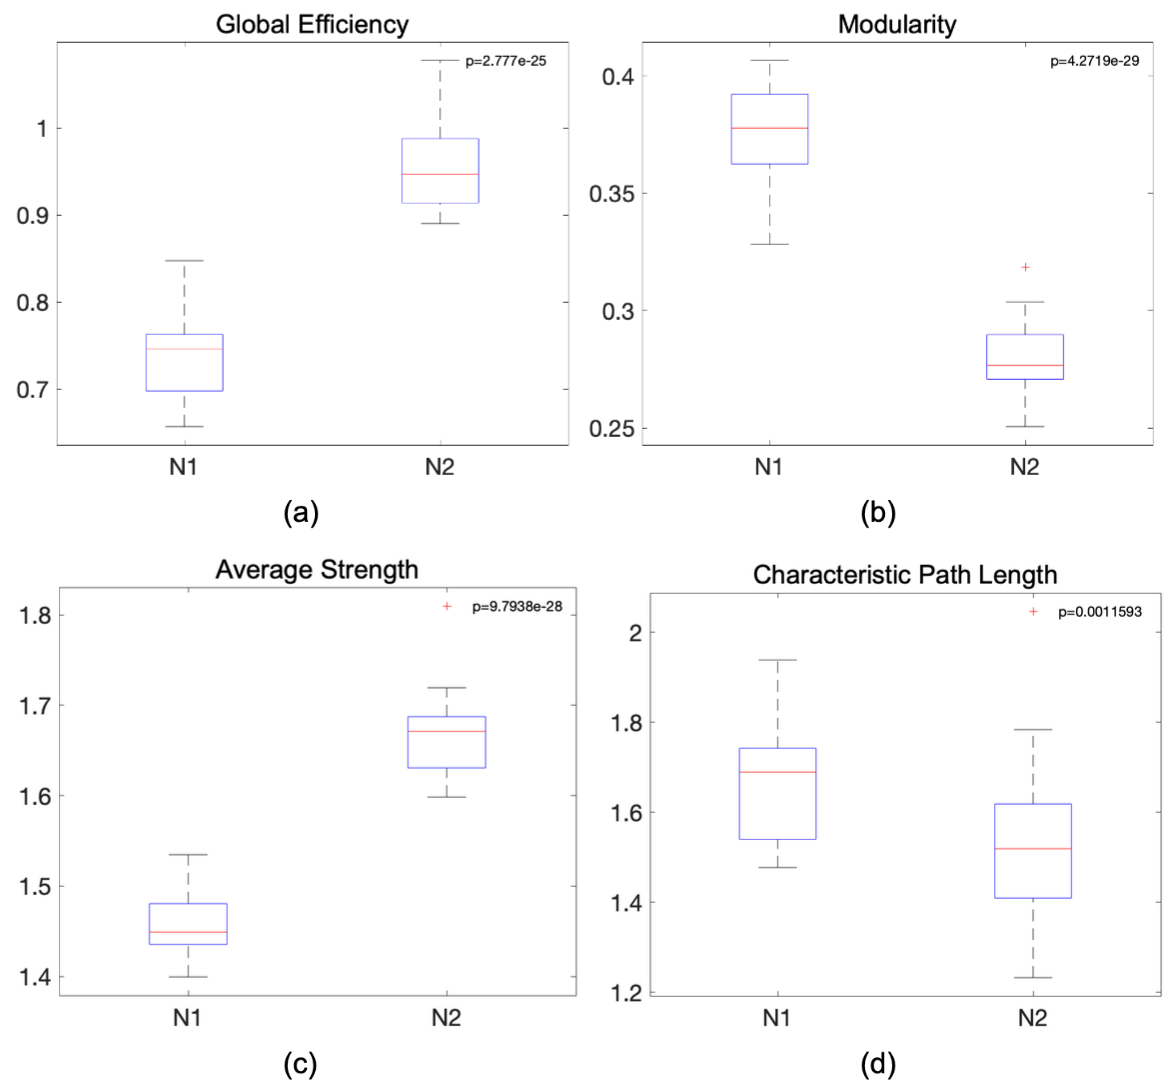
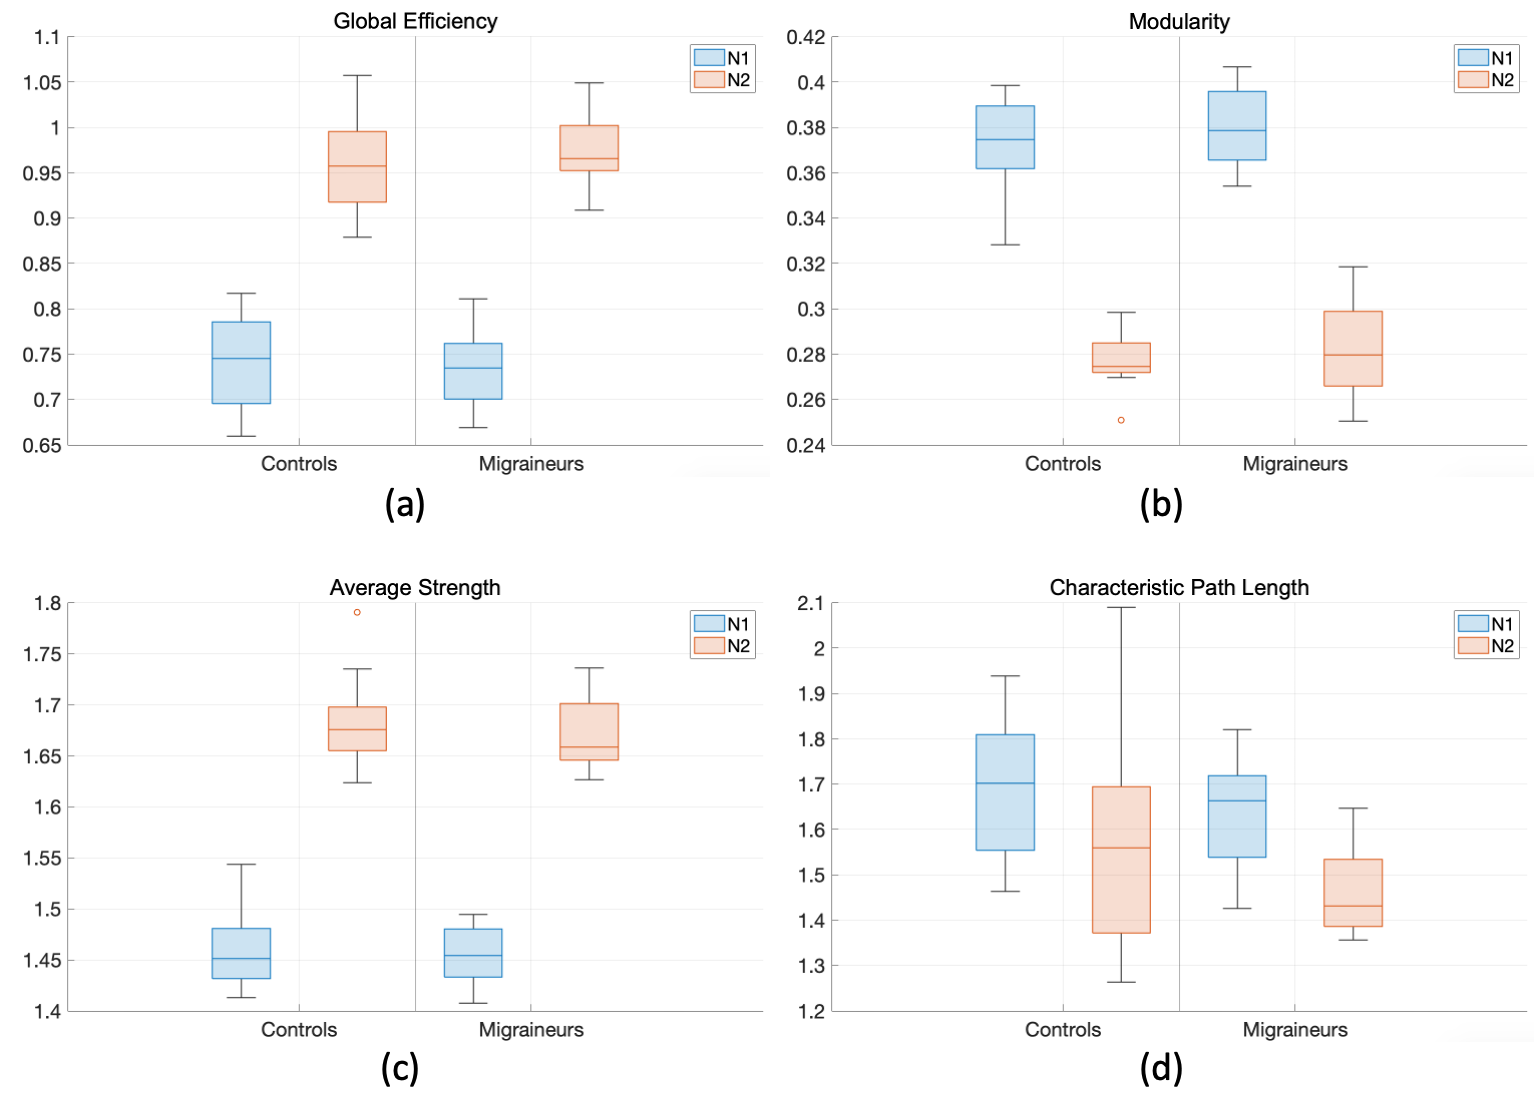
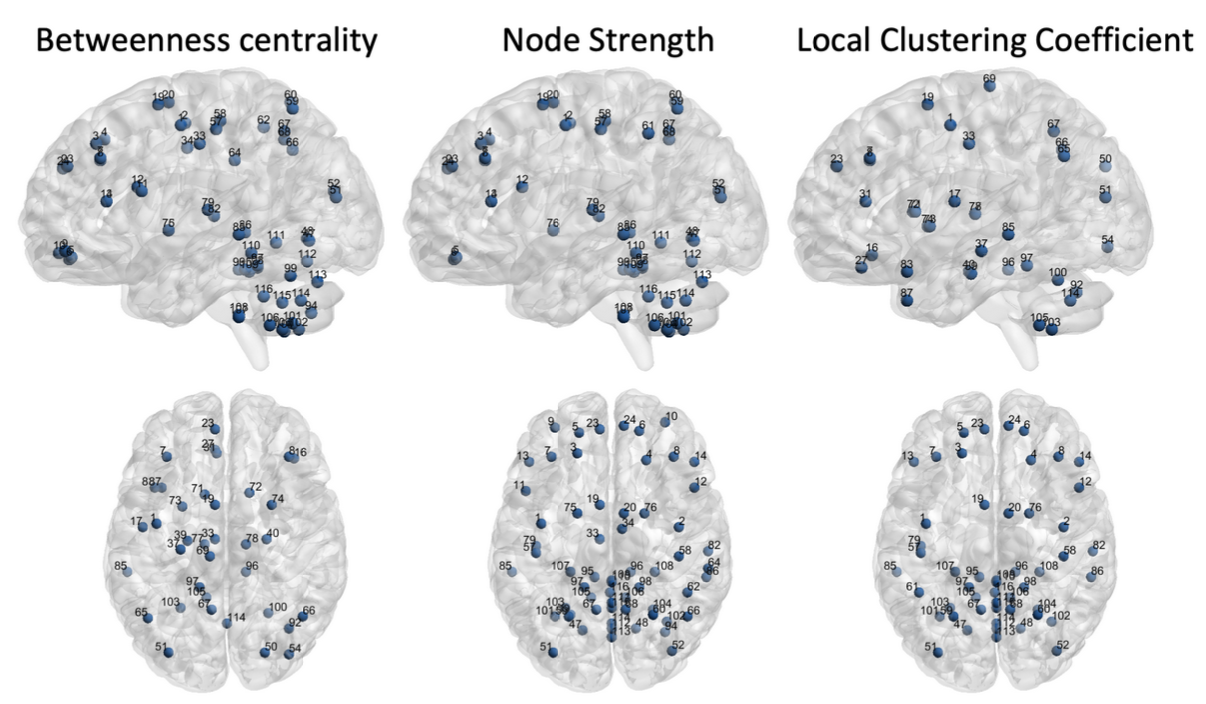
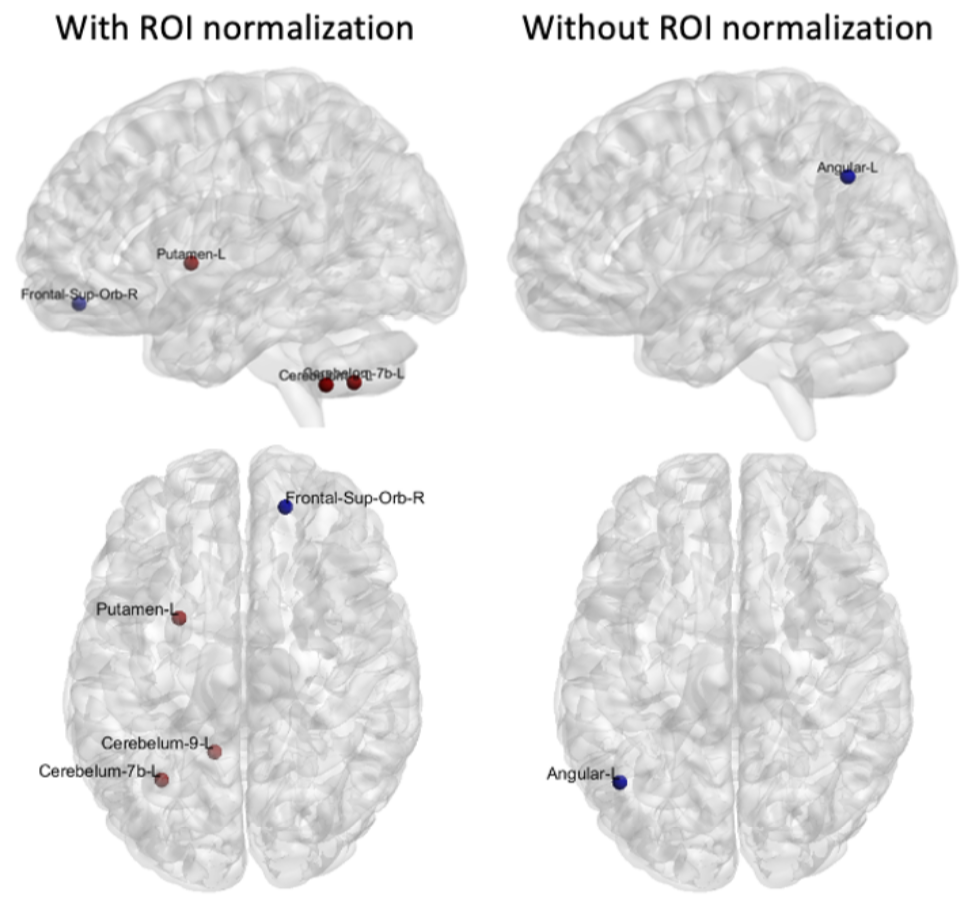
The AAL116 atlas has a non-uniform distribution of region volumes among all subjects (Figure 1), where nodes such as the cerebellum, vermis, putamen, and the thalamus present smaller volumes. All global metrics were significantly different (p<0.05 corrected with Bonferroni correction) between normalizations except for the normalized clustering coefficient. Namely, the normalized global efficiency and the average normalized strength were significantly increased in N2, and modularity was significantly decreased in N2 (Figure 2). Additionally, the distribution is also different within groups between normalizations: for instance, modularity and average normalized strength in the midcycle phase of controls, and global efficiency in the interictal phase of migraineurs (Figure 3). Regarding the nodal connectivity metrics, most nodes display a significant difference among normalizations (Figure 4). These results show the impact that the normalization strategy has on the connectivity metrics. Concerning the differences between groups (controls vs migraineurs), although these would not survive multiple comparison correction using the Bonferroni approach, it can be seen that when there is a volume normalization, some metrics of smaller nodes become more significant: for instance, when controls are compared to migraineurs, the betweenness centrality of the putamen and of smaller nodes of the cerebellum become more significant, with p<0.05 uncorrected (Figure 5). This comes to show that, especially when comparing nodal metrics, the normalization strategy chosen is of great importance since it will yield very different results when comparing between groups.Conclusion
This work demonstrates that applying a normalization by the average region volume may significantly impact the values of the extracted connectivity metrics and that this may particularly influence the results for the comparisons of nodal metrics across groups.Acknowledgements
We acknowledge the Portuguese Science Foundation through grants SFRH/BD/139561/2018, PTDC/EMD-EMD/29675/2017, LISBOA-01-0145-FEDER-029675 and UIDB/50009/2020.References
1. Hoffmann, J., Baca, S. M., & Akerman, S. (2017). Neurovascular mechanisms of migraine and cluster headache. J. Cereb. Blood Flow Metab., 39(4), 573–594. doi: 10.1177/0271678X17733655.
2. Silvestro, M., Tessitore, A., Caiazzo, G., Scotto di Clemente, F., Trojsi, F., Cirillo, M., Russo, A., et al (2021). Disconnectome of the migraine brain: a “connectopathy” model. J. Headache Pain, 22(1), 1–11. doi: 10.1186/s10194-021-01315-6.
3. Planchuelo-Gómez, Á., García-Azorín, D., Guerrero, Á. L., Aja-Fernández, S., Rodríguez, M., & de Luis-García, R. (2019). Structural connectivity alterations in chronic and episodic migraine: A diffusion magnetic resonance imaging connectomics study. Cephalalgia, 40(4), 367–383. doi: 10.1177/0333102419885392.
4. Dai, L., Zheng, Q., Chen, X., Wang, J., Peng, Y., Hu, C., ...Li, Y. (2021). Altered brain structural topological properties and its correlations with clinical characteristics in episodic migraine without aura. Neuroradiology, 63(12), 2099–2109. doi: 10.1007/s00234-021-02716-9.
5. Li, K., Liu, L., Yin, Q., Dun, W., Xu, X., Liu, J., & Zhang, M. (2017). Abnormal rich club organization and impaired correlation between structural and functional connectivity in migraine sufferers. Brain Imaging and Behavior, 11(2), 526–540. doi: 10.1007/s11682-016-9533-6.
6. Ades-Aron, B., Veraart, J., Kochunov, P., McGuire, S., Sherman, P., Kellner, E., Fieremans, E., et al. (2018). Evaluation of the accuracy and precision of the diffusion parameter EStImation with Gibbs and NoisE removal pipeline. Neuroimage, 183, 532–543. doi: 10.1016/j.neuroimage.2018.07.066.
7. Tzourio-Mazoyer, N., Landeau, B., Papathanassiou, D., Crivello, F., Etard, O., Delcroix, N., Joliot, M., et al. (2002). Automated anatomical labeling of activations in SPM using a macroscopic anatomical parcellation of the MNI MRI single-subject brain. Neuroimage, 15(1), 273–289. doi: 10.1006/nimg.2001.0978.
8. Tournier, J.-D., Smith, R., Raffelt, D., Tabbara, R., Dhollander, T., Pietsch, M., Connelly, A. et al. (2019). MRtrix3: A fast, flexible and open software framework for medical image processing and visualisation. Neuroimage, 202, 116137. doi: 10.1016/j.neuroimage.2019.116137.
9. Smith, R. E., Tournier, J.-D., Calamante, F., & Connelly, A. (2012). Anatomically-constrained tractography: improved diffusion MRI streamlines tractography through effective use of anatomical information. Neuroimage, 22705374.
10. Smith, R. E., Tournier, J.-D., Calamante, F., & Connelly, A. (2015). SIFT2: Enabling dense quantitative assessment of brain white matter connectivity using streamlines tractography. Neuroimage, 26163802.
11. Rubinov, M., & Sporns, O. (2010). Complex network measures of brain connectivity: Uses and interpretations. Neuroimage, 52(3), 1059–1069. doi: 10.1016/j.neuroimage.2009.10.003.
Figures